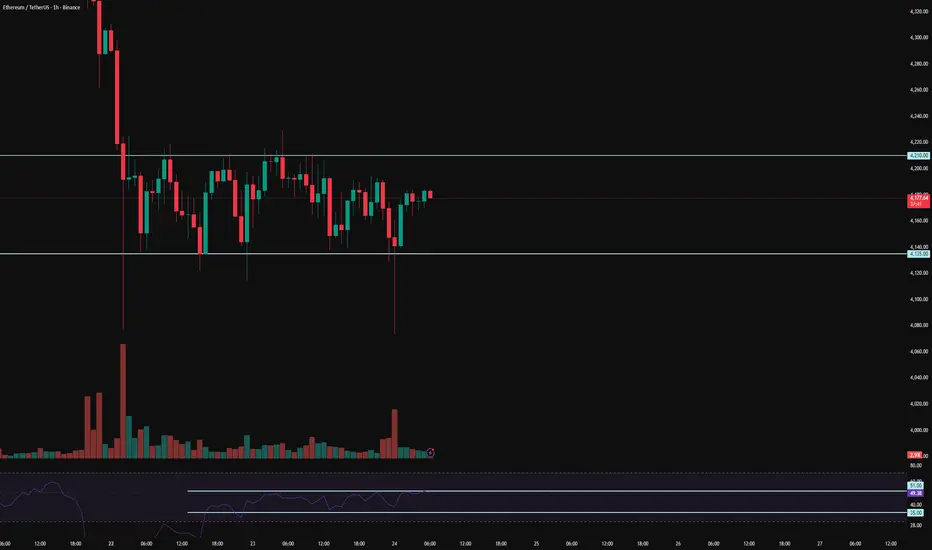
ETH Oversold Again – Is a Bounce Coming?Ethereum (ETHUSDT) on the 4H chart is showing signs of oversold conditions as the RSI once again dips below the 30 level. This setup has historically aligned with local bottoms, where ETH tends to bounce back shortly after reaching such extreme levels of selling pressure. The current price action around $4,170 highlights a critical zone to monitor for potential reversal.
If ETH can hold this level and buying momentum steps in, a relief rally could follow in the short term. However, if weakness persists, further downside retests cannot be ruled out. Traders should closely watch RSI recovery and volume confirmation for signals of a stronger rebound.
Trade ideas

ETH - Current Levels Post Rate CutHere is the chart for pre rate cuts:
After about a week of price action development we have a much better idea for the next potential move for ETH.
After the rate cut (vertical purple line) we saw price have a small rally followed by a swift move to the downside.
Our green trendline (current support trendline) was breached which caused a crash from around $4,400 to $4,070.
Now price has established a clear low for the time being around the $4,070 level. This shows what looks like a TRIPLE BOTTOM (black arrows + black ray)!
There is currently strong demand at the level which should help push price back to the $4,400-$4,500 level.
If we do so this move to the upside it will be very important to watch how price action plays with our green support trendline. Now that price is below that trendline, any retest could act as a new level of sell pressure.
Right now things look good for a move back to that level, but if our triple bottom around $4,070 is closed below then a move into that macro support range will be likely.

ETHDCA zone 4100-4000 , Targeting 4384. Losing the 4150 area could potentially lead us down to the lower range where steeper liquidity is. considering BTC will be bouncing from 110k to 114k.

#ETHUSDT 4H ChartPrice is still consolidating with no major changes. MACS is neutral, RSI is sold and EMAs are turning bearish. Price needs to break and close above the resistance at $4,275 in order to expect further bullish movements. Waiting for confirmation.

ETH Analysis: Deeper Pullback in PlayETH is still trading within a broader uptrend channel, but recently, the price has started to pull back after a significant rally. After pushing up too far, the market is now taking a breather and recalibrating.
From a technical standpoint, this pullback is completely normal and healthy after such a strong move. Pullbacks like this are part of any bullish trend, providing the market a chance to reset. If the pullback continues, the next target could be the 3,600 support area, where multiple key factors converge: horizontal support, trendline support, and the 0.618 Fibonacci retracement level.
The 3,600 level is crucial. If ETH holds strong here and shows signs of a reversal, it could be a solid entry point for the next leg up. However, if the price breaks below this level, we may see deeper downside, and the current bullish structure could start to break down.
As always, confirm your setups before entering and make sure your risk management is solid. Stay alert for the next opportunities!

ETH 1H Analysis - Key Triggers Ahead | Day 26❄️ Welcome to the cryptos winter , I hope you’ve started your day well.
⏰ We’re analyzing ETH on the 1-Hour timeframe.
👀 On the 1-hour timeframe, Ethereum is currently ranging after its recent drop, sitting in a decision-making zone. It already faked the range low once and bounced back up, creating a clean trading structure. If ETH breaks above the $4,210 resistance, it could complete its correction and push higher. On the other hand, if ETH continues its deeper correction, a break and confirmation below the $4,135 support would open the way to lower levels.
🧮 Looking at the RSI oscillator, it’s now hovering around the 50 zone. A cross above 51 could trigger a bullish breakout, while a cross below 35 would suggest Ethereum is heading for a deeper correction.
🕯 Candle size and volume have shrunk inside this range, showing clear consolidation. Buyers and sellers are in a tug-of-war, and we’d prefer not to trade in these tight squeezes with heavy volume until a clear winner emerges. A breakout of the range will likely need strong “whale candles” to confirm direction.
💸 The ETH/BTC pair also shows a similar structure — after its recent drop, it has entered a tight consolidation pattern that mirrors the price action seen against USDT.
🧠 For trading ETH, patience is key. Wait to see which side Ethereum chooses to break out from. Once the range high or low (outlined above) is taken out with confirmation, we can look for a position in that direction.
❤️ Disclaimer : This analysis is purely based on my personal opinion and I only trade if the stated triggers are activated .
Ethereum (ETH): Nothing Is Lost Yet | Double Bottom | Bullish!The game plan remains the same; we are looking for a smaller MSB and then a reclaim of $4,400 before a new ATH.
Yesterday we had another smaller sell-side dominance wave, but buyers took back control pretty quickly, which resulted in a long wick and established a solid support zone (just like Bitcoin did).
Swallow Academy

ETH - Near ATH… Price Discovery Reload?BINANCE:ETHUSDT ETH has marched back to its cycle ceiling on the weekly after a long range. We’re now pressing the final resistance band around $4,880–$5,000—where a clean breakout would shift ETH into price discovery again.
Confluence is strong here: prior ATH supply + round-number magnet + momentum structure. If buyers clear $5K with a weekly close, I’ll look for the next leg toward $6.5K–$7.25K, then a stretch path into five digits as discovery unfolds. If rejected, a healthy retest toward $4,100–$3,550 would keep the uptrend intact while the range persists.
What’s your plan => buy the weekly breakout above $5K, or wait for a dip into $4.1K for better risk–reward? 🤔
⚠️ Disclaimer: This is not financial advice. Always do your own research and manage risk properly.
📚 Stick to your trading plan regarding entries, risk, and management.
Good luck! 🍀
All Strategies Are Good; If Managed Properly!
~Richard Nasr

Ethereum: Bounce From Support, Eyes on $4,740Ethereum: Bounce From Support, Eyes on $4,740
Ethereum has bounced from the $4,050–$4,100 support zone.
If momentum continues, the next targets are $4,335 and $4,495, with the main resistance at $4,740.
As long as ETH holds above the support, the outlook is bullish with potential continuation upward.
We are still in an uptrend and the current downtrend may have been a moment of accumulation before ETH moves further. We may be in something more complex and growing still.
A drop below the support zone of 4050 could change the scenario.
You may find more details in the chart!
Thank you and Good Luck!
❤️PS: Please support with a like or comment if you find this analysis useful for your trading day❤️

ETH Update📊 Current Setup
ETH’s just floatin’ in consolidation mode 😴. But zooming out on the higher TFs, the tide looks like it’s leanin’ toward an upward retrace 🌊.
🚦 Scenarios
👉 If this range breaks to the upside, first target’s hangin’ around $4400 🎯.
👉 If not, we’re stuck in chop city — no clean wave, no clean ride.
🧭 My Take
Patience = profits 💯. Sometimes the best move is lettin’ the chart tell its story instead of forcing a trade.
❓ What’s Your Read?
You think ETH’s ready to break out, or do we drift sideways longer? Drop your vibe below 👇

ETH Accumulation Trap ENTRY NOWI put analysis in previous ETH setup today.
TP Sl entry are good to go on this trade. The next hour might need to temporarily lift SL. Trade smart?!

Ethereum Bounces From $4,161 Zone as Bulls Eye ReversalEthereum is holding firm at $4,161, a level reinforced by the 0.618 Fibonacci retracement and VWAP SR. Traders are watching for a bottoming structure to confirm a potential reversal.
Ethereum’s correction has carried price into one of its most technically significant zones. The $4,161 level is not only structurally important but also aligns with multiple technical tools, including the 0.618 Fibonacci retracement and VWAP SR. This confluence makes the current area a strong candidate for reversal, though confirmation of a bottoming structure is still required on the lower timeframes.
Key Technical Points:
- $4,161 Support Zone: Anchored by Fibonacci and VWAP SR.
- Bottoming Structure Needed: Short-term reversal hinges on confirmation.
- Macro Trend Intact: ETH remains within long-term bullish trajectory.
Main Analysis:
Ethereum’s ability to respect confluence zones has been a hallmark of its market structure in recent months. The current bounce at $4,161 is another example, aligning with both the 0.618 Fibonacci retracement and the VWAP SR. These tools highlight the strength of this level, making it a technical battleground between bulls and bears.
While the bounce is encouraging, traders must wait for confirmation of a bottoming structure. Without a clear reversal signal — such as a double bottom, higher low, or bullish divergence — the risk of another leg down remains. However, given Ethereum’s placement in a macro bullish uptrend, the probability of this zone holding is strong.
Momentum indicators are also beginning to stabilize after recent corrective pressure. This suggests selling exhaustion, which often precedes accumulation phases before the next impulse. If bulls can sustain demand here, Ethereum could rotate back into resistance levels, continuing its larger uptrend.
Market structure context further supports the bullish case. ETH has consistently established higher lows, and another hold here would reinforce that pattern. Historical reactions from confluence zones like this have led to meaningful rallies, adding conviction to the current setup.
What to Expect in the Coming Price Action:
Ethereum is likely to confirm a reversal if a bottoming structure forms at $4,161. A bounce from this confluence could drive price back into resistance zones, while failure would open the door for deeper testing. Overall, the macro bullish structure remains intact.

ETH is Sinking Deep: Strong Downtrend and Big SELL Opportunity!Currently, ETH/USDT is under strong selling pressure due to both fundamental and technical factors . According to the latest news, over 2.6 million ETH (equivalent to about $11.7 billion ) is waiting to be withdrawn from the Ethereum network. When these ETH are released, it will create significant selling pressure, greatly affecting ETH's price in the short term. This could lead to investor anxiety and a potential sell-off, diminishing confidence in the market.
From a technical perspective , the chart shows a descending wedge, with lower highs and the current bottom becoming weak. It is highly likely that ETH will drop to the support level at $4,110 before making any new moves.
Given these factors, the appropriate trading strategy is to open a SELL order if the price cannot break through the resistance at $4,410 and falls below the support at $4,110. The Stop Loss should be placed at $4,450, just above the resistance, and Take Profit at $4,110.
In conclusion, ETH is facing a strong downtrend in the short term. Investors should keep an eye on the market and open a SELL order as the price continues to drop.

ETH Accumulation TrapdoorTrade Type: Controlled Bounce Long
Smart-money accumulation schematic, not trend breakout
3x Leverage (Max)
Valid potential 3–7 day tactical window
Pre-October macro bull run move
🔸 Entry Zone 1: $3,999 – $4,010
Must see all:
Only if 5m/15m BOS + FVG tap
LTF volume spike into structure
Bullish engulfing over previous 3 candles
Low skew in funding (<0.1%)
No macro weakness on BTC/ES
🔸 Entry Zone 2: $3,880 – $3,900
Must see all:
4H order block/FVG fill
LTF CHoCH + BOS
Wicking below $3,888 followed by fast recovery
No 4H close below $3,850
Entry 1 fills first, Entry 2 follows only if pullback comes.
Hard Stop: $3,800
Stop details: 1H/4H close + follow-through. Total exit. No re-entry without full reanalysis.
Soft Exit Protocols
At $3,850 sweep + spike: reduce 50%
$3,820 close without reversal: scale out 75%
HTF bearish engulfing near $3,800: full exit
TP Protocol
TP1: $4,130
Auto-sell 60% of position
TP2: $4,250
Close remainder or trail to $4,320
Optional TP3: $4,320 – $4,350
For breakout runners only
Trail SL under 1H swing low every $15 move
For Emergency Re-Entry
Scenario: ETH dumps to $2,950 – $3,050
Do not long immediately
Wait for:
Long lower wick rejection
New bullish FVG on 15m/1H
BOS back above $3,150
Then: Long with original TP plan, new SL = $2,850
Risk
Risk per Trade: 1.5% max account equity
Entry 1: 40% allocation
Entry 2: 60% allocation
NO compounding or pyramiding
Leverage Rules
Max 3x isolated
Must have 4H stop loss placed in system
Immediate invalidation:
If BTC breaks below $110.6K: close all ETH longs
If funding spikes above 0.18%: scale down or exit
Not financial advice.

Ethereum analysisIt’s been nearly 44 days that the price has been moving inside a range, and now it has reached the bottom of the range channel.
On the higher cycles, Ethereum’s trend is bullish, and as long as the 3700 support zone is not broken, we should continue to look for long positions.
There’s also a high probability that the price will move toward the decision-making zone. ✅
ETH ANALYSISETH has broken above the long-term trendline, a major structural shift on the weekly chart.
From here, I think price may pull back to retest the trendline along with the bull market support band.
If that retest holds and momentum stays constructive, ETH could bounce strongly and eventually push toward making a new all-time high.
🎯 Conclusion: My view is bullish in the bigger picture — I expect ETH to retest the trendline and bull market support band before attempting a major breakout to new highs.

Eth max pain on this Friday is 3600This Friday :
Btc option max pain 110k
Eth option max pain 3600
We are noticed that 3966 is the 0.382 fibo support for the past 3 weeks uptrend wave. But,
Please don't long at 3966 in this week.
This week trading strategy should be short at 4400. Eth need to test STR (support turn resistance) area before drop. and short it all the way to 3600.
If u like mine trading idea. Please hit me a like, rocket and leave a comment for me.

ETH/USDTCurrently trading in a local consolidation, moving within its range expansion.
After a deviation below the range low, long setups can be considered — but only if confirmation conditions are met.
Potential short opportunities may appear in the 4400–4500 zone, again only with proper confirmations.

Ethereum 3 month candle 1 week left for the 3 month candle to close if it closes about the 3700 resistance then chances are it will continue the up trend hopefully it holds. To much interest from institutions buying eth no way it falls back down again

ETH/USD: Correction Continues, Key Support at 4062.50ETH/USD trades within a long-term bullish trend, but after the Fed’s recent rate cut the pair moved into a correction. Price is testing the lower boundary of the short-term range 4687.50–4062.50 (Murray – , Fibo 23.6%).
• A breakout below 4062.50 could extend the decline toward 3540.00 (Fibo 38.2%) and 3125.00 (Murray , Fibo 50.0%).
• A breakout above 4687.50 would confirm bullish continuation to 5000.00, 5312.50, and 5625.00.
⸻
🔎 Indicators
• Bollinger Bands: flat, range-bound trading.
• MACD: preparing to cross into negative.
• Stochastic: oversold, possible upward reversal.
• Weekly trend remains bullish, but correction toward 3540.00 is possible.
⸻
🏷️ Key Levels
• Resistance: 4687.50, 5000.00, 5312.50, 5625.00
• Support: 4062.50, 3540.00, 3125.00
⸻
📈 Trading Plan
Scenario 1 – SELL STOP
• Entry: 4062.45
• TP: 3540.00, 3125.00
• SL: 4500.00
• Timeframe: 1W
Scenario 2 – BUY STOP
• Entry: 4687.55
• TP: 5000.00, 5312.50, 5625.00
• SL: 4490.00

#ETHUSDT 4H ChartPrice is consolidating on lower timeframes showing no major movements. MACD is showing bearish weakness, RSI is oversold and EMAs are turning bearish. Price is expected to move up and retest the S/R Flip at $4,260 as a short-term target.

Ethereum (ETH): EMAs Have Been Broken | RSI Oversold | Bullish!ETH has broken the lines of EMAs, which have been long-time trend holders, yet this has to be done one way or another to sweep the liquidity from the markets.
Now that is past us,. We are seeing some signs of recovery, where candles are forming some kind of market structure break and taking into consideration that RSI is oversold, EMAs had a sharp breakdown without any retest, and the fact that we are in a bull market overall is a strong sign of potential recovery to happen so that's what we are looking for—the game plan remains the same!
Swallow Academy

ETH 1H Wave Check📊 Current Setup
ETH’s movin’ like BTC’s lil’ bro rn — same structure on the lower TFs. Price is cruisin’ inside that 4125–4200 zone consolidation box.
🚦 Scenarios
👉 If price pops out the top of that box, first wave could send us ridin’ toward $4400 🏄💸.
👉 But without a clean breakout, it’s just sideways chop — patience is still the play.
🧭 My Take
This is classic “wait for the set” surf energy 🌊. No breakout, no ride. Rules of the gang 😏.
❓ What’s Your Vibe?
You think ETH’s ready to catch that next wave, or will it stall out under 4200? Drop your read below 👇
