ETH - 17/09 VS TODAY - MASTERCALL AGAIN! 🏆 #ETH - 17/09 vs Today - Update 🔄
Medium-Term Outlook: “Insane Plays Ahead!” 🔥
🎯Targets hit: $4,000–$4,050 liquidity zone ✔️
Current TA:
🔸Price rejected sharply; H4 looks bearish, RSI is highly oversold.
🔸Short-term: potential for a relief bounce!
🔸Possible scenario: Retest of the $4,300–$4,350 former support ahead? 📈
Weekly Structure
🔹Bias stays bullish long-term.
🔹BUT: Structure reminds me a lot of #BTC right before its massive run!
🔹Are we about to see an extra dip towards $3,700- $3,800 before the next moon mission? (Check chart for context!)📉💣
Short-Term Bias
🔹Price action = Neutral & tricky.
🔹Bulls want a reclaim above $3,780 to keep the upper hand.
🔹Big risk: If we break below $3,780 → likely drop to $3,300–$3,200 range!⚠️
Local Support Zones
$4,070
$4,000
💡Summary
Still bullish medium/long term, but a further correction is very possible before liftoff!
Bulls need to hold $3,780. Below = trouble…Above = game still on for ATH attempts later. 📉
Trade ideas

ETH Swing Long Idea - RDM is in playETH Swing Long Idea
📊 Market Sentiment
FED has resumed its rate-cutting cycle, starting with a 0.25% cut in September, with two more 0.25% cuts expected in the coming months. Additionally, institutional liquidity inflows have accelerated as the U.S. officially adopts crypto as part of its reserves. While inflation remains elevated, the weakening labor market is forcing the FED to ease, driving more capital into risk-on assets.
📈 Technical Analysis
Price is in HTF bullish order flow, so I will only be looking for long setups.
ETH made its all-time high and is currently retracing to gather more energy for higher moves.
Price also ran the HTF Range Low liquidity, which contained significant liquidity — an engineered move I expect to lead the market higher.
📘 Range Deviation Model (RDM)
In this model, I define the HTF Range High/Low. I wait for price to run one side of the range liquidity (either Range High or Range Low), then close back inside the range. That becomes the entry trigger, targeting internal range liquidity first. If HTF trend supports, the opposite range liquidity becomes the full target.
📌 Game Plan
I will be playing the Range Deviation Model (RDM) here.
Looking for a daily close above 4065$ as validation.
🎯 Setup Trigger
Entry after daily close above 4065$.
📋 Trade Management
Stoploss: 4000$
Targets:
TP1: 4484$
TP2: 4700$
TP3: 4965$
💬 Like, follow, and comment if you find this setup valuable!
⚠️ Disclaimer: This content is for informational and educational purposes only and does not constitute financial, investment, or trading advice. Always DYOR before making any financial decisions.

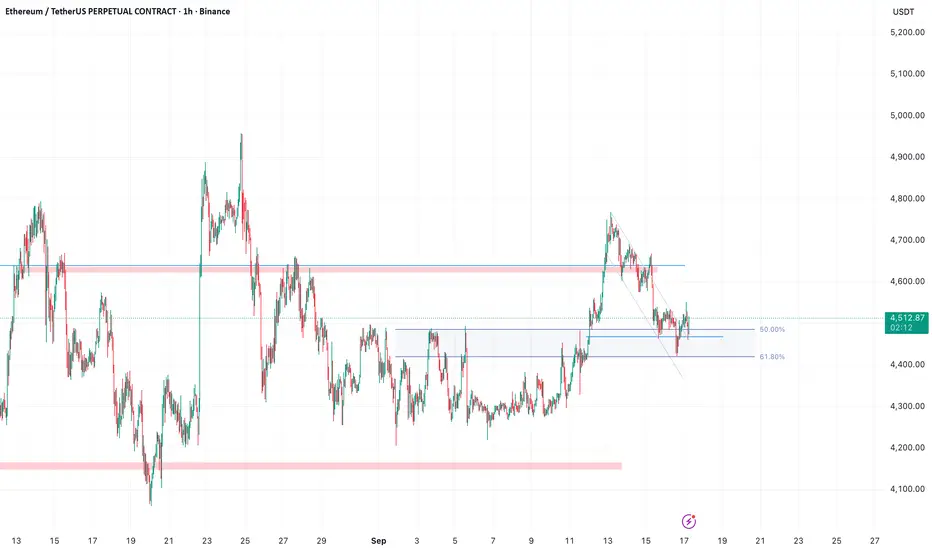
$ETH Cup and Handle --> around ATH {Breakout possibility}While we dance around the break of the previous ATH, there's a likelihood that we see newer, higher prices by the end of the week/month.
Price is around $4500 and sees recurring sponsorship to stay above $4400 (61.8% fib)
Could this be the >$5k/ETH month?
Bullish indicators described in chart
cup and handle pattern
price above 50% fib swing
Ethereum (ETH): Bloody Hell, What a Sharp Start of MondayEthereum is showing similarities to the earlier push where we saw a shakeout (marked in the previous circled zone) before continuation to the upside. Currently, we’re seeing another break of structure, but as long as price holds above EMAs, the setup remains bullish. This could very well be another trap before the next leg up. First target stays $6,000, with the second target at $7,000 if buyers maintain control and secure higher levels.
Swallow Academy
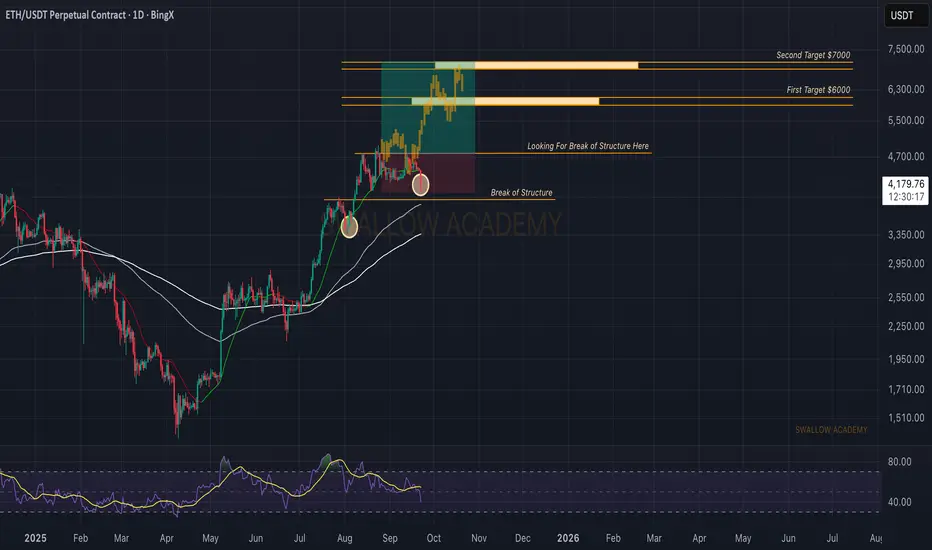
Ethereum (ETH): Failed To Breakout | Waiting For MomentumEthereum is still pressing right against the breakout zone, but buyers haven’t secured it yet. We’re seeing rejection wicks near resistance, showing clear hesitation in the market. As long as the price holds above the lower channel and EMAs, the structure remains bullish. A confirmed breakout here could open the path toward $7,000 first, with $9,000 as the major target.
Swallow Academy

#ETHUSDT 12H ChartPrice broke below the 4h demand zone at $4,400 turning it into a 4h breaker zone. MACD is bearish, RSI is nearly oversold and EMAs are neutral. Price bounced off the support at $4,080 after sweeping the equal lows at $4,200 and we should see a retest of the S/R flip at $4,260 as a short-term target.

Long trade
30min TF overview
Pair: ETHUSDT
Direction: Buyside trade
Date/Session: Fri 19th Sept 2025, NY Session PM
Timeframe: 30-Min
🔹 Trade Details
Entry: 4461.47
Profit Level: 4855.75 (+8.89%)
Stop Level: 4416.04 (-1.00%)
Risk-Reward (RR): 8.59
🔹 Technical Structure
Fair Value Gaps (FVGs):
Overhead FVGs at ~4655 – 4855 are acting as a potential magnet for liquidity.
Liquidity Levels:
Clear sweep of prior lows around 4460 (stop hunt/liquidity grab).
Buyside liquidity resting above 4650–4700.
Order Blocks / Demand Zones:
Strong demand block at ~4450–4460 region, now acting as support.
🔹 Indicators
RSI: Deeply oversold (below 30), hinting at bullish reversal probability.
Volume: Large spike at lows, confirming stop run and potential smart money entry.
Moving Averages: Price reclaiming short-term EMA, indicating early momentum shift.
🔹 Narrative / Trade Rationale
Market engineered a stop hunt into demand at 4460 before reversing.
High volume and RSI oversold strengthen the buy-side reversal case.
The trade aims to capitalise on the move back into inefficiencies (FVGs) left behind by the previous sell-off.

ETH New Update (4H)This analysis is an update of the analysis you see in the "Related publications" section
Honestly, as you know, the market had been ranging for several days without much movement. On the chart, we had signs of a drop, but the drop didn’t happen, and instead the market dropped in a way that was shown.
Considering that the demand zone has held and the market is still ranging, we can return to the scenario of (this analysis () and expect to see some recoveries from Ethereum.
Either Ethereum can get rejected from the identified supply zone, or it can make a new all-time high afterwards.
For risk management, please don't forget stop loss and capital management
When we reach the first target, save some profit and then change the stop to entry
Comment if you have any questions
Thank You

ETHUSDTHello Traders! 👋
What are your thoughts on Ethereum?
Ethereum has recently broken above the key resistance area near 4100, printing a new high slightly above the previous peak. After this breakout, price action has entered a corrective phase, suggesting a healthy pullback.
This correction is currently forming a bullish flag pattern, which may act as a continuation setup.
As long as ETH remains above the highlighted support zone, the bullish scenario remains valid. A confirmed breakout from the flag formation could trigger the next impulsive wave, potentially leading to fresh all-time highs.
Keep a close eye on the flag breakout and watch for bullish momentum to resume once the consolidation completes.
Don’t forget to like and share your thoughts in the comments! ❤️

Understanding Currency Derivatives: Types and Trading Roles1. Types of Currency Derivatives
Currency derivatives come in several forms, each designed to serve specific purposes. The main types are:
1.1 Currency Forward Contracts
What they are: A forward contract is a private agreement between two parties to exchange a specific amount of currency at a predetermined rate on a future date.
Key features:
Customized terms (amount, rate, settlement date)
Traded over-the-counter (OTC), not on exchanges
Use in trade:
Companies use forwards to hedge against currency fluctuations. For example, an exporter expecting $100,000 in 3 months can lock in a rate today, ensuring revenue stability regardless of market movements.
1.2 Currency Futures
What they are: Futures are standardized contracts to buy or sell a currency at a fixed price on a future date. They are traded on exchanges, unlike forwards.
Key features:
Standard contract sizes
Daily settlement (marked-to-market)
Reduced counterparty risk due to exchange involvement
Use in trade:
Futures allow both hedgers and speculators to manage risk. For example, an importer can lock in costs for future purchases in foreign currency using futures contracts.
1.3 Currency Options
What they are: Options give the holder the right, but not the obligation, to buy or sell a currency at a specific price within a certain period.
Types:
Call option: Right to buy
Put option: Right to sell
Use in trade:
Options are popular for hedging with flexibility. For example, an exporter may buy a put option to protect against a falling foreign currency while still benefiting if the currency rises.
1.4 Currency Swaps
What they are: A swap is a contract to exchange cash flows in one currency for cash flows in another over a period.
Key features:
Can involve both principal and interest
Often used between banks or large corporations
Use in trade:
Swaps help companies obtain foreign currency loans at better rates than borrowing directly in foreign markets.
1.5 Cross-Currency Contracts
What they are: These contracts allow the exchange of currencies without involving a common base currency like the USD.
Use in trade:
Useful for companies trading between countries whose currencies are not widely paired, e.g., INR and JPY.
2. Role of Currency Derivatives in Trade
Currency derivatives serve multiple roles in global commerce:
2.1 Hedging Against Currency Risk
Companies engaging in international trade face unpredictable currency movements.
By locking in exchange rates using derivatives, businesses stabilize revenue and costs.
Example: An Indian IT company exporting to Europe can hedge against the euro weakening against the rupee.
2.2 Speculation
Traders and investors use currency derivatives to bet on currency movements to make profits.
Speculation adds liquidity to the market, which indirectly benefits businesses by making it easier to execute hedging strategies.
Example: A trader may buy USD futures if they anticipate the dollar will rise against the rupee.
2.3 Arbitrage Opportunities
Arbitrage involves exploiting price differences in the same currency across different markets.
Currency derivatives allow arbitrageurs to profit from mismatches while keeping markets efficient.
Example: If EUR/USD is slightly higher in one exchange than another, a trader can simultaneously buy low and sell high.
2.4 Portfolio Diversification
Investors use currency derivatives to diversify their portfolios by gaining exposure to foreign currencies.
This can help mitigate risks from domestic market volatility and improve returns.
Example: A mutual fund in India may use currency options to reduce risk exposure from foreign investments.
3. Market Participants
The main participants in currency derivatives markets include:
Hedgers – Companies or institutions aiming to reduce currency risk.
Speculators – Traders aiming to profit from currency movements.
Arbitrageurs – Market participants exploiting price differences across markets.
Market Makers – Entities providing liquidity, ensuring smoother trading operations.
4. Regulatory Framework
In India, currency derivatives are regulated by:
SEBI (Securities and Exchange Board of India): Ensures transparency and fair trading practices.
RBI (Reserve Bank of India): Ensures participants have genuine foreign currency exposure to prevent excessive speculation.
This regulatory framework ensures the market remains safe, transparent, and reliable.
5. Advantages of Currency Derivatives
Risk Management: Protects businesses against unexpected currency fluctuations.
Flexibility: Especially with options, businesses can choose to benefit from favorable movements while limiting losses.
Liquidity: Standardized contracts in futures and options provide liquidity to the market.
Efficient Global Trade: Reduces uncertainty in cross-border transactions, encouraging international business.
6. Challenges and Risks
Market Risk: Currency values can be volatile; wrong predictions can lead to losses.
Counterparty Risk: In OTC contracts, one party may default.
Complexity: Some derivatives like swaps are complex and require expertise.
Regulatory Constraints: In some countries, rules may limit derivative usage or impose restrictions.
Conclusion
Currency derivatives are indispensable tools for modern international trade. They allow businesses to manage risk, stabilize cash flows, and plan effectively. At the same time, they provide opportunities for traders and investors to profit from currency movements and engage in arbitrage.
By understanding and using these instruments responsibly, companies can reduce uncertainty in global transactions, while financial markets benefit from improved liquidity and efficiency.
With increasing globalization and cross-border trade, the importance of currency derivatives will continue to grow, making them a critical part of financial markets worldwide.
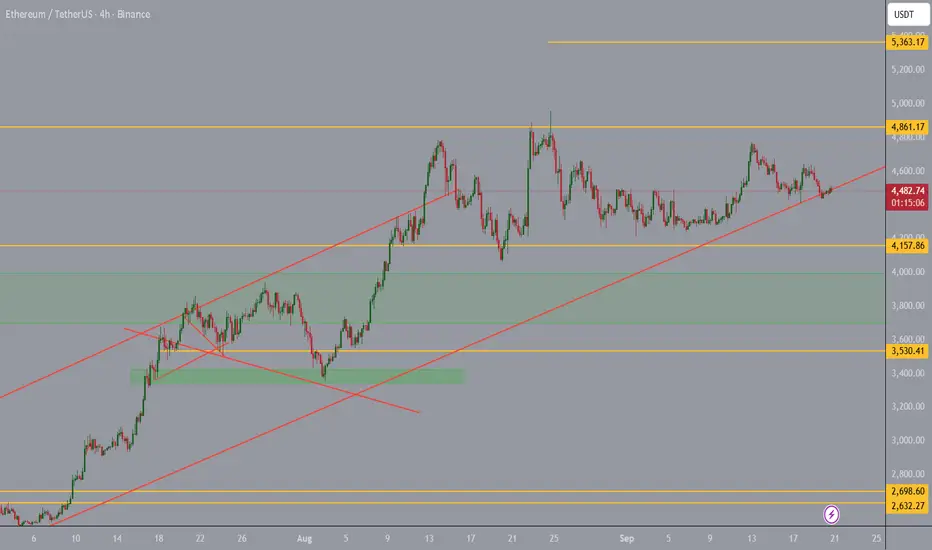
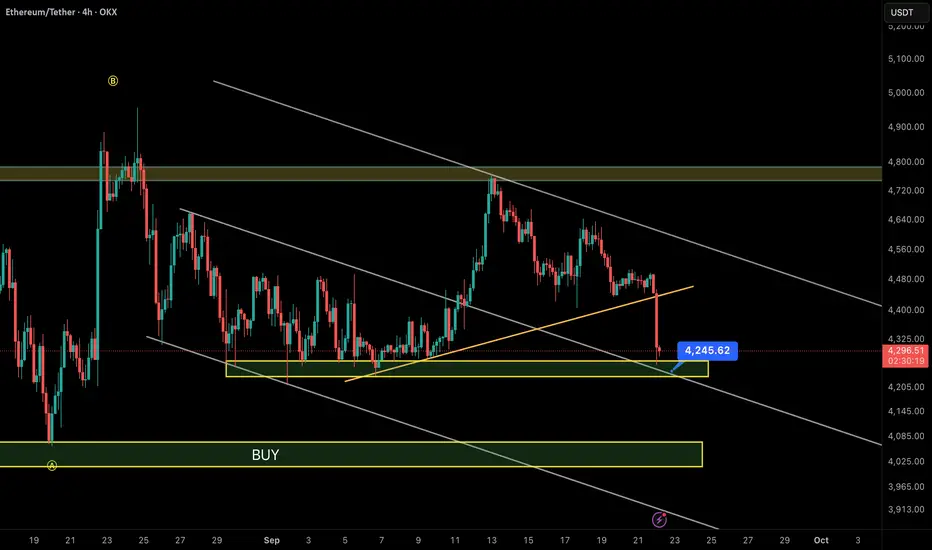
Ethereum at Critical Support – What’s Next?📊 ETH/USDT – 4H Chart Analysis
1️⃣ Descending Channel:
Ethereum is still moving inside a clear descending channel. Sellers remain in control as every rally to the channel top has been rejected.
2️⃣ Trendline Break:
The short-term ascending trendline (orange) has just been broken with strong selling pressure, dragging the price into the $4,200 – $4,250 support zone.
3️⃣ Key Support Zone:
The first major support lies at $4,200 – $4,250. If this level holds, ETH could see a short-term rebound toward $4,400 – $4,600.
4️⃣ Main Buy Zone:
If $4,200 fails, the next strong demand zone sits at $3,950 – $4,100, aligning with the lower boundary of the descending channel. This is where stronger buying interest is expected.
5️⃣ Resistance Levels:
• Near-term: $4,450 – $4,600
• Major: $4,750 – $4,800
⚖️ Summary:
• Bullish scenario: Holding $4,200 → bounce to $4,400 / $4,600.
• Bearish scenario: Losing $4,200 → drop to $4,000 – $3,950 (main BUY zone).
👉 At this stage, trading in the middle of the channel is risky. Safer entries come either near $4,000 – $4,100 or after a confirmed breakout above $4,600.
Volatility Period: Around September 18th (September 17th-19th)
Hello, fellow traders!
Follow us to get the latest information quickly.
Have a great day!
-------------------------------------
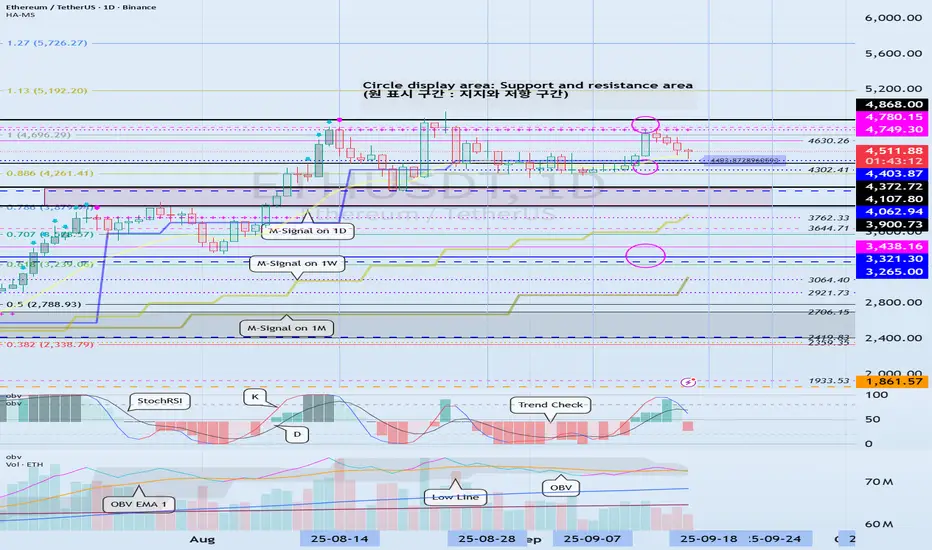
(ETHUSDT 1D Chart)
The 4403.87-4749.30 range, which is the HA-High ~ DOM (60) range, represents a resistance zone.
Therefore, we need to monitor the price movement after the current volatility period, around September 18 (September 17-19).
To sustain the uptrend, the price must remain above the 3900.73-4107.80 range.
From a medium- to long-term perspective, the 3265.0-3321.30 range is a key area.
Considering the above, if it falls below 4403.87,
1st: 4107.80-4372.72
2nd: 3265.0-3321.30
Therefore, it is likely to fall to the first and second levels above.
Therefore, the key question is whether it can find support near 4403.87 after this period of volatility.
-
When trading, it's important to understand the current price level.
I believe there are several ways to determine this.
My basic trading strategy is to determine when to trade.
My basic trading strategy is to buy when support is found in the DOM(-60) ~ HA-Low range and rise, and to sell when it touches the HA-High ~ DOM(60) range.
However, if the price rises in the HA-High ~ DOM(60) range, a step-like upward trend is likely, while if it falls in the DOM(-60) ~ HA-Low range, a step-like downward trend is likely.
Therefore, the basic trading strategy should be a segmented trading strategy.
If you were unable to buy in the DOM(-60) ~ HA-Low range, but the current price is within the DOM(-60) ~ HA-Low range, you should check for support.
Support is determined by checking whether support is found near the HA-Low or DOM(60) indicators.
If you bought when support was found near the HA-Low indicator, the first sell position would be near the DOM(60) indicator.
If you bought when support was found near the DOM(60) indicator, you should execute the trade quickly and effectively.
If the price falls below the purchase price, it would be considered a buy at the high.
To prevent this to some extent, we've utilized several indicators for verification.
First, we utilize the M-Signal indicator on the 1M, 1W, and 1D charts.
That is, if the M-Signal indicator is passing near important support and resistance levels, the presence of support in that area is likely to play a more important role.
Currently, the M-Signal indicator on the 1D chart is passing near 4403.87, so we should consider the area around 4403.87 as a potential important support and resistance level.
Second, we should monitor the movements of auxiliary indicators such as the TC (Trend Check) indicator, the StochRSI indicator, and the On-By-Signal (OBV) indicator.
For the price to continue its upward trend in this important support area,
- the StochRSI indicator must show an upward trend. If possible, it's best to avoid entering the overbought zone.
- The OBV indicator should be showing an upward trend. If possible, it should remain above the High Line.
- The TC (Trend Check) indicator should be showing an upward trend. If possible, it should remain above the 0 level.
By monitoring the movements of the three indicators above, you can determine whether there is support near important support and resistance levels.
However, you should not blindly trust the movements of auxiliary indicators. Even if you have identified the movements of auxiliary indicators, you should always monitor the price movement.
To determine support, you should monitor the price movement for at least 1-3 days.
This is especially important during periods of volatility.
Volatility is a period where you cannot predict the direction of movement, so extra caution is required.
Therefore, if possible, it's better to observe the situation and find a trading opportunity after the volatility period has passed rather than entering a new trade during a volatile period.
-
Thank you for reading to the end. I wish you successful trading.
--------------------------------------------------
- Here's an explanation of the big picture.
(3-year bull market, 1-year bear market pattern)
I'll explain more in detail when the bear market begins.
------------------------------------------------------
Ethereum at Weekly Supply Zone – Possible Drop AheadHello everybody,
Price is currently at the weekly supply zone.
It has broken an upward trendline and pulled back to retest it.
A decline from this area is expected.
The most likely target is the nearest demand zone, around 3800.
Manage your risk and trade safe!

Ethereum Price Steady at $4,500—Here’s What’s Ahead For ETHEthereum’s price is currently trading at $4,468, just shy of the $4,500 resistance. The altcoin has been consolidating near this level, showing resilience even as broader market trends remain mixed.
Given the supportive market sentiment and accumulation trend, Ethereum is poised to reclaim $4,500 as a support floor. Successfully flipping this level could pave the way for ETH to challenge the $4,775 resistance in the coming days.
However, downside risks remain if bearish pressure builds. In such a scenario, Ethereum could lose footing and slip to the $4,307 support level. A drop to this zone would invalidate the bullish thesis temporarily and deepen potential investor losses

ETH 1H Analysis - Key Triggers Ahead | Day 24😃 Hey , how's it going ? Come over here — Winter got something for you!
⏰ We’re analyzing ETH on the 1-Hour timeframe.
👀 On the 1-hour timeframe for Ethereum, we can see that after testing its major buyer zone, ETH bounced and entered a consolidation phase. This sideways movement is mainly due to the weekend slowdown. I’ve highlighted the range boundaries — a breakout above or below will provide us with trading opportunities. ETH is one of the few coins that has managed to hold its ground at a solid price level, showing strong potential for further growth.
🧮 Looking at the RSI oscillator, we’ve identified two key levels 30 (oversell) & 58 (local RSI ceiling) If ETH breaks these levels, it could trigger a breakout from this tight range and start a stronger move.
🕯 Currently, the green candles are larger in size and volume, but since it’s the weekend, ETH has been mostly off traders’ watchlists. We need to wait for the new weekly open to see how market participants will react.
💸 On the ETHBTC pair (1H timeframe), we’re seeing a similar setup to ETHUSDT. A breakout above or below the current range could start the next move. Adding this pair to the watchlist can provide confirmation for Ethereum setups.
🧠 For a long position on ETH, it’s important that the coin enters a clear buying phase — similar to the strong pumps we’ve seen before. Recently, however, ETH has faced profit-taking and sharp sell-offs after rallies. The coming week will show us whether this pattern continues or a stronger bullish move emerges.
❤️ Disclaimer : This analysis is purely based on my personal opinion and I only trade if the stated triggers are activated .

ETH-bias long once breaks the resistance Bullish indications:
HHHL
Trend line support respected.
MA 21 being respected.
Fib level 0.6618 respected
Bullish engulfer candle from support in 4 hr
IHS formation in 30 min.
Bullish divergence in 15 min.
Days support respected
Bearish indications:
Bearish divergence in daily
MA 21 being respected in 2 hr
Trade plan bias long @4489 buy stop
SL:4434
TP1:4542
TP2:4595

ETH Potential 4X profitsI will make it simple
The triangle has been broken and close above.
Loading . . . few months later

Ethereum: AI Models Signal Imminent Bear MarketOn August 24, 2025, Ethereum reached a new all-time high of $4,958, just below the $5,000 mark. The price is now about 10% lower but remains within striking distance. While investors are still hoping for further records, leading AI models warn that the next bear market could begin sooner than expected.
Historical Patterns
According to ChatGPT 5.0, Ethereum has historically shown sharper and faster corrections compared to Bitcoin:
During the 2017–2018 cycle, after reaching an all-time high of around $1,430 in January 2018, the price collapsed to $85 by December the same year. This represented a decline of roughly –94%, lasting about 11 months.
The next cycle in 2021–2022 followed a similar pattern, though less dramatic. ETH peaked at $4,870 in November 2021, but by June 2022 it had dropped to $880. The correction amounted to about –82% and took roughly 7 months.
ETH losses were both deeper and faster than BTC during past downturns.
ChatGPT 5.0 Forecast
• Bull Market ATH (2025): conservative $8,000, optimistic $12,000–$15,000
• Bear Market Low: $1,200–$3,000
• Timeline: Q2–Q3 2026
Other AI Forecasts
• Gemini 2.5 Pro (Google): ATH $10,000–$15,000, low $1,500–$3,000, bear market starting Q4 2025
• Claude 4 Sonnet: ATH up to $18,000, low $3,000–$4,500, possible bull run extension into Q1 2026
• Grok 4 (X/Elon Musk): ATH $15,000, low $2,400–$2,800
• Qwen 3 (Alibaba): ATH $11,500–$16,500, low $1,955–$3,630
• Kimi K2 (Moonshot AI): ATH up to $20,000, low $3,000–$5,000
• Llama 4 Maverick (Meta): ATH $12,000, low $1,800
• DeepSeek V3.1: ATH $18,000, low $2,500–$3,000
Conclusion
All AI models expect the Ethereum bear market to start by late 2025, with only a few forecasting an extension into Q1 2026. Most projections anticipate new record highs before a steep correction. The consensus for ETH’s bear market bottom ranges between $2,000 and $3,000.

Cybersecurity Risks in Global Trading Systems1. The Technological Backbone of Global Trading Systems
Modern trading systems are built upon a complex ecosystem of hardware, software, and networks. Key components include:
Trading Platforms: Electronic systems enabling order placement, execution, and settlement.
Market Data Feeds: Real-time price and volume data from exchanges, which are essential for algorithmic and high-frequency trading.
Cloud Infrastructure: Many trading firms now use cloud-based services for scalability, storage, and computational power.
APIs and Interconnections: Systems connect via APIs to brokers, exchanges, and other financial institutions, creating interdependencies.
Decentralized Finance (DeFi) Protocols: Emerging blockchain-based trading platforms that operate without traditional intermediaries.
While these technologies increase efficiency, speed, and accessibility, they also create vulnerabilities that cybercriminals can exploit.
2. Key Cybersecurity Risks in Trading Systems
Cyber threats to global trading systems can be categorized into several types, each with distinct characteristics and potential impacts.
2.1 Data Breaches and Theft
Sensitive financial data—trading algorithms, client information, and transaction histories—are prime targets for cybercriminals. Breaches can occur via:
Phishing attacks: Fraudulent emails or messages trick employees or traders into revealing credentials.
Credential stuffing: Automated attacks using stolen login credentials to access accounts.
Insider threats: Employees or contractors intentionally or unintentionally leak sensitive data.
Impact: Data breaches can lead to financial loss, reputational damage, and regulatory penalties. For instance, a breach exposing high-frequency trading algorithms can allow competitors or criminals to exploit market positions.
2.2 Distributed Denial-of-Service (DDoS) Attacks
DDoS attacks flood trading platforms or exchanges with overwhelming traffic, causing outages or slowdowns.
Motivation: Hackers may aim to manipulate market conditions by disrupting trading during volatile periods.
Historical example: In 2012, the NASDAQ faced DDoS attacks that briefly disrupted trading, highlighting vulnerabilities in market infrastructure.
Impact: DDoS attacks can halt trading, erode investor confidence, and create opportunities for price manipulation.
2.3 Market Manipulation through Cyberattacks
Cyberattacks can be used to distort market prices artificially.
Spoofing attacks: Fake orders are placed to create false demand or supply.
Algorithmic exploitation: Hackers exploit vulnerabilities in automated trading systems to trigger erroneous trades.
Impact: Such attacks can lead to significant financial losses and undermine trust in market integrity. Regulators have become increasingly vigilant about algorithmic manipulation.
2.4 Malware and Ransomware
Malware targeting trading systems can cause disruptions, exfiltrate sensitive data, or lock critical systems.
Ransomware: Attackers encrypt trading data and demand payment for access restoration.
Advanced persistent threats (APTs): Long-term, stealthy attacks targeting high-value trading operations, often state-sponsored.
Impact: Malware and ransomware can cripple trading firms, delay settlements, and trigger cascading financial consequences in interconnected markets.
2.5 Cloud and Third-Party Risks
The adoption of cloud infrastructure and third-party services has introduced new vulnerabilities:
Misconfigured cloud servers can expose sensitive trading data.
Third-party vendors may have weaker security standards, providing an entry point for attacks.
Supply chain attacks: Hackers compromise trusted software providers to infiltrate multiple trading firms simultaneously.
Impact: Cloud and third-party vulnerabilities can compromise multiple market participants, amplifying the systemic risk.
2.6 Blockchain and DeFi Vulnerabilities
Decentralized trading platforms and cryptocurrency exchanges are susceptible to unique cyber risks:
Smart contract exploits: Flaws in code can allow hackers to drain funds from DeFi protocols.
51% attacks: In smaller blockchain networks, attackers controlling a majority of network power can manipulate transactions.
Wallet phishing: Users’ private keys or wallets can be stolen through phishing or malware.
Impact: These vulnerabilities can lead to massive financial losses and shake confidence in emerging digital financial markets.
3. Systemic Risks in Global Trading
The interconnectivity of global trading systems means cyberattacks on a single node can ripple across markets.
3.1 Cross-Border Implications
Trading firms operate in multiple jurisdictions. A cyberattack in one country can affect:
Market liquidity in another country.
Foreign exchange settlements.
Multinational clearinghouses.
3.2 Contagion Risk
Failures in one platform can trigger panic selling, algorithmic misfires, or delayed settlements, magnifying market volatility.
3.3 Operational Disruption
Even temporary outages in critical trading infrastructure can disrupt order flows, create gaps in market transparency, and affect investor trust.
4. Regulatory Landscape and Compliance
Regulatory authorities globally recognize the critical importance of cybersecurity in financial markets:
U.S. Securities and Exchange Commission (SEC): Enforces cybersecurity standards for broker-dealers and exchanges.
European Securities and Markets Authority (ESMA): Requires risk assessments and incident reporting for trading firms.
Financial Stability Board (FSB): Provides guidelines on operational resilience for global financial infrastructure.
India’s SEBI: Mandates cybersecurity audits and reporting for trading platforms and brokers.
Challenges: Regulatory frameworks struggle to keep pace with rapidly evolving technology. Moreover, global coordination is challenging, as cyberattacks do not respect borders.
5. Case Studies of Cybersecurity Incidents in Trading
5.1 The 2010 Flash Crash
Although primarily caused by algorithmic trading, the Flash Crash highlighted the vulnerability of automated trading systems to manipulation, accidental errors, or system failures.
5.2 Nasdaq and DDoS Attacks (2012–2013)
Repeated DDoS attacks caused temporary outages, raising awareness of the importance of infrastructure resilience.
5.3 Mt. Gox Bitcoin Exchange Hack (2014)
The Mt. Gox hack resulted in the loss of 850,000 bitcoins, illustrating risks in cryptocurrency trading platforms and the consequences of inadequate cybersecurity.
5.4 Colonial Pipeline Ransomware Attack (2021)
Though not a trading platform, the Colonial Pipeline incident showed how ransomware can disrupt supply chains and trading-related commodities, affecting market pricing globally.
6. Emerging Threats and Future Risks
6.1 AI-Powered Cyberattacks
Artificial intelligence can be weaponized to:
Craft highly convincing phishing attacks.
Automatically exploit vulnerabilities in trading algorithms.
Conduct market manipulation at unprecedented speeds.
6.2 Quantum Computing Threats
Quantum computing could potentially break current encryption standards, threatening the confidentiality and integrity of trading systems.
6.3 Deepfake and Social Engineering Attacks
Advanced deepfakes could impersonate executives or regulatory authorities to authorize fraudulent transactions.
6.4 Increased Targeting of SMEs in Trading
Smaller trading firms and emerging market platforms often have weaker security, making them attractive targets that can be gateways to larger markets.
7. Mitigation Strategies
Addressing cybersecurity risks requires a multi-layered approach:
7.1 Technical Measures
Encryption: Securing sensitive data at rest and in transit.
Multi-factor authentication: Reducing the risk of credential theft.
Regular penetration testing: Identifying and fixing vulnerabilities.
AI-driven threat detection: Monitoring for unusual trading patterns and potential attacks.
7.2 Operational Measures
Incident response planning: Ensuring rapid recovery from attacks.
Employee training: Reducing phishing and insider threats.
Vendor risk management: Auditing third-party security practices.
7.3 Regulatory and Collaborative Measures
Global standards harmonization: Coordinating cybersecurity frameworks across markets.
Information sharing: Exchanges and regulators sharing threat intelligence to prevent attacks.
Stress testing and simulation: Evaluating system resilience under cyberattack scenarios.
8. The Human Factor in Cybersecurity
Even the most advanced technology is vulnerable without proper human oversight. Common human errors include:
Using weak passwords or reusing credentials.
Falling for phishing attacks.
Misconfiguring cloud services.
Failing to follow incident response protocols.
Training, awareness, and a culture of cybersecurity are essential components of risk management in global trading systems.
9. Conclusion
Cybersecurity risks in global trading systems represent one of the most pressing challenges in modern finance. The combination of complex technology, interconnectivity, and rapid innovation creates a landscape where threats are constantly evolving. Breaches, attacks, or system failures can have cascading effects, impacting not only individual firms but entire markets and economies.
Mitigating these risks requires a holistic approach:
Investing in robust technical infrastructure and advanced threat detection.
Developing strong operational protocols, including employee training and incident response plans.
Coordinating globally through regulators, exchanges, and industry consortia to share intelligence and best practices.
Emphasizing ongoing research into emerging threats such as AI-powered attacks, quantum computing risks, and blockchain vulnerabilities.
In the high-speed, high-stakes world of global trading, cybersecurity is not just a technical issue—it is a fundamental pillar of market stability, investor trust, and economic resilience. Firms that proactively manage cybersecurity risks are better positioned to thrive in an increasingly interconnected, technology-driven

ETH/USDT SHORTBSL taken now its time for SSL to be taken, targeting POC of volume profile, could turn into a swing short if market continues drop this coming week.

Weekly Insights EUR USD AUD NZD BTC ETH (22nd-25th septemer2025)Get ready for the week ahead — in this video we break down the technical outlook and key levels for major currencies and markets including EUR/USD, AUD, NZD, as well as S&P 500 and Bitcoin (BTC). We analyze recent price action, highlight important support & resistance zones, and discuss possible scenarios you’ll want to watch from September 22–26, 2025. Whether you trade forex, crypto, or equities, these insights will help you stay informed and better positioned for whatever the markets throw next.
If you want, I can give you a more detailed summary (key levels, possible trades, etc.) of the video.

Correction Complete: New Range approachingBoth BTC and ETH and lots of other coins are done.
There will be some outliers.
A new range with breakouts and breakdowns above and below 4k would make a lot of people lose money.
I expect sideways in this range for some time.
Levels of interest are 3606, 3839, 3865