ETHUSDT-LONG IDEAETHUSDT is in the accumulation range. broken its trendline but again came back to test it support level well its my personal opinion this support should push price a little bit higher. if this accumulation range break we can expect the advancing phase for the longer run but right now this is the short term trade.
Trade ideas

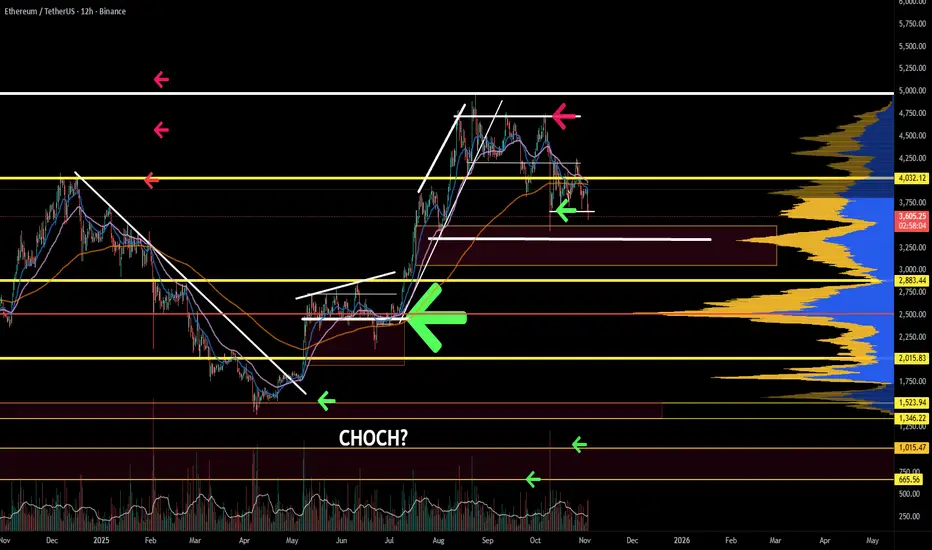
ETHUSDT: Price Aims For $4,200 ?- Here Is Why...Hi Teams,
Lets take a view on ETHUSDT. it have been scaling on a momentum range of support and resistance for this couple of days. presently the price is at the support zone, retracing slowly as seen in the chart formation.
Key points;
More clear confirmation above the support level would set off a bullish rise toward $4,200 as next partial target.
However a breakout below the support level would be triggering the price to downward movement.
Thanks for reading.

ETH-USDTEthereum has created a positive divergence on the RSI✔️
It has made good returns whenever it reaches the 30-25 range on the RSI. 3300-3400 is an important range for Ethereum in the medium term that should not be broken.

ETH/USDT | ETH Under Pressure – Watching Major Demand at $2,500!By analyzing the Ethereum chart on the weekly timeframe, we can see that Ethereum, similar to Bitcoin, has started a correction — dropping as low as $3,050 earlier today and now trading around $3,300.
Key demand zones to watch are at $2,900, $2,700, and especially $2,500, which is a major support area. If price dips into this zone, I expect a strong bullish reaction from buyers. This analysis will be updated once confirmation appears on the chart.
Please support me with your likes and comments to motivate me to share more analysis with you and share your opinion about the possible trend of this chart with me !
Best Regards , Arman Shaban

ETH - LETS GOOOO BEARISH ..;;;... CRYPTOCAP:ETH - No Nudes, But This Chart’s Got Me Looking Twice 🍑
This is why you voted for me – now a winner of the #Binance #TheBlockchain100 event. 🔥
See you in Dubai this December! ✈️

ETH Weakening Near Support, Big Move Loading?CRYPTOCAP:ETH is currently trading near a key support zone, which has held strong multiple times in the past. The price has been consolidating between this support and the mid S/R zone, showing that both bulls and bears are battling for control.
If ETH manages to break and sustain above the mid S/R zone, we could see a potential upside continuation toward higher levels. However, if the price fails to hold this key support and closes below it, a deeper correction toward the lower support zone could be on the table.
For now, ETH looks weaker day by day, so it’s important to keep a close eye on how the price reacts around this zone, a decisive move could set the tone for the next big trend.
DYOR, NFA

ETHUSDT.P - November 6, 2025ETHUSDT has broken below its ascending trendline, signaling potential bearish momentum. The setup suggests a short bias with a profit target near $3,275 and a stop level around $3,485, aligning with a risk-reward structure favoring downside continuation.

ETH: Fade the FearTrade Setup
Position: Long (2–3x leverage max)
Entry Zone: 3,741–3,591
Stop Loss: 3,325
Targets:
TP1: 5,190
TP2: 5,561
TP3: 5,836
This setup enters on the completion of Wave 4 and the beginning of a final impulsive Wave 5, with ETH reclaiming prior ATH resistance near 4,868 into a final euphoric Q4.
Macro Context
1. Rate Cuts and End of QT:
The Fed continues to signal a move toward easier policy. As rate cuts proceed and quantitative tightening winds down, risk assets tend to rally. Crypto often lags equities by a few weeks, meaning ETH could soon benefit from these liquidity shifts.
3. Liquidity Flow from Gold:
Crypto will steal liquidity from gold sellers as liquidity rotates.
3. Volatility Positioning:
DVOL data shows implied volatility hovering around 43–44, indicating that institutional players are not aggressively hedging downside. Such volatility compression often precedes a major directional move, typically upward during liquidity expansions
Technical Confluences
1. Wave Structure:
ETH appears to be finalizing Wave 4, setting up for a higher-low structure that leads into Wave 5. The MACD on the 3D timeframe is reversing, supporting bullish continuation.
2. Golden Pocket Retrace:
The current pullback perfectly aligns with the 0.618 Fibonacci retracement zone between 3,741 and 3,591.
4. Bull Market Support Band:
The 20W SMA and 21W EMA continue to hold as dynamic support.
5. Funding Rate Sentiment:
Funding rates across major exchanges remain neutral to slightly negative. This shows that short positions are piling in near support, which is typical during the final stages of a corrective phase before a squeeze higher.
DO NOT BE COMPLACENT.

ETH heavy pump ahead after major daily breakoutEthereum (ETH) is approaching a critical technical juncture as it tests a key descending trendline. A decisive breakout above this trendline, confirmed by a sustained close and supported by high trading volume, would signal a potential reversal of the recent bearish momentum.
Such a confirmed breakout is often followed by a significant bullish impulse. The initial phase of this move would likely be characterized by strong, high-volume bullish candles, indicating robust buyer conviction.
Based on classical technical analysis principles, and specifically using measured move projections from the prior consolidation range, the initial upside target following a successful breakout is projected toward the $5,500 level. This represents a significant resistance zone and a logical first objective for a new bullish phase.
DISCLAIMER: ((trade based on your own decision))
<<press like👍 if you enjoy💚

ETH Analysis (4H)After the heavy dump on altcoins, the market is still quite volatile. However, after several days and weeks of ranging, it’s gradually returning to normal and becoming more predictable for analysis.
Ethereum has formed a reversal pattern at the bottom and has made three higher lows. It’s expected to move toward the red zone while holding the green area, and then get rejected toward lower levels.
The best area for a long buy is the green box, and the best area for a short sell is the red box.
Let’s wait and see what happens next.
For risk management, please don't forget stop loss and capital management
When we reach the first target, save some profit and then change the stop to entry
Comment if you have any questions
Thank You

ETHUSDT.P - November 6, 2025ETHUSDT.P is attempting a short-term bullish reversal following a rebound from the $3,274.06–$3,244.47 support zone. A buy limit is positioned near $3,339.11, targeting a move toward the $3,493.78 partial profit zone and the $3,548.75 profit level.
A sustained break above $3,493.78 would confirm bullish continuation, while a drop below $3,274.06 invalidates the setup.
Risk Assessment: Moderate — price structure favors buyers, but confirmation above resistance is required before momentum can strengthen.

AB=CD (5 WAVES)Hello traders — hope you’re all gathering some pips!
Quick ETH update on the 1D chart: we’ve just completed a clean AB=CD (1:1) after a five-wave drop into the PCZ, and price rejected the zone with a bounce from D ≈ 3,057. Bias turns bullish while we hold above the PCZ.
Symbol: ETHUSDT (1D)
Key Levels
A–B–C–D: A ≈ 4,756 → B ≈ 3,392 → C ≈ 4,254 → D ≈ 3,057
PCZ: 3,182 – 2,889 (D printed inside, strong reaction)
TP1: 3,735 – 3,919
TP2: 4,154 – 4,452
TP3: 5,016 – 5,314
Invalidation: daily close < 2,889
Plan
Long on a retest/hold of 3,18x–3,05x or on continuation above last bounce high.
Scale out 30% / 40% / 30% at TP1/TP2/TP3; trail under rising swing lows.
Risk
Risk ≤1%. Initial SL just below 2,889 (beyond PCZ). Move to BE after ~1R.
Notes
Structure respects Equal Length (AB=CD) and fib confluence; staying above the PCZ keeps the path open toward TP1 → TP2 → TP3.

Ethereum returns to a descending channelETH has returned to a descending channel, as per the pattern we wrote about earlier. All shorts have already been taken out. A breakout of the channel's upper boundary and an upward movement are highly likely
A Fed meeting is also expected today, where an interest rate cut is expected
The only positive news will be if Jerome Powell hints at further cuts
Current price: $3,982
According to the pattern, the price could reach $4,050 , $4,100 , and possibly higher...
Accumulation zones are at $3,780 and $3,620 . If the price fails to hold in this range, it is highly likely to move lower
More detailed analysis, additional charts, and key levels to watch are available on our website

ETHUSDT | Short Setup | VWAP Mean-Reversion | Nov 5, 2025ETHUSDT | Short Setup | Distribution → VWAP Mean-Reversion | Nov 5, 2025
🔹 Thesis Summary
ETH is bouncing inside a corrective leg after clear distribution. A retest of ~3,756 into prior value and VWAP resistance offers asymmetric short exposure toward 3.3k → 3.0k, with deeper paths to 2.5k–2.0k if risk-off accelerates.
🔹 Trade Setup
Bias: Short
Entry Zone: 3,720–3,780 (primary), optional add on overshoot into 3,860–3,900
Stop Loss (hard invalidation): 4,150 (daily close back above prior distribution high)
Take-Profits:
TP1: 3,300 (first VWAP/mid-range reaction)
TP2: 3,000 (range low / liquidity shelf)
TP3: 2,500 (capitulation pocket)
Max Target: 2,000 (cycle mean-reversion)
Indicative R:R (from 3,750 vs 4,150): TP1 ≈ 1.1R, TP2 ≈ 1.9R, TP3 ≈ 3.1R, Max ≈ 4.4R
🔹 Narrative & Context
Structure: Left-side distribution is clear; subsequent liquidation aligned with the classic cycle (distribution → correction → accumulation). Current rally is corrective into a prior value area/high-volume node around 3,750–3,900, where supply previously dominated.
VWAP & Means: Price is orbiting multi-week VWAP bands; first touch/retest of the upper band into that A-setup line near 3,765 is where sellers have edge with defined risk.
Sector & Rotations: SPX remains semiconductor-heavy; the Aug 25–Sep 20 window showed distribution/exit flows, consistent with a broad risk-off tone spilling into crypto. Alt breadth is weakening first (early panic tells).
Leverage & Flow (pro watch-items): Into the short zone, watch for positive perp funding + rising OI (late longs), ETH/BTC underperformance, and basis cooling—all consistent with a re-short after a squeeze.
🔹 Valuation & Context (Pro Metrics, Framed Simply)
Perp Funding Rate: Positive/expanding into resistance → indicates long-side crowding → increases squeeze-then-fade probability at 3.75–3.90k → supports short timing.
Open Interest vs. Price: OI rising on up-ticks → leverage adding into supply → raises liquidation risk on pullback → improves short R:R.
ETH/BTC Ratio: Weak/flat vs BTC → capital prefers base-layer beta over ETH beta → less support on bounces → aligns with lower targets on rejection.
🔹 Contrarian Angle (Your Edge)
Consensus is leaning toward “buy-the-dip into year-end flows.” Our read: acceptance back into prior value is failing, VWAP is capping, and leverage is rebuilding into supply. That combination often precedes a second-leg lower toward 3.0k with room to 2.5k if macro tightens.
🔹 Risks
Sudden risk-on impulse (index squeeze, dovish macro headline) pushing ETH through 4,150.
Catalyst risk (unexpected ETH-specific positive news/flows) that invalidates distribution.
Liquidity pockets: thin books amplify wicks; poor fills if size isn’t laddered.
🔹 Macro Considerations
DXY firming and VIX pressing higher favor risk-off follow-through; a DXY fade or vol crush would reduce downside velocity.
Gold stretched and due to cool → typically aligns with a broader cross-asset balance; a hard gold bid with rising VIX would strengthen risk-off.
Track NQ/semis: continued weakness supports the ETH short; a decisive semiconductor rebound would argue for patience or reduced size.
🔹 Bottom Line
Defined-risk short into 3,720–3,780 with invalidation 4,150. First objective 3,300, core target 3,000; extended bear paths 2,500–2,000 if macro stays risk-off. Trade the structure, hedge, and keep sizing disciplined.
🔹 Forward Path
If this post gains traction (10+ likes), I’ll publish:
A weekly-frame update on the distribution range and VWAP bands
Breakout/invalidations above 3.90k–4.15k and how that flips bias
Comments thread Q&A on execution (laddering, partials, hedge overlays)
Like & Follow for structured ideas, not signals. I post high-conviction setups here before broader narratives play out.
⚠️ Disclaimer: This is not financial advice. Do your own research. Charts may include AI-assisted enhancements.
🔹 Footnote
Forward P/E: Price divided by expected earnings over the next 12 months. Lower = cheaper relative to profits.
P/FCF (Price-to-Free-Cash-Flow): Price vs. the cash left after investments. A measure of efficiency.
FCF Yield: Free cash flow per share ÷ price per share. Higher = more cash returned for each dollar invested.
ROE (Return on Equity): Net income ÷ shareholder equity. Shows management efficiency with investor capital.
ROIC (Return on Invested Capital): Net income ÷ all invested capital (equity + debt). A purer profitability gauge.
Debt/Equity: Debt divided by equity. <1 usually means balance sheet is conservative.
R:R (Risk-to-Reward): Ratio of expected upside vs. downside. 3:1 = you risk $1 to make $3.

ETH-----Sell around 3890, target 3830 areaETH Contract Technical Analysis (November 3rd):
On the daily chart, yesterday's close was a small positive candle. While the candlestick pattern shows consecutive positive days, the momentum and continuation are weak, and the price is below the moving averages. The accompanying indicators are showing a death cross, indicating a clear downward trend. Therefore, the trading strategy remains sell. On the hourly chart, the resistance level is around 3920. The current price has rebounded to near the 4-hour moving average resistance level. Given the clear downward trend, further upward movement is unlikely. Therefore, the focus for today and the European session should be on a break below support levels.
Today's ETH Short-Term Contract Trading Strategy:
Sell at 3890, stop loss at 3930, target 3830.

ETHUSDT-LONG IDEAThere are two scenarios for ETH
1. it will range in the same range and then go upside
2. it will break the range and will go lower, accumulate in the given range between lines and the resume the advancing phase
Now we will see which one will gonna play out

ETH-Daily : Bears in Control - Bulls Waiting for Right momentConsidering the liquidity that price may still sweep, Ethereum’s daily structure remains bearish for now, with a possible drop toward 3000 and a potential rebound from the 2700–2900 area.

ETH - Ranges overviewLet's have a look at ETH and its current trading range.
Similarly to BTC, ETH is currently trading towards its quarterly (3 months) sellside liquidity.
Pretty simple plan on ETH.
IF we fail to hold the current sellside liquidity expect us to trade lower towards the 2.8K-2.5K range.
IF we reclaim the current lows expect us to trade back towards 4K.
No need to frontrun the market. Let it come to you and trade with it.
Stay safe and never risk more than 1-5% of your capital per trade. The following analysis is merely a price action based analysis and does not constitute financial advice in any form.

Ethereum Technical Analysis – November 6, 2025Ethereum Technical Analysis – November 6, 2025
Ethereum (ETH) is currently trading below the descending trendline and sitting right on the key support zone at $3,340.
As long as this trendline remains intact, the bearish scenario is still in play.
The first resistance levels are found between $3,379 and $3,391.
If Ethereum fails to break above this zone and drops below $3,340, the next support targets are around $3,291 and $3,211.
However, if strong bullish candles appear above the trendline, we may see a short-term recovery move toward higher resistance zones.

ETH-USDTIt is still stuck at the same level as yesterday that I mentioned. If the resistance level at 3400 is broken, it could start its upward leg.

Eth breakout & retest in progress Htf eth has been bullish once the retest is done.
It will break $5K.
It's a matter of time 😁

ETHEREUM getting a spanking but its not over yetETH is in a downtrend; however, the structure looks retracive, which means that a corrective move would be almost over. If it is not, this means the price will break structure and fall further down. If the objective is to hunt liquidity, expect further downside.
Ethereum Update (ETH)Ethereum (ETH/USDT) is forming a massive multi-year ascending triangle, indicating a long-term accumulation structure. The price is currently consolidating just below the major resistance zone around $4,500, which has historically been a key rejection level.
As long as ETH holds above the $2,800–$3,000 support zone, the bullish structure remains intact. A confirmed breakout above the red resistance area could trigger a strong continuation move, with potential mid- to long-term targets near $6,750, $14,000, and even $15,000 based on Fibonacci extensions and structural symmetry.
Ethereum continues to show relative strength and remains one of the key assets to watch in the coming market expansion. Any deeper retest toward the lower green support could serve as a strategic long-term entry zone before a possible parabolic phase.
