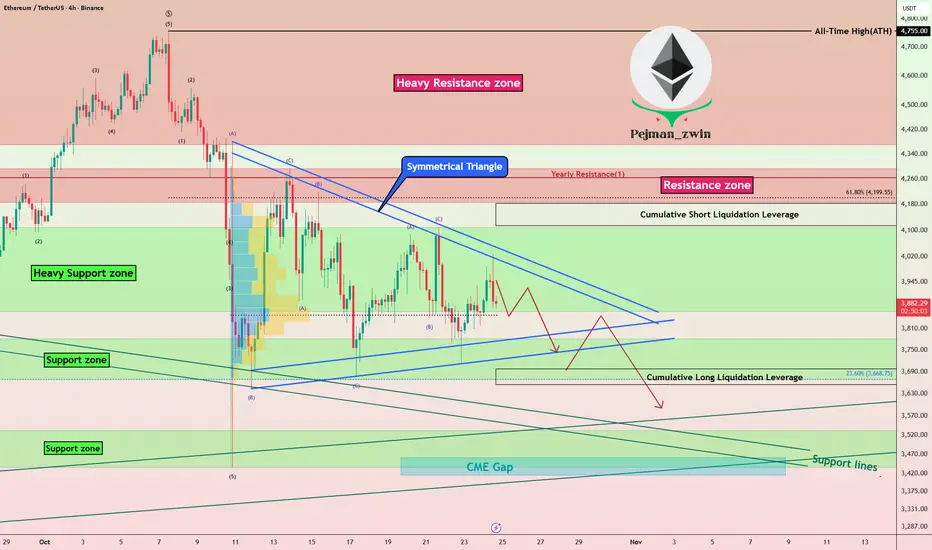
Ethereum in Symmetrical Triangle – Next Big Move Coming?Let’s take a look at Ethereum ( BINANCE:ETHUSDT ) on the 4-hour timeframe . Recently, Ethereum dropped by over -20% during the latest crypto market sell-off but has since started to recover. Right now, it appears to be in a corrective pattern, moving inside a Symmetrical Triangle Pattern .
Currently, Ethereum is testing a Heavy Support zone($4,107-$3,860) , and a break below that zone, confirmed by breaking the lower lines of the symmetrical triangle , could signal further downside.
Note: In general, a Symmetrical Triangle is a continuation pattern, and since the prior trend was downward, we might expect more downside if the broader crypto market continues to decline.
Before concluding, let’s also glance at the ETHBTC ( BINANCE:ETHBTC ) pair on the daily timeframe . It looks like ETHBTC has been in a downtrend and might revisit its support zone once more. That suggests if Bitcoin declines, Ethereum could see even more pressure .
In conclusion, I expect Ethereum to drop at least to its Support lines and Support zone($3,532-$3,436) after breaking the lower lines of the symmetrical triangle. There's also a CME Gap($3,461-$3,417) that might get filled.
Note: Keep in mind that weekend trading volumes are often lower, so the breakdown might not happen immediately. However, if tensions between the US and Venezuela escalate, we could see a sharper reaction even over the weekend.
First Target: $3,764
Second Target: $3,597
Stop Loss(SL): $4,044
Cumulative Short Liquidation Leverage: $4,182-$4,114
Cumulative Long Liquidation Leverage: $3,697-$3,3654
Please respect each other's ideas and express them politely if you agree or disagree.
Ethereum Analyze (ETHUSDT), 4-hour time frame.
Be sure to follow the updated ideas.
Do not forget to put a Stop loss for your positions (For every position you want to open).
Please follow your strategy and updates; this is just my Idea, and I will gladly see your ideas in this post.
Please do not forget the ✅' like '✅ button 🙏😊 & Share it with your friends; thanks, and Trade safe.
Trade ideas
ETH Buy/Long Setup (1H)Considering the ranging movement and lower time frame confirmations, it seems that with the specified stop, Ethereum can yield profit based on the given setup.
The entry zone, targets, and stop are marked on the chart.
For risk management, please don't forget stop loss and capital management
When we reach the first target, save some profit and then change the stop to entry
Comment if you have any questions
Thank You

ETH is now preparing for a rally toward the $4,500 zone.Ethereum will bounce within the channel, moving toward the $4,500 target.
Even in a spot position, this move could deliver around 18% gains.

#ETHUSDT: First Drop And Then Launch To $5500! ETHUSDT we believe the price will initially decline before launching from the $3000 price region. This area appears more promising and could function as a discounted price zone. Three target levels are suggested below:
* **First target:** $4000. This area presents a minor resistance level, and closing 25% of positions is ideal.
* **Second target:** $4500. This is the second major resistance level, and closing another 25% of positions is recommended.
* **Final target:** $5500. This is our swing target. If the price reaches this level, it could be a suitable area to initiate a swing sell and the commencement of a major bearish move.
Please share your thoughts.
Team Setupsfx_
Hey Bulls, are you mentally ready for this if it happens?What if, in the coming days or weeks, the price slowly bleeds down, takes out the equal lows around 3350, and reaches our VERY, VERY IMPORTANT aVWAP anchored from the start of the major trend — while everyone’s busy talking about how the price has been reclaiming the weekly level around 3900 after the latest nuke? I honestly think you should keep this scenario in the back of your mind.
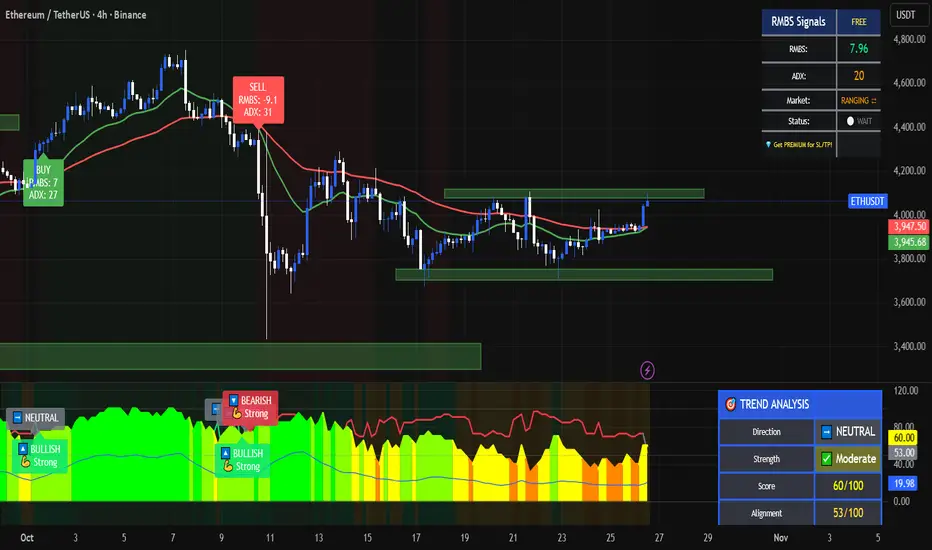
RMBS Shows Ethereum in Range Mode — Correction Still on the Tabl🔸 Ethereum is ranging between $4,100 and $3,700.
The RMBS indicator also confirms this sideways phase.
Everyone knows I’ve been expecting a deep crypto correction — though in markets, we deal with expectations , not prophecies .
#Ethereum #Crypto #Trading #BTC #ETH #TechnicalAnalysis #RMBS #CryptoMarket
ETH Eyes Upside RunEthereum shows signs of regaining strength after a prolonged corrective phase. The asset is currently stabilizing, supported by gradual inflows from institutional participants and renewed investor accumulation. Market behavior indicates controlled volatility, suggesting a preparation phase before a potential expansion.
Network data reflects consistent transaction activity, while liquidity concentration hints at sustained participation from long-term holders. The recent stabilization in funding rates and improved open interest add weight to the recovery outlook.
If momentum continues to build under these conditions, Ethereum could enter a structured growth cycle in the coming sessions.

Ethereum (ETHUSDT) – Elliott Wave & Fibonacci Technical OutlookETH has completed a clear 5-wave impulsive structure followed by an ongoing ABC corrective pattern on the daily timeframe.
Currently, price is testing the 78.6–100% Fibonacci retracement zone ($3,400–$3,700) — a key area that often marks the end of wave C and the start of a potential new impulsive wave.
Bullish Scenario:
If ETH confirms support above $3,400 with a strong bullish reversal candle and increasing volume, it may trigger a recovery toward $3,800 → $4,200 → $4,700.
Breaking above $4,200 would further validate the bullish continuation setup.
Bearish Scenario:
A daily close below $3,400 would invalidate the bullish wave count and could extend the correction toward lower structural supports.
Key Levels
Support: $3,400 – $3,700
Resistance: $3,800 / $4,200 / $4,700
Stop-loss (for long setups): Below $3,350
Overall, ETH is approaching a critical decision zone — watch for confirmation signals before positioning for the next leg.
#ETH #Ethereum #Crypto #TechnicalAnalysis #ElliottWave #Fibonacci #TradingView #CryptoTrading #BTC #ETHUSDT

Ethereum Game Plan - TDLRKZ MODELEthereum Game Plan - TDLRKZ MODEL
📊 Market Sentiment
On 29/10, the FED lowered rates by 25BPS, as expected. However, Powell’s comments introduced uncertainty regarding another cut in December, stating that further policy moves depend on incoming data.
Interestingly, one FED member dissented, preferring no cut this cycle — a shift from September when all members supported easing.
Following the statement, rate-cut expectations dropped from 95% to 68%, prompting traders to take profits and hedge, creating a short-term bearish sentiment across markets.
Despite this, the mid-to-long term outlook remains bullish, given the broader liquidity cycle and easing policy bias.
📈 Technical Analysis
Ethereum is currently accumulating inside a well-defined range.
Price failed to sustain above the $4950 range high and has started retracing toward the HTF bullish trendline, a potential reaction zone aligning with prior liquidity pools and confluences.
If price holds around this zone, ETH could seek the range high again once momentum returns.
📘 Model in Use – Trendline Deviation with HTF LR into Key Zone (TDLRKZ Model)
This model identifies setups where price deviates from HTF trendlines while interacting with liquidity zones and key structural levels.
The goal is to align HTF context with LTF confirmation for high-probability trend continuation setups.
Model Steps:
1️⃣ Identify the HTF trend direction and only trade in that direction.
2️⃣ Mark the HTF bullish trendline supporting price.
3️⃣ Spot HTF Key Zones likely to act as reaction areas.
4️⃣ Locate nearby liquidity pools or order concentrations.
5️⃣ Wait for confluence: when all align, confirm with a 4H market structure break for entry.
📌 Game Plan
Looking for ETH to retrace into $3350 and reject from that level.
If a 4H break of structure occurs and daily candle closes above $3350, this will trigger a long-biased setup.
🎯 Setup Trigger
→ 4H structure break after tagging $3350
→ Daily close above $3350
📋 Trade Management
→ Entry: After confirmation above $3350
→ Stop Loss: Below swing low that caused 4H break of structure
→ Targets:
TP1: $4150 (EQ)
TP2: $4550
TP3: $4950 (Range high)
→ Move SL to breakeven after TP1 is reached.
💬 Check my Substack for deeper macro and sentimental breakdowns — free subscriptions are open.
⚠️ Disclaimer: This content is for educational purposes only and does not constitute financial advice. Always DYOR before trading.

Ethereum (ETH/USDT) — Bears in Control | Next Target $3,200Ethereum remains under strong selling pressure.
After losing its ascending channel and failing to reclaim $4,000, momentum has clearly shifted in favor of the bears.
The market is now forming lower highs and showing no signs of strength recovery.
📉 Market Outlook
Price action remains heavy below $4,000–$4,200 resistance.
Current supports: $3,800, $3,400, and $3,200 — all potential short-term reaction zones, not reversal points.
Breaking below $3,800 would likely trigger continuation toward $3,200–$2,800.
Volume structure confirms distribution — no demand yet visible from buyers.
🚫 No Long Positions Recommended
The market is still in a corrective phase; long setups carry high risk.
Until ETH reclaims strong structure, short-term rallies are expected to be sold into.
⚖️ Summary
Bearish momentum dominates while below $4,000.
Patience and discipline are key — avoid counter-trend trades in this environment.
❗ Not financial advice — just my personal market view.
Ethereum Market AnalysisEthereum Market Analysis
Introduction
Hello dear traders! In this analysis, I have updated the status of the popular Ethereum chart
In the previous analysis, for Ethereum on a long-term basis, we identified the CHoCH (Change of Character) trend change with precision and specified the best buy zone. { Ideal time to buy with Confirmation }. According to our forecast, after the price enters the buy zone, the market moved up to the main target, which was the old high. Now this is a daily analysis and it shows us the small upward steps. My analysis is very simple and straightforward, and there is no need for further explanation. If the CHoCH trend changes in the daily analysis, I will present a new analysis to you. Wishing you success and enjoy.
Wishing you all success!
Fereydoon Bahrami
A retail trader in the Wall Street Trading Center (Forex)
Risk Disclosure:
Trading in the cryptocurrency market is risky due to high price volatility. This analysis is solely my personal opinion and should not be considered financial advice. Please do your own research. You are responsible for any profits or losses resulting from this analysis.

ETH soon will get the ticket of moonThe market structure for Ethereum has turned decidedly bullish following its decisive breakout above the key $4,400 level, which coincided with a major descending trendline resistance. A confirmed and sustained move above this level typically validates the strength of the breakout. This technical development suggests a high probability of a significant upward impulse, with initial projected targets residing in the $5,000 to $7,000 range.
DISCLAIMER: ((trade based on your own decision))
<<press like👍 if you enjoy💚

Ethereum $ETH still has weekly demand in control. Will it rally?Ethereum CRYPTOCAP:ETH still has weekly demand in control. Will it rally higher? Waiting for some more bullish price action or a pullback to the weekly demand lower at $2,600.

ETH-----Sell around 4035, target 3960 areaETH Contract Technical Analysis (October 29th):
On the daily chart, yesterday's close was a small bearish candle, indicating a consecutive decline. The price is still within a range, and the accompanying indicators show a golden cross with decreasing volume. The overall trend remains bullish, but the price is currently in a range-bound movement. However, attention should be paid to data releases and news-driven stimuli. On the hourly chart, the price faced downward pressure during the US session, but rebounded from early support this morning. The current candlestick pattern shows a consecutive bullish reversal, while the accompanying indicators show a bearish cross with decreasing volume. However, the four-hour chart shows significant price suppression, with resistance around the 4035 area.
Today's ETH Short-Term Contract Trading Strategy:
Sell at the 4035 area, stop loss at the 4070 area, target 3960 area;

ETH-USDTHit a major resistance intersection at $3900
which is the intersection of the trend line and the static level 🚨
This resistance must be broken upwards for Ethereum and altcoins to rise

The key is whether it can rise above 4403.87
Hello, traders.
Follow us to get the latest information quickly.
Have a great day.
-------------------------------------
(ETHUSDT 1W chart)
The formation of an upward trend line (A) created an upward channel from (A) to (B).
Therefore, the key is whether it can continue to rise along this upward trend line.
If the upward movement fails, we need to check whether the price rises along the rising trend lines (1) and (2).
Therefore, the 3900.73-4107.80 range is a crucial area for sustaining the upward trend.
In this context, we expect a significant period of volatility to begin around the week of November 24th.
This period of volatility could continue until around the week of January 12th, 2026.
-
(1M Chart)
If this month closes with a bearish candle, forming an upward trend line (a), the key question is whether the price can rise along trend line (a).
If not, there's a possibility of touching the upward trend line (2), so we need to consider a response plan.
-
(1D Chart)
The key is whether the price can sustain above the uptrend line (1) and rise above 4403.87.
To do this, we need to see if it can break above the downward channel created on the 1D chart.
Therefore, we need to observe how the price moves after the volatility period around November 5th.
The HA-High ~ DOM(60) section (4393.04-4780.15) on the 1W chart overlaps with the HA-High ~ DOM(60) section (4403.87-4749.30) on the 1D chart, so it's likely to act as resistance.
------------------------------------
The basic trading strategy is to buy in the DOM(-60) ~ HA-Low section and sell in the HA-High ~ DOM(60) section.
However, if the price rises from the HA-High to DOM(60) range, a step-like uptrend is likely, while if it falls from the DOM(-60) to HA-Low range, a step-like downtrend is likely.
Therefore, a split trading strategy is recommended.
To maintain a step-like uptrend in the DOM(-60) to HA-Low range,
1. The StochRSI indicator must be rising. If possible, it should not enter the overbought zone.
2. The On-By-Value (OBV) indicator must be rising. If possible, it should remain above the High Line.
3. The TC (Trend Check) indicator must be rising. If possible, it should remain above the 0 level.
If the above conditions are met, the uptrend is likely to continue.
If not, a high point is likely to form, so you should consider a countermeasure.
-
Thank you for reading to the end.
I wish you successful trading.
--------------------------------------------------

ETH/USDTETH bounced from monthly value area low so it has potentially go upwards to 4000$ mark. Once we reach there then next line of action will be evaluated.
I am bullish on ETH

Will Ethereum’s Market Flow Signal a New Bullish Phase?🎯 ETH/USD: The "Thief Strategy" Blueprint | Layer Your Way to Victory! 💰
📊 Market Overview
Asset: ETH/USD (Ethereum vs US Dollar)
Market: Crypto
Trade Type: Swing Trade
Bias: Bullish (Post-Breakout Setup)
🎭 The Thief's Master Plan
Ladies and gentlemen, gather 'round! 🎩 We're not just trading here—we're executing the legendary "Thief Strategy" where we sneak into multiple price levels like a professional heist crew. No single entry point for us, oh no. We layer up, diversify risk, and wait for the vault to open! 💎
🚀 Entry Strategy: The Layering Technique
Primary Entry Zone: Any price level AFTER a confirmed breakout above $4,200 ✅
The Thief's Layering Method (Multiple Limit Orders):
🥇 Layer 1: $3,900
🥈 Layer 2: $4,000
🥉 Layer 3: $4,100
🏆 Layer 4: $4,200
Pro Tip: Feel free to add more layers based on your capital allocation and risk appetite. The more layers, the smoother your average entry price! Think of it as building a ladder to success.
🛑 Stop Loss: Protect Your Treasure
Thief's Stop Loss: $3,700 🚨
⚠️ Important Disclaimer:
Dear Ladies & Gentlemen (Thief OG's), I'm NOT recommending you blindly follow my stop loss. This is MY risk tolerance. You need to assess YOUR own risk management strategy. Set your stop loss according to your capital size, risk appetite, and sleep-at-night comfort level. Remember: Your money, your rules! 💼
🎯 Take Profit Target: Know When to Exit the Heist
Primary Target: $4,600 🎰
Why This Level?
📈 Moving Average acting as a strong resistance zone (think of it as the police barricade!)
🔴 Overbought conditions on technical indicators
⚠️ Bull trap zone — smart money might be waiting to distribute here
Exit Strategy:
When you see the moving average resistance + overbought signals flashing, it's time to take your profits and vanish into the night! 🌙
⚠️ Important Disclaimer:
Dear Ladies & Gentlemen (Thief OG's), I'm NOT recommending you blindly follow my take profit level. This is MY analysis. Scale out profits at levels that make sense for YOUR trading plan. Partial profits, trailing stops, whatever works for YOU. Make money, then TAKE money—at your own discretion! 💵
🔗 Related Pairs to Watch
Keep an eye on these correlated assets to confirm the broader market direction:
BITSTAMP: BITSTAMP:BTCUSD — The king of crypto. When Bitcoin moves, ETH usually follows. Watch for BTC breakouts above resistance.
BINANCE: BINANCE:ETHBTC — Shows ETH's relative strength against Bitcoin. Rising = ETH outperformance.
TVC: TVC:DXY (US Dollar Index) — Inverse correlation. Weaker dollar = stronger crypto typically.
Total Crypto Market Cap — Confirms if capital is flowing INTO or OUT OF the crypto space.
COINBASE: COINBASE:SOLUSD , COINBASE: COINBASE:ADAUSD — Other major altcoins. If they're pumping too, it confirms alt season momentum.
Key Correlation Point: If Bitcoin is breaking resistance zones and the Dollar Index (DXY) is weakening, our ETH setup gets significantly stronger! 📊✨
🧠 Technical Analysis Breakdown
What We're Watching:
✅ Breakout Confirmation: Price must close above $4,200 with volume
✅ Support Levels: $3,900-$4,100 range acts as accumulation zone
✅ Resistance Zone: $4,600 where moving averages + overbought conditions converge
✅ Risk-Reward Ratio: Solid setup with layered entries minimizing average cost basis
The Thief Strategy Philosophy:
Instead of gambling on ONE entry point, we spread our risk across multiple price levels. This way, we're dollar-cost-averaging into the position BEFORE the breakout confirmation, positioning ourselves ahead of the crowd! 🎯
🎬 Final Words from the Thief
Remember, OG's: The best trades are the ones where you're positioned BEFORE the crowd rushes in. Layer your entries, manage your risk like a professional, and know when to take your profits and disappear! 👻
Stay disciplined, stay profitable, and let's make this heist a success! 🏆
✨ If you find value in my analysis, a 👍 and 🚀 boost is much appreciated — it helps me share more setups with the community!
#ETHUSD #Ethereum #CryptoTrading #SwingTrade #ThiefStrategy #LayeringStrategy #CryptoAnalysis #TechnicalAnalysis #TradingView #CryptoSetup #AltcoinSeason #ETHBreakout #RiskManagement #TradingStrategy #CryptoIdeas

Long biasAll indications Say that ETH/USDT is going up , at least to 5000 USDT ,
we have VOLUME and a PULLBACK to a récent key level plus the general BULLISH TREND .

ETHUSDTBINANCE:ETHUSDT have a amazing trend because this is second the best crypto an head of all project so is in watchlist of best traders.
Support for buy: 3750$
Resistance for targets: 4045 - 4200 - 4435 - 4755
Please your risk management.

ETHUSDT 4-Hour Chart Analysis !!ETHUSDT 4-Hour Chart Analysis
Trend: ETH has found support at the intersection of a long-term downtrend line and a horizontal demand zone ($3,850–$3,900 area). This area has held steady several times and is acting as a base for the price.
Structure: The price has recently pulled back after rallying to $4,220, but continues to make higher lows on this timeframe, indicating that the bullish structure remains intact as long as $3,900 remains stable.
Key Levels:
Support: $3,850–$3,900 (trend line and horizontal zone)
Resistance: $4,220 (recent swing high), $4,830 (key target—see green arrow projection)
Perspective: If ETH remains stable above $3,900 and bounces back from this support, the next targets will be $4,220 and then $4,830. A breakdown below $3,850 would weaken this bullish outlook.
ETH remains bullish above support, and an upward move towards $3,900 is highly likely. Watch for a break above and sustain above the $4,220 level for further momentum.
DYOR | NFA

Ethereum at a Crossroads: Accumulation vs. Profit-Taking DynamicHello everyone,
ETH is currently in an intriguing trading phase as technical factors and market capital flows are creating a clear conflict. Recent on-chain data shows that large wallets (whales) holding between 10,000 and 100,000 ETH are accumulating again – a sign that “smart money” is positioning ahead of a medium-term uptrend. However, in contrast, traditional institutional investors are reducing exposure or taking short-term profits, leaving the market without consensus and susceptible to strong liquidity sweeps in both directions.
On the macro front, the primary support for ETH comes from expectations that the US Federal Reserve (Fed) may cut interest rates by around 25 basis points at the next meeting. This would ease liquidity and drive capital back into risk assets like crypto. Simultaneously, ETH is no longer viewed merely as an altcoin – it is increasingly being positioned as a store of value and a core platform for tokenized assets, drawing serious attention from long-term investment funds.
On the 4H chart, ETH is trading around $4,214 after a strong rebound from the $3,900–$4,000 support zone. While the recovery is solid, price is approaching the technical resistance range of $4,220–$4,400, where unfilled liquidity gaps (FVGs) exist. This implies that profit-taking pressure is real, and rejection risks at this level are high without sufficiently strong news catalysts.
Personally, I lean towards the scenario where ETH may reach ~$4,270–$4,300 to test the upper resistance/liquidity zone, before potentially retracing to ~$4,000–$4,050 to retest buying strength. If support holds amid positive news (rate cuts, capital inflows), I believe ETH could pave the way for a more robust rally towards ~$4,500 or higher.
Which scenario do you favour – ETH preparing to “gather momentum” or merely a technical rebound before stronger selling pressure?

Growth ahead of the Trump-Xi Jinping meeting in South Korea.CRYPTOCAP:ETH / #Ethereum 🔹 Donald Trump and Xi Jinping (October 19, 2025)
A positive outlook is shaping up for Ethereum, and it sure looks like a classic W reversal is in the works.
There's a ton of negativity swirling right now, with a lot of folks expecting prices to dip even lower (I was bracing for that final flush-out myself, but it looks like they scooped up the dip and are busy forming this reversal setup).
During that Ethereum drop on October 10-11, BitMine Immersion Technologies beefed up its reserves with 104,336 ETH worth $417 million.
As of this writing, the company's sitting on 3.03 million ETH valued at $12.18 billion, making it the biggest corporate whale holding Ethereum.
Whales and public companies are aggressively snapping up Ethereum and stacking their bags.
All that's left is to speculate where Ethereum's gonna top out and where they'll start dumping all this volume 8k? 10k?
I've pulled together some screenshots that back up the bullish signal:
1️⃣ Liquidations on the Hyperliquid exchange: As you can see on the chart above, once we break $5,000, a massive wave of short traders are gonna get wrecked that could spark another leg up in price momentum.
2️⃣ Coinbase order book: Check it out—above $5,000, there are limit orders lined up for profit-taking, so Ethereum might follow a similar path straight up to $8,000.
3️⃣ Current big orders on Binance and Coinbase exchanges.
4️⃣ OKX ETH/USDC liquidation heatmap.
Wrapping it up: On the daily chart, we're seeing a reversal pattern forming as a W (I call it the "pirate reversal" myself), and keep in mind that after the chaos on October 10-11, more than 1.6 million traders got absolutely rekt.
I doubt everyone's gonna pile back in buying or flipping to long positions anytime soon that plays right into the hands of the big market puppeteers and market makers.
They'll pump the price higher, whip up the hype, and offload their Ethereum stacks at the top.
Snapshot:
