ETH Short IdeaETH can be shorted from this range with posted entry and SL
Goodluck
Pleasant @ Cryptowhale Madiha Kareem
Trade ideas

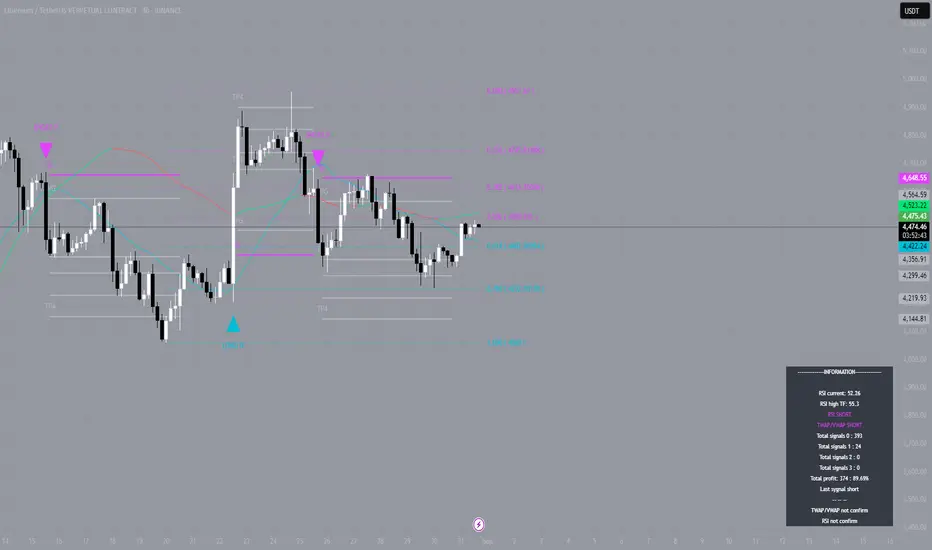
Weekly trading plan for EthereumA new month and a new week have started, so I’ve updated the monthly levels.
This week, the key level is 4,482 . The moving averages near this level are currently acting as resistance, so only after breaking it can we expect further growth toward the ATH. If the price fails to break above the weekly pivot point, the target will be 4,148 .
I explained everything in more detail in the video idea.

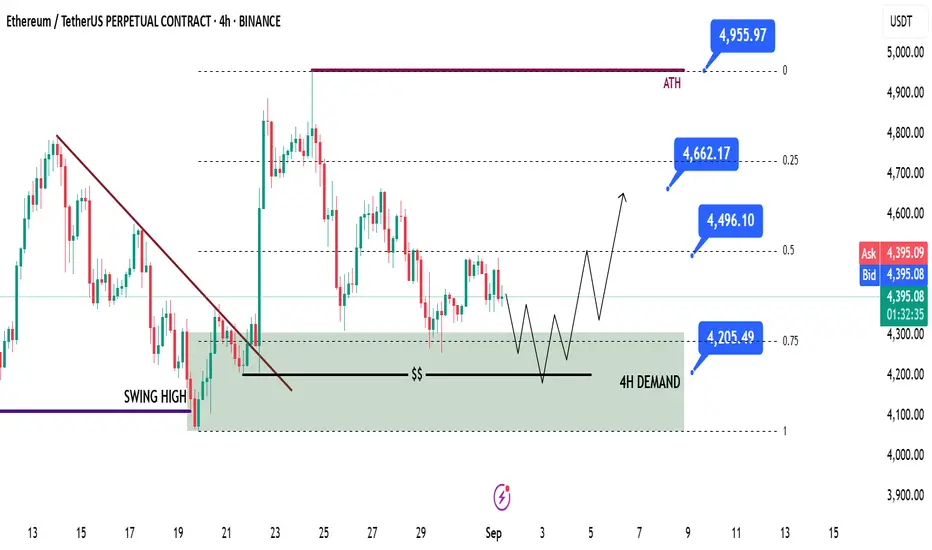
ETH Swing Long IdeaETH Swing Long Idea
📊 Market Sentiment
Overall sentiment remains bullish, supported by expectations of a 0.25% rate cut in the upcoming FOMC meeting. A weakening USD and improving global risk appetite are creating favorable conditions for further upside in crypto assets.
📈 Technical Analysis
Price tapped into the prior swing high and rejected from that level.
This move created a 4H Demand Zone, which I expect to hold.
Additionally, price reacted from the 0.75 range maximum discount zone and is currently bouncing.
📌 Game Plan
I will be looking for price to run liquidity at $4205 before a potential expansion higher.
This level also aligns with the maximum range discount zone.
🎯 Setup Trigger
I will wait for a 4H Break of Structure (BOS) before entering a trade, with LTF confirmation for precision.
📋 Trade Management
Stoploss: 4H swing low confirming the BOS
Targets:
• TP1: $4500
• TP2: $4650
• TP3: $5000 (All-Time Highs)
💬 Like, follow, and comment if you find this setup valuable!
⚠️ Disclaimer: This content is for informational and educational purposes only and does not constitute financial, investment, or trading advice. Always do your own research before making any financial decisions.
Ehtereum next all time high could be highBINANCE:ETHUSDT Ethereum price updated its all-time high to $4950, followed by a swift correction to $4,270, and now technical indicators suggest an upcoming bullish rally to $6,500.
Details here:
www.cointrust.com

ETH Warrning !!!BINANCE:ETHUSDT The Ethereum is forming an expanding triangle + stochastic divergance.
Best wishes to you all
Markets Titan

Sep1, ETHUSDT Daily Analysis
Intro
For the first time in almost two months, Ethereum has broken below its ascending trendline. In addition, a flat top structure is clearly visible on the 4H chart. These signals make me less bullish on Ethereum compared to before.
That said, there’s still no confirmation of a full trend reversal yet. However, I’ll be more cautious about opening long positions on ETH for now. The key level I’m watching is 4,078.56 — a breakdown below this level could change my long-term outlook on Ethereum and provide a potential short trigger.
⏳ 1H Outlook
On the 1H timeframe, the first setup that caught my attention is a triangle pattern, which has recently broken to the upside. A pullback to the breakout area has also occurred. If price breaks above 4,483.86 after this pullback, it could present a good long opportunity.
Still, I don’t plan to hold this long for the mid/long term — I will take profits at the nearest resistance levels. I’ll keep this approach until the upcoming U.S. unemployment data and other economic news set the broader market direction this week.
📉 Short-side View
At the moment, I don’t see a clear short trigger on Ethereum, nor do I have a strong interest in taking short positions right now.
From a broader perspective, Ethereum may be forming a large range (box) between 4,065.50 and 4,816.84 . Currently, the price sits roughly in the middle of this range, while potential short triggers are much closer to the bottom boundary of the box.


Ethereum (ETH): Still Looks Bullish | Waiting For Q4ETH has already confirmed a Break of Structure (BOS), and as long as we are holding above that zone, the bias stays bullish. Right now, we’re aiming for the next upside targets at $6,000 and $7,000, with momentum still in favor of buyers.
The key thing here is simple: stay above BOS → we push higher. If buyers lose that zone, we’ll reassess, but for now, the upside scenario dominates.
Swallow Academy

DeGRAM | ETHUSD is consolidating📊 Technical Analysis
● ETH/USD is consolidating near $4,450 inside a rising channel, with support anchored at $4,187; holding this zone keeps bullish structure intact.
● The price is coiling below resistance at $5,131, and sustained momentum could trigger an upside breakout targeting $5,500 in the medium term.
💡 Fundamental Analysis
● Recent ETH ETF inflows surpassed $1.2B in August, while Ethereum’s staking ratio hit record highs above 27%, reducing liquid supply and reinforcing long-term bullish pressure.
✨ Summary
Bullish above $4,187; targets $5,131 → $5,500. Invalidation below $4,100.
-------------------
Share your opinion in the comments and support the idea with like. Thanks for your support!

Ethereum (ETH): Targeting $7,000 | $9,000ETH is sitting right below ATH, where pressure is building up heavy from both buyers and sellers. We’ve got RSI holding stable and EMAs aligned, so the structure is clear — only thing left now is that proper breakout.
Once buyers secure this zone, momentum should push us straight into higher levels, with $7K as the first stop and $9K as the major target. Until then, it’s just waiting for that breakout confirmation — after that, the ride continues.
Swallow Academy

ETH/USDTSimilar to BTC, September isn’t historically the strongest month. For further upside, we’d like to see liquidity taken in the 4000–3355 zone.
Long setups only after clear confirmation.

01-09-2025 ETHUSDTThe market is not always chaotic and disorderly, and there is a precise geometric beauty hidden in price fluctuations. The harmonic form long strategy is a powerful tool for accurately identifying potential market reversal points based on the Fibonacci ratio. When the form forms perfectly at the key support level, it often indicates the depletion of bearish momentum and the initiation of bullish trends.
As shown in the figure: 15M Bullish Bat

31-08-2025 ETHUSDTThe market is not always chaotic and disorderly, and there is a precise geometric beauty hidden in price fluctuations. The harmonic form long strategy is a powerful tool for accurately identifying potential market reversal points based on the Fibonacci ratio. When the form forms perfectly at the key support level, it often indicates the depletion of bearish momentum and the initiation of bullish trends.
As shown in the figure: 15M Bearish Crab

Short Term Trade Sell Ethereum at $ 4450 Target Price $ 4350 Very short term trade provided to short Ethereum at $ 4450/- and book profit at around $ 4350/-

Volatility Period: Around August 28 (August 27-29)
Hello, fellow traders!
Follow us to get the latest information quickly.
Have a great day!
-------------------------------------
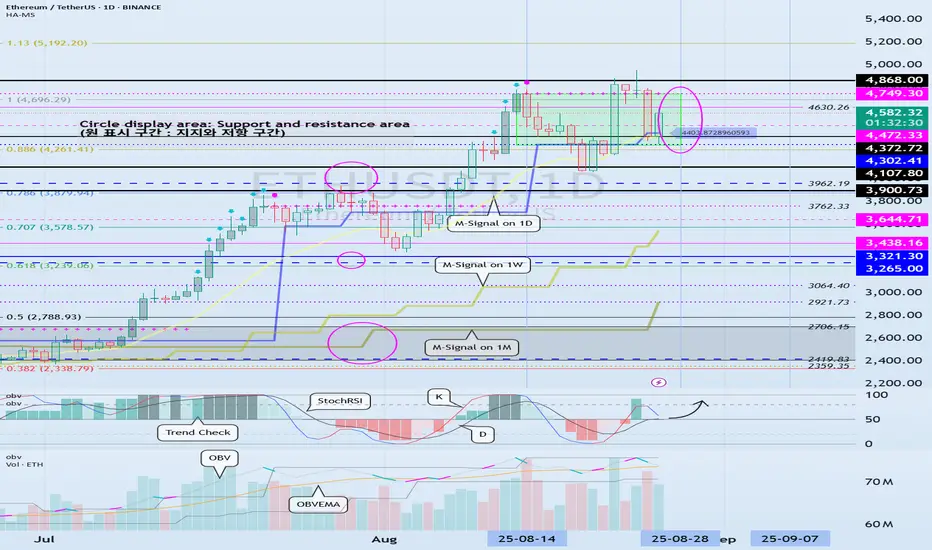
(ETHUSDT 1D chart)
It's rising, with support near 4372.72.
However, since the TC (Trend Check) indicator is at 0, it's unclear where the price will bounce.
Therefore, we need to determine whether support is found around 4630.26 or whether the price falls below 4472.33.
This period of volatility is expected to last from August 27th to 29th.
-
To initiate a cascading upward trend, support must be found around 4749.30.
-
Thank you for reading to the end.
I wish you successful trading.
--------------------------------------------------
- This is an explanation of the big picture.
(3-year bull market, 1-year bear market pattern)
I will explain in more detail when the bear market begins.
------------------------------------------------------
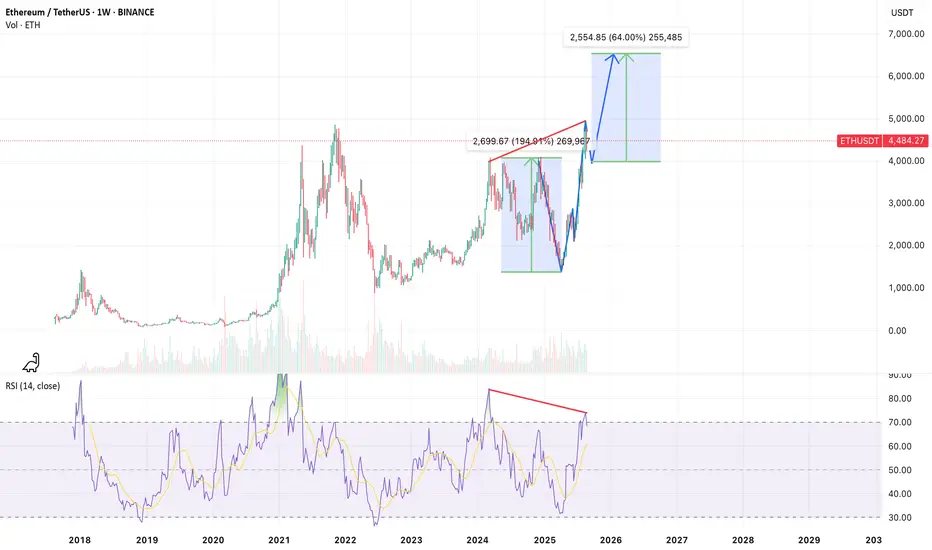
[ETHUSDT] Possible V-Sharp FormationOn the weekly timeframe, ETHUSDT is showing signs of a potential V-sharp reversal pattern. A mild bearish divergence can be observed at the recent highs, indicating the likelihood of a corrective move toward the $4,000 support zone before resuming the broader bullish trend targeting the $6,500 area.
For educational purposes only. This is not financial advice.
ETHUSDBullish idea for ETH either we will continue going up from here or we might drop towards 4080 and then move towards ATH

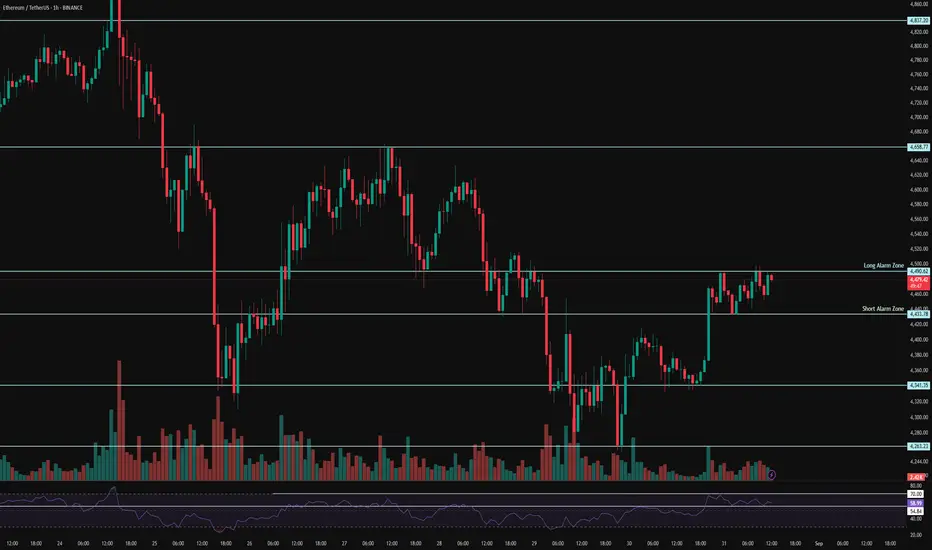
ETH 1H Analysis – Key Triggers Ahead | Day 8💀 Hey , how's it going ? Come over here — Satoshi got something for you !
⏰ We’re analyzing ETH on the 4-hour timeframe timeframe .
🔭 On the 1-hour timeframe of Ethereum, we can see that after a correction, Ethereum was supported at the $4263 area and moved upward. It had a resistance at the $4341 level which, after breaking and completing a pullback, pushed towards its next higher resistance. Currently, it is in a 1-hour or 15-minute multi-timeframe range, and with a breakout from this pattern, it can give us a trade opportunity.
⛏ Key RSI levels are at 70 and 55. If the fluctuation limit crosses these numbers, Ethereum can have significant volatility and start a new trend.
💰 The volume and number of green candles have increased, and their size also looks bigger. This can be a sign of Ethereum’s bias, showing that buyers are more willing to spend money compared to sellers. The volume and number of red candles have decreased, and they don’t create much selling pressure, although the market is currently in a holiday period.
🪙🪙 On the 1-hour ETHBTC timeframe, after breaking out of its box, Ethereum moved upward and also had a pullback to this box. Now there is resistance at the 0.04145 area, and with a breakout of this level, Ethereum can continue moving upward.
🔔 The alert zones considered for Ethereum are $4433, which is at the bottom of this range as the short alert zone, and $4490, which is at the top of this range as the long alert zone. With a breakout and confirmation above these levels, Ethereum can start its move in the new week. Note that this pattern has strong price action significance, and Ethereum’s monthly candle will also close tonight.
❤️ Disclaimer : This analysis is purely based on my personal opinion and I only trade if the stated triggers are activated .
How a Systematic Approach Helps Maintain Control
The crypto market has once again reminded us that price movement is never linear. Ethereum first moved down from the $4,614 level, hit TP1 at $4,369, then reversed upwards and took out stops at $4,660. It might seem like chaotic swings where holding a position is impossible. But it's precisely in such moments that the importance of a systematic approach to the market becomes obvious.
Most traders perceive these situations painfully. The price goes down — fear intensifies. Then a sharp reversal — greed emerges, along with a desire to "wait it out." As a result, the strategy breaks down: the trader closes too early or too late, and losses seem inevitable.
In reality, the market is not chaotic. It moves in stages: impulse, correction, consolidation. ETH demonstrated exactly that: a sharp drop, a test of the TP1 zone, a bounce, a stop run, and a return to the downward phase. To most participants, this looked like "randomness," but a careful look through an algorithmic model allows one to see the structure in advance.
The algorithm accompanied the trade step by step:
- It fixed profit zones as the price moved down;
- It reflected the moment of a potential upward reversal and limited risk with a stop-loss;
- It showed the resumption of the downward scenario and has kept the position open until now.
The key here is that decisions were made not on emotions, but based on structure and probabilities. The price can move in any direction, but when you have a management system, the trader controls the process, not the other way around.
No trader can predict the market with 100% accuracy. But you can predict your own behavior: set rules, exit zones, and acceptable risk in advance. Automating this process eliminates unnecessary doubt, helps maintain discipline, and allows you to work not on "intuition," but by algorithm.
ETH clearly demonstrated how the market shakes out weak hands and tests every participant's resilience. Those who acted spontaneously most likely lost. Those who worked systematically preserved their gains and continue to ride the trend.
This is where the true value of tools is revealed: not to guess the market, but to structure it, turning chaos into a sequence of steps. This saves time, eliminates emotional mistakes, and allows you to look at the price coldly, without panic.
ETH Market InsightETH shows strong volume with signs of institutional accumulation, preventing deep declines. Recent pullbacks were low in volume, not confirming a downtrend. Corrections stay within accumulation ranges, supply looks exhausted - a new ATH could be on the horizon.


ETHUSDT: Price Action and TPHello friends. as you seen the chart of ETHUSDT so after pullback on the base we see the positive sign to reach the chart the first p on the 4800 and second tp 5500
