ETHUSDT - UniverseMetta - Analysis#ETHUSDT - UniverseMetta - Analysis
Potential trend continuation – focus on Wave 5
📆 W1 – Weekly Timeframe
🔹 Price has broken above and confirmed support at a key level
🔹 A retest of the breakout level may precede the launch of a new Wave 5 in the uptrend
🔹 Alternatively, a deeper ABC correction could develop before continuation
📉 D1 – Daily Timeframe
🔹 A symmetrical triangle has formed and price has broken above the trendline
🔹 This may mark the beginning of a new impulse within an ABC structure
🎯 Short-term upside targets for a breakout:
• $4,782
• $4,964
⏳ H4 – 4H Timeframe
🔹 A potential Wave 3 to the upside is forming
🔹 Entry confirmation comes after price breaks above the 1st wave high and holds above the trendline
🔹 Stop-loss placed below the low of Wave 1
🎯 Trade Setup:
#ETHUSDT #BUY
Entry: 4,452.98
Take Profits (TP):
• 4,782.58
• 5,098.05
• 5,428.12
• 6,183.11
Stop Loss: 4,200.47
‼️ Total risk should not exceed 1–3% of your portfolio
This signal/idea is not investment advice
Always conduct your own analysis before entering the market
Trade ideas

ETH Losing Momentum — Correction AheadETH has been one of the most overheated assets for a long time, but now it’s finally cooling off. Attention has shifted back to BTC and SOL. But what’s next for ETH? Let’s break it down.
The price has broken below its ascending channel pattern, something I’ve warned about many times. This is the first sign of a trend shift — at minimum, into a range.
Confirmation of a full trend reversal into a bearish phase will be a break of market structure (MS) at $4,060.
And that looks likely soon, because:
➡️ Money Flow shows divergence — liquidity continues to flow out of ETH, already reaching levels last seen when ETH traded at $2,200 and below.
➡️ Buying Volume keeps declining, also diverging. Not at the new ATH, not anywhere, did we see growth in buying activity. That means the crowd simply has no interest in ETH.
➡️ Three gaps have formed below: $4,180–3,638, $3,565–2,975, and $2,467–1,856. And as we know — as SOL just reminded us — gaps close 99% of the time sooner or later. ETH has already started partially closing one of them.
Even today, while the whole market is rising, ETH can’t move. And when price can’t go up, it obviously goes down.
📌 So the next target is $4,000 — a critical psychological level plus the MS level.
A breakdown there will officially flip ETH into a bear market.

#ETH Sideways Consolidation📊#ETH Sideways Consolidation📊
🧠From a structural perspective, we're currently within the target of a bullish structure on the daily chart, so be wary of a correction on the daily chart! The price is currently in a sideways consolidation phase on the 4-hour chart, with resistance near 4500 and support near 4200.
➡️There are signs of a third test of the 4500 resistance level, but be cautious of false breakout scenarios, as the risk of chasing the rally is too high. Furthermore, ETH spot ETFs have recently seen net outflows, so I'm more inclined to believe a rebound scenario after testing lower support levels, such as a rapid drop below 4000 followed by a strong rebound.
➡️It's worth noting that the altcoin wave has already arrived, so we should keep an eye on the altcoin market opportunities.
Let's take a look👀
🤜If you like my analysis, please like💖 and share💬 BITGET:ETHUSDT.P

EnthusdEth still bullish , tens of billions of inflows in August . is very positive for eth . Institutions very confident purchasing as strategic asset . I think ethereum tops 8k at least before the bull run is over but you never know

ETH 1H Analysis - Key Triggers Ahead | Day 16💀 Hey , how's it going ? Come over here — Satoshi got something for you!
⏰ We’re analyzing ETH on the 1-Hour timeframe.
🔭 On the 1H timeframe for Ethereum, we can see that ETH has broken through its resistance zone at $4332. A pullback and consolidation above this level could give us strong trading opportunities. From a multi-timeframe pattern perspective, ETH is still trading inside a larger box, with significant distance remaining to the box’s upper boundary. If ETH confirms this breakout, the next resistance level sits around $4480, and a break above that could push ETH outside of its current range.
⛏ The key RSI zones are 70 and 37. If momentum crosses above 70 into Overbought territory, ETH could continue its current bullish trend.
💰 The size and volume of recent green candles on ETH have been increasing, supported by strong buying. The compressed range structure built during the weekend has now been broken with higher buying volume and the clearing of sell orders. As long as open interest remains strong, ETH has room to move higher.
🪙 Looking at the ETH/BTC pair on the 1H timeframe, it faked out below the marked support level and is now pushing upward. The key resistance here is at 0.03883, and a confirmed breakout above this level could fuel further upside for ETH against USDT.
💡 Currently, Ethereum is sitting in a crucial zone. Multi-timeframe confirmation above this level could give us a clean long setup. The immediate resistance zone is $4332, while further resistance levels can be mapped out with a Fibonacci retracement.
❤️ Disclaimer : This analysis is purely based on my personal opinion and I only trade if the stated triggers are activated .

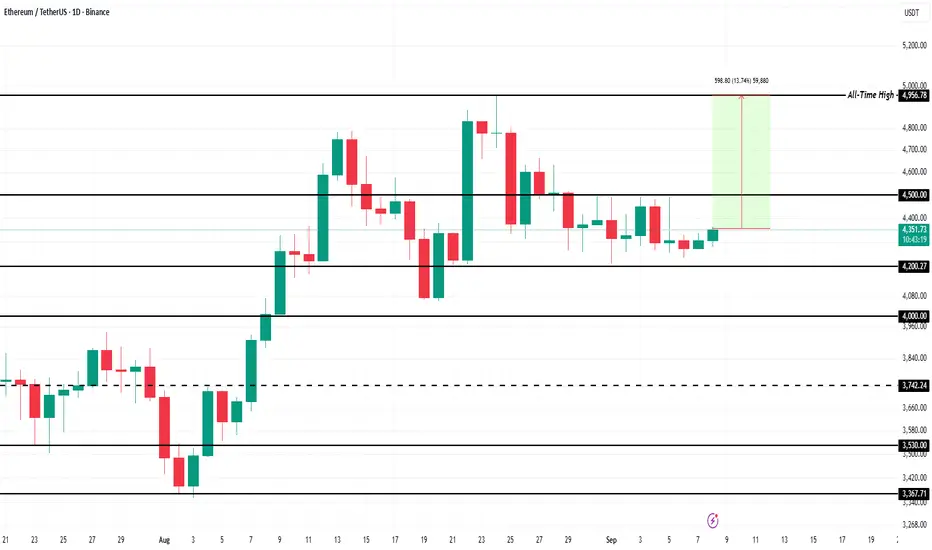
Ethereum Could Hit All-Time High in The First Week Of SeptemberEthereum’s price is currently at $4,315, showing limited movement after days of stagnation. The altcoin king continues to hover around the $4,331 support level, attempting to secure it as a foundation for a potential upward breakout in the near term.
The Chaikin Money Flow (CMF) indicates rising inflows, a positive signal for Ethereum’s momentum. If the indicator crosses above the zero line, it will confirm stronger inflows. This could push ETH past $4,331 and toward $4,500, reducing the gap to its $4,956 all-time high.
However, risks remain if investor sentiment weakens. Should selling pressure increase, Ethereum could struggle to maintain upward momentum. In this scenario, ETH might either consolidate sideways above $4,222 or fall through it, retesting $4,007 as support and invalidating the bullish thesis for the short term.
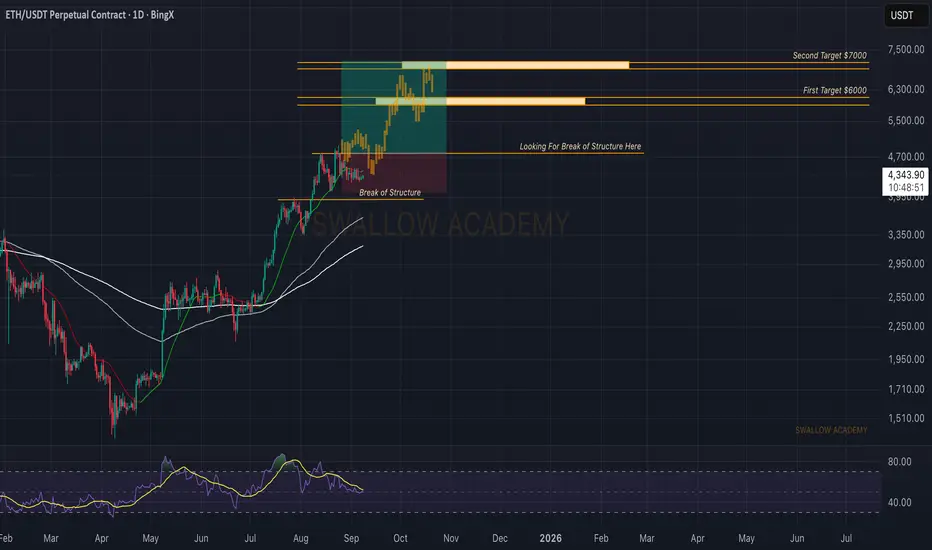
Ethereum (ETH): Looking For Break of StructureETH has already shown strength with a clean Break of Structure (BOS), and buyers are holding price well above that zone. As long as this BOS area remains intact, we keep looking at the upside.
The key confirmation now is for ETH to clear the current consolidation and secure a breakout — once that happens, we’ll be eyeing the next major targets at $6000 and $7000. Until then, the BOS area is our line in the sand that keeps this setup bullish.
Swallow Academy
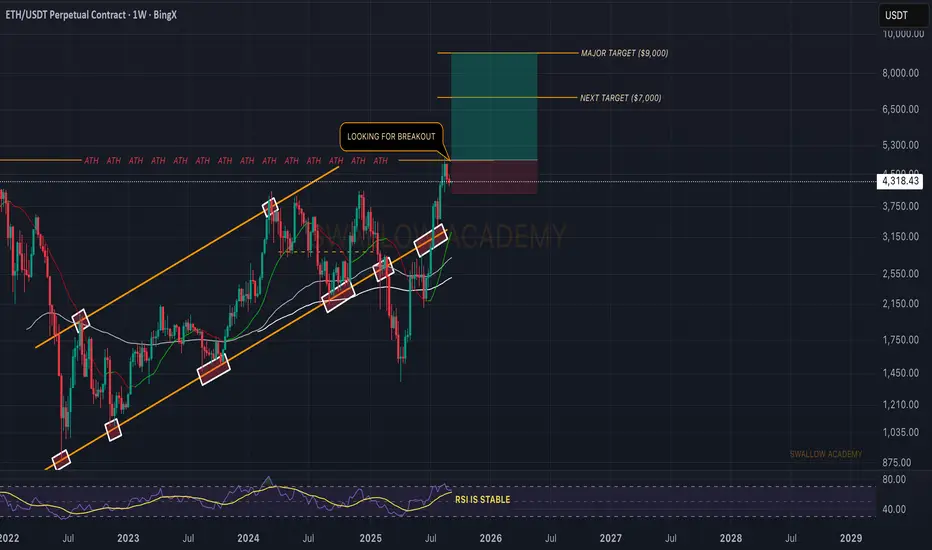
Ethereum (ETH): Getting Ready For New ALL-TIME-HIGHETH has shown strong momentum, and as long as buyers keep dominating the $4,000 zone, the structure stays bullish. This level has been holding, and now we’re entering the next phase of the bull run — liquidity is starting to rotate from BTC into ETH.
Our eyes are on the breakout above the channel highs. If that happens, we expect ETH to push toward $7,000 next, with $9,000 as the major target for this cycle.
Swallow Academy
#ETHUSDT 2H ChartPrice is still consolidating showing no major movements. MACD is not clear, RSI is neutral and EMAs are bearish. We might see a sweep of the equal lows at $4,200 before moving up again aiming to liquidate the equal highs at $4,490.

Ethereum - long at 4050 (range low)Ethereum - long at 4050 (range low)
Global trned on ETH is still UP
i think for some time price could stay in a range
that's why range low is a premium area for taking LONG trade

ETHEREUM TO BREAKOUTEthereum is holding above September's pivot at $4,230, and when the yellow resistance line is broken, it may start the rally again and $4775 can be the first target

what I will do with eth“On ETH, waiting for a range breakout and reversal at 4330 to target 4423. This implies a 2% move, with a stop at 4290 (≈1%), giving a 2:1 risk-reward ratio.”

ETH ETH price prediction for the upcoming days
If breaks out of this box, higher targets to ATH and 5400 is feasible
If it loses this level, 3800 is the next stop

ETH LONG SETUPBelow are key levels to watch
$4300 Hold on 4hr and 1hr could sustain bullish momentum
Eth went lower over the weekend to $4236 which now enables the bears to target lower prices
the 4hr EMA was held on Saturday and bullish momentum was seen at those levels, a break of the 4hr ema @4252 would send price action into bearish momentum on a longer time frame
In my opinion breaking the $4280 level will invalidate most bullish momentum and the next but of support comes in at $4250 which itself will create more bearish momentum if it gets there.
Even with all these bearish indicators, I do see price action currently swaying towards the bullish side on lower time frames,
We are looking for a retest and gold of $4300 on higher time frames.
thoughts ? lets get this bread together !!!!

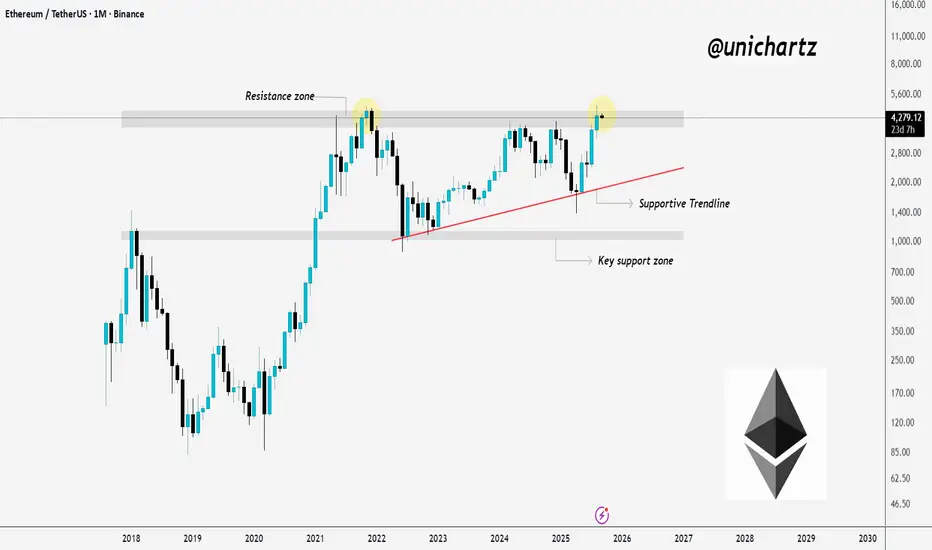
Decision Time for ETHCRYPTOCAP:ETH is struggling at the marked resistance zone.
Price has tested this area multiple times, which confirms it as a strong supply region. Right now, ETH is consolidating below resistance while holding above the supportive trendline.
If bulls can secure a clean monthly close above this resistance zone, the path opens for continuation toward higher levels. But if rejection plays out again, we could see a pullback to the supportive trendline or even toward the key support zone before another attempt.
This level is critical, it will decide whether ETH breaks into a new rally or spends more time ranging.
DYOR, NFA
More updates coming soon, Stay turned
#ETHUSDT 3H ChartPrice is currently consolidating showing no major movements after the NFP news release last Friday. MACD is slightly bullish but EMAs are bearish. Price would need to break above the $4,400 area in order to expect a bullish reversal aiming towards the 4h supply zone at around $4,800.
