Ethereum Shows Weakness at 0.618 Level — Lower High FormationEthereum’s price action is displaying significant weakness around the 0.618 Fibonacci retracement level, currently situated near $4,114. This region has repeatedly acted as a rejection zone, highlighting the lack of sustained bullish momentum in the current market structure.
If continual rejections persist at this level, the probability of a deeper corrective move increases, with the next major support target lying around $2,400. The broader structural framework remains bearish, as Ethereum continues to form lower lows on higher timeframes — a classic signal of downtrend continuation.
Key Points:
- Critical Resistance: The 0.618 Fibonacci level at $4,114 remains a key rejection zone.
- Bearish Structure: Ongoing lower lows suggest sustained weakness in market structure.
- Downside Target: Potential corrective move could extend toward $2,400 support.
From a technical perspective, this region can act as a lower high projection unless Ethereum decisively reclaims the $4,800 level. Until such a breakout occurs, the bias remains to the downside.
What to Expect:
As long as ETH fails to close above $4,114, bearish pressure will likely persist. A continued rejection here opens the door for a retracement toward $2,400, reinforcing the broader corrective outlook.
Trade ideas

Ethereum (ETHUSDT, 1D) – Key Reversal Zone: Two Scenarios Ahead#Ethereum (#ETHUSDT, 1D) – Key Reversal Zone: Two Scenarios Ahead
Current price: $4,157
Ethereum is approaching a key decision zone within a broad consolidation structure. The current pattern allows for two potential outcomes — bullish continuation or renewed correction — both aligned with mid-term Fibonacci dynamics.
🧩 Technical Overview
• Price rebounded strongly from the $3,620–$3,660 zone, breaking above short-term resistance near $4,100.
• ETH is now testing a confluence area between the descending trendline and the 0.236 Fib retracement of the previous leg.
• The reaction from this area will define whether the market resumes the uptrend or returns to deeper correction.
🟡 Bullish Scenario
• Structure suggests a potential breakout and continuation toward higher Fibonacci extensions.
• Key levels to watch:
– $4,284–$4,290 — breakout confirmation zone
– $4,450–$4,460 — intermediate resistance / local target
– $4,820–$4,850 — main upside target (1.618 Fib extension)
• Break and close above $4,290 would validate continuation toward $4,820+ in the coming sessions.
⚪ Bearish Scenario
• Failure to hold above $4,100 may trigger renewed selling pressure.
• Key levels below:
– $3,700 — first support / short-term pivot
– $3,440–$3,270 — mid-term correction zone
– $3,260 — key structural support; break below would confirm full retracement.
• A daily close below $3,700 reopens downside risk toward the lower Fibonacci levels.
⚙️ Market Context
• ETH remains sensitive to broader crypto sentiment, mirroring BTC’s consolidation near $110K.
• Market structure shows balanced positioning — both bulls and bears waiting for confirmation at the trendline.
• Directional breakout from current levels will likely define the next medium-term leg.
🧭 Summary
Ethereum is consolidating near a major inflection point.
• Bullish path: breakout above $4,290 → targets at $4,450 and $4,820.
• Bearish path: failure below $4,100 → pullback toward $3,700–$3,260.
Until confirmation occurs, ETH remains neutral-bullish, trading within a breakout-preparation phase.

ETH Sell/Short Setup (4H)After a strong bearish move, the price has made a solid recovery and is approaching a good supply zone.
At this level, it’s better to look for sell/short positions, as there are strong order blocks in this area that could push the price downward.
We’ve considered a 1:2 risk-to-reward ratio, and you can see the targets and stop-loss levels on the chart.
For risk management, please don't forget stop loss and capital management
When we reach the first target, save some profit and then change the stop to entry
Comment if you have any questions
Thank You

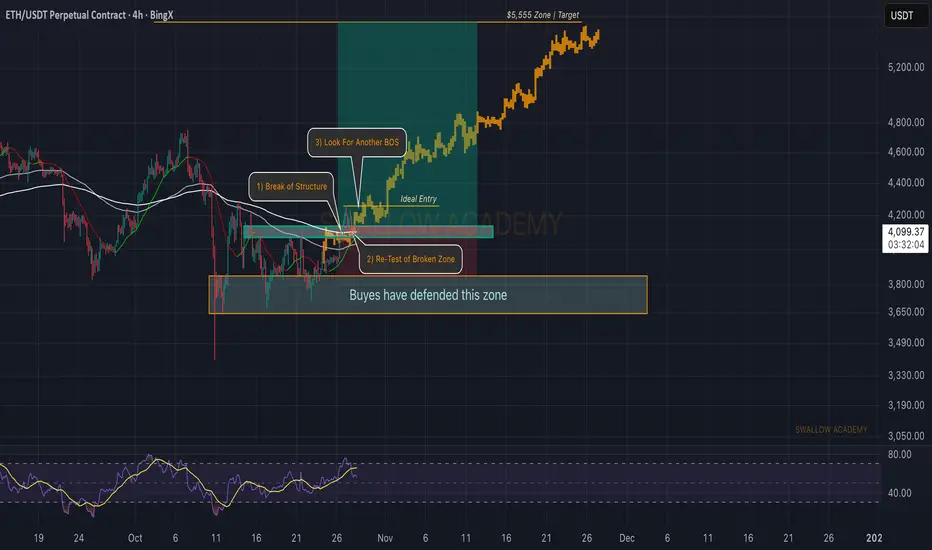
Ethereum (ETH): Last Step For Perfect Entry | Wait For Last BOSOne of the best setups that has been working for us is BOS/Re-Test/BOS, where ETH is at the last stage to potentially give us an ideal entry for a long position.
The game plan is simple: we wait for BOS to form; once we get that, we are going to target the current ATH area near $4900 and then a new ATH, which we have been aiming for, of $5555.
Swallow Academy
[SeoVereign] ETHEREUM BEARISH Outlook – October 27, 2025Hello everyone,
Currently, Ethereum has re-entered a major resistance zone,
and there is a high probability of a short-term corrective movement emerging.
First Basis — FIBONACCI 1.13~1.272
Ethereum is positioned within the 1.13–1.272 range relative to the upper structure.
This zone is generally recognized as an overheated area of an upward wave,
where selling pressure tends to emerge following the formation of a short-term high.
Second Basis — WAVE.M = WAVE.N × 1.618
The ongoing M-wave shows an extension ratio of approximately 1.618 relative to the previous N-wave.
This represents an overextended structure in wave theory,
which is typically interpreted as a sign of trend exhaustion and potential reversal.
Accordingly, the average target price is set around 3,864 USDT.
This perspective is based on data as of October 26,
and further updates will be provided to refine this outlook as the market develops.
Thank you for reading.

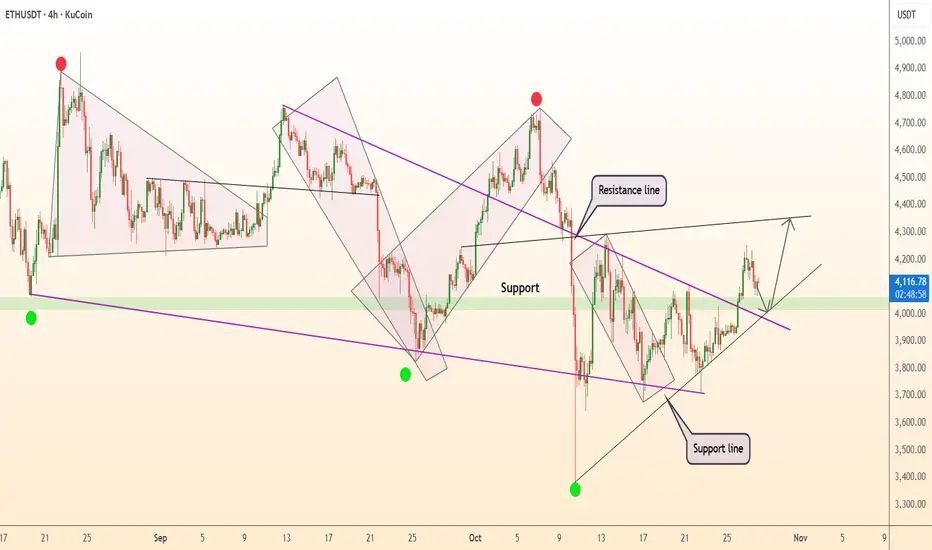
ETH/USDT 1W🔹 Overall Trend
We are still in an uptrend (trend line maintained from the March low).
However, momentum is weakening—a series of lower highs is forming, suggesting a local correction within the main trend.
🔹 Key Technical Levels
🟢 Resistance:
4,179 USDT – the current level that the price is testing as resistance.
4,407 USDT – the next strong resistance, where previous rejections occurred.
4,877 USDT – the main resistance resulting from the August highs.
🔴 Support:
3,916 USDT – almost identical to the above (demand zone).
3,561 USDT – key structural support; loss of this level = possible trend change.
🔹 Formation and Structure
The current pattern could form a potential ascending triangle, with the trendline (black) connecting the lows and the horizontal resistance lines marking the upper boundary of the consolidation.
If a breakout occurs above 4,180–4,400, a move to 4,800+ is possible.
However, if we break the trendline and 3,900, a move to 3,560–3,400 could occur, or even a test of 3,000 with significant selling pressure.
🔹 Volume
Volume is decreasing during consolidation → typical of an accumulation or distribution phase.
No clear breakout signal – the market is waiting for a trigger (e.g., macroeconomic data, ETFs, news about ETH 2.0).
🔹 Stochastic RSI (Bottom of the chart)
Located in the oversold zone (<20).
The %K line (blue) is attempting to cross the %D line (orange) from below – a signal of an early rebound.
If confirmed next week, a local rebound from the 3,900–4,000 zone could occur.
🔹 Scenarios:
✅ Bullish:
Breakout from the trendline + breakout above 4,180 → target 4,400, then 4,880.
Confirmation by increasing volume and the Stoch RSI emerging from oversold territory.
❌ Bearish:
Breakout of the trendline and 3,900 → target 3,560, then 3,200.
Increasing downward volume + no bullish reaction at the support levels.

$ETHUSDT: Update - Long term signal triggeredThe long term bull cycle signal I was waiting for triggered, after turning initially bullish in the mid term 2 months ago, we now have a valid reason to add further exposure to Ethereum and consider staking and participating in other ways of increasing your returns with DeFi.
(I leave this up to you, DYOR, this is beyond the scope of this forecast and involves other risks and complexity that you need to understand well yourself before participating in it).
As far as technicals go, we have a clear invalidation signal if price fails to follow through after this quarter ends, or if it breaks under the level where most of the accumulation took place near 1700-1800.
Upside targets are between 9400 and 54000, with the highest probability target range being between 9400 and 17500 by late 2025. The upper target range is more of a black swan scenario for Bitcoin and would involve some degree of flippening which seems unlikely.
Best of luck!
Cheers,
Ivan Labrie.

ETH Outlook – Mid & Short TermHello Traders 🐺
In this idea, I want to talk about the next target for ETH and explore its potential mid- and short-term movements, so make sure to stay with me until the very end.
Let’s start with the weekly chart, then move down to the daily for a more detailed analysis:
As you can see on the weekly, with the current close above the blue resistance line, we can still have some hopium for ETH — meaning we’re still bullish for now, and everything looks fine so far.
But what am I expecting from ETH right now?
Let me be honest with you guys — if the price can recover from the current dip and break above the orange resistance line (which is also the daily supply zone), I expect at least another leg up toward $5,900, where price will face the 0.5 Fibonacci retracement level.
But what about the immediate short term?
As you can see on the daily chart, as long as ETH can hold above the purple support trendline, we can expect higher price targets ahead.
I think this is a crucial level for ETH to watch closely — we need to stay above it to keep the bullish structure alive.
I hope you enjoyed this idea, and as always remember:
🐺 Discipline is rarely enjoyable, but almost always profitable. 🐺
🐺 KIU_COIN 🐺

ETH movement according to planOn October 26, Ethereum showed a clear upward movement on the 4-hour chart from the 4043.78 level. I entered on the next candle after confirmation and gradually closed positions at three profit-taking levels. I distributed the deposit across these zones and collected around 5 percent profit with 1.5x leverage.
The key is not greed but structure. Thanks to a secret proprietary strategy, it was possible to clearly see the levels and avoid emotional reactions. Many traders at that moment tried to chase the market, entering too late, but precise calculations and visualized levels allowed me to act calmly and without haste.
I often notice that even experienced traders make mistakes by ignoring their plan and technical references. But discipline is what separates chaotic trading from a system. Each level was predetermined, and the price moved exactly according to the calculations.

It looks like the market is about to move in a continuation trenIt seems the economy may not undergo a “bubble reset” anytime soon. If that’s the case, the value of money will continue to depreciate, making investment channels such as stocks and cryptocurrencies increasingly attractive to investors. Although the core purpose of crypto is to promote balance and decentralization, when ownership becomes concentrated in the hands of a small group or a single entity, it exposes a structural weakness in the digital asset market — particularly for BTC and ETH.

ETH bullish flag pattern ETH bullish flag pattern aligns with a third-wave structure suggesting upside if support holds healthy consolidation
ETH has formed a bullish flag pattern, and the movement is parallel to the third Elliott wave of the wave analysis. The news background is neutral
Current price: $4,137
According to the pattern, the upward movement could soon reach $4,200 , $4,250 , and highter...
If the price declines and reaches $4,070 , the movement will continue in a downward corridor, and the pattern will not form anytime soon

DeGRAM | ETHUSD is above the support area📊 Technical Analysis
● ETH/USD broke above its descending resistance line and retested the 4,000 support zone, confirming a breakout from a medium-term accumulation structure.
● The price now targets 4,300 as the next resistance, with ascending channel dynamics supporting continued bullish momentum.
💡 Fundamental Analysis
● Ethereum gains traction amid rising DeFi activity and institutional accumulation, while stable macro sentiment boosts broader crypto risk appetite.
✨ Summary
● Long bias above 4,000; targets 4,300. Breakout confirmation and improving fundamentals support medium-term upside.
-------------------
Share your opinion in the comments and support the idea with a like. Thanks for your support!
ETHEREUM ETHUSDTTHE 3HR STRUCTURE CONFIRMS THAT THERE IS NOTHING LIKE MANIPULATION IN TRADING.WHAT WE HAVE IS DEMAND AND SUPPLY.
TRADERS SAND OVERSIGHT ARE NORMAL AND WILL TAG IT AS MANIPULATION.
AM LOOKING FOR SUPPLY AROUND 4378.69 IN THE DIRECTION OF TAKE PROFIT AGAIN.
Ethereum remains the second-largest cryptocurrency by market capitalization and continues to be a foundational platform for decentralized finance (DeFi), smart contracts, and tokenized assets.
Ethereum Overview and Outlook
Ecosystem Growth: Ethereum’s ecosystem is expanding with over 127 million active wallets and total value locked (TVL) in DeFi protocols reaching about $96.86 billion, a 50% increase since mid-2025.
Technology Upgrades: Recent upgrades like Pectra and Fusaka, along with Layer 2 solutions such as Arbitrum, improve scalability, reduce fees, and enhance user experience.
Macro and Regulatory: Institutional inflows via Ethereum ETFs total nearly $24.7 billion, supported by gradual regulatory clarity.
Price Forecast: Despite short-term volatility, Ethereum shows strong fundamental on structure and rally.
Summary
Ethereum remains a dominant blockchain platform with robust adoption and technical advancements, supporting a positive price outlook .currently, with potential to rally toward $5000-6000k if they break and close weekly resistance
the ecosystem growth, institutional participation, and network upgrades will be its bullish catalyst
#ETHUSD #ETHEREUM

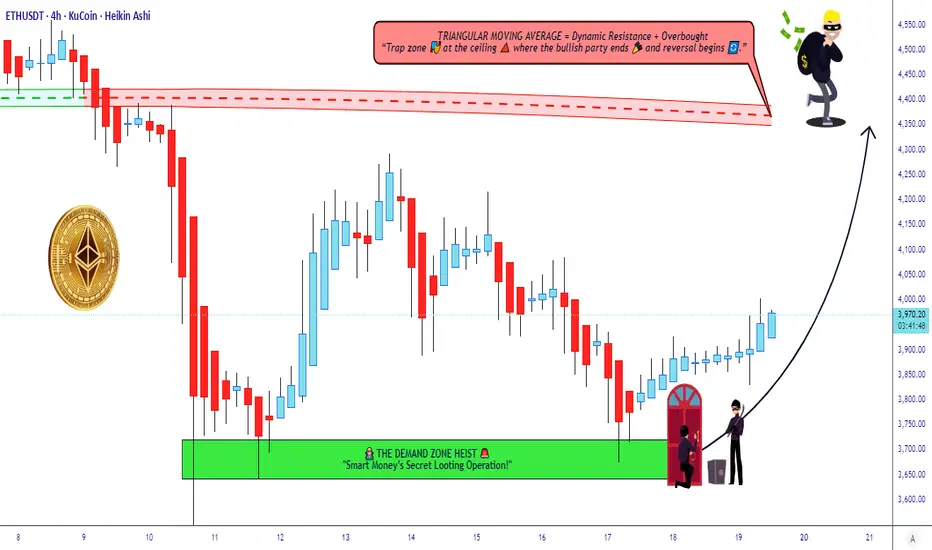
Ethereum Technical Map – Bulls Leading the Charge!🎯 ETH/USDT: The Gentleman Thief's Swing Play | 3600→4350 Target 🚀
📊 MARKET OVERVIEW
Asset: ETHEREUM/TETHER (ETH/USDT)
Timeframe: Swing/Day Trade
Bias: 🐂 BULLISH
Strategy Type: Wealth Accumulation Map
🎭 THE SETUP (A.K.A. "THE HEIST PLAN")
🟢 ENTRY ZONE
Flexible Entry: Any current price level accepted
Translation: We're not picky—grab your ticket to the moon wherever you are!
🛑 STOP LOSS (THE "THIEF'S INSURANCE")
SL: $3,600
⚠️ Important Note for OG Thieves:
Listen up, Ladies & Gentlemen! This is MY stop loss level, not a divine commandment. You've got your own vault to protect—set YOUR stop loss based on YOUR risk appetite. Your money, your rules, your responsibility. Don't blame me if you ignore risk management! 💼
🎯 TAKE PROFIT TARGET
TP: $4,350
📍 Technical Confluence:
Triangular Moving Average acting as strong resistance
Overbought conditions developing
Potential bull trap zone forming
⚠️ Another Friendly Reminder:
Dear OG Thieves, this is MY target—not financial advice carved in stone! Scale out, take profits along the way, or let it ride. YOU decide when to count your loot. Exit strategy is YOUR masterpiece! 🎨
🔍 KEY TECHNICAL LEVELS
Resistance Zones:
Primary: $4,350 (TMA + Overbought)
Watch for rejection wicks at this level
Support Foundation:
$3,600 (Our safety net)
Strategy:
Classic "buy the dip, sell the rip" with proper risk management. We're riding the wave, not fighting the tide! 🌊
👀 RELATED PAIRS TO WATCH
Correlated Assets:
BTC/USDT ( CRYPTOCAP:BTC ) - King leads, ETH follows (usually)
SOL/USDT ( CRYPTOCAP:SOL ) - Alt season companion
MATIC/USDT ( SEED_DONKEYDAN_MARKET_CAP:MATIC ) - Ethereum ecosystem play
BNB/USDT ( CRYPTOCAP:BNB ) - Exchange token correlation
AVAX/USDT ( CRYPTOCAP:AVAX ) - Smart contract platform peer
💡 Correlation Notes:
When BTC pumps, ETH typically follows with stronger percentage moves. Watch Bitcoin dominance—if it drops while BTC rises, expect explosive alt season momentum. SOL and AVAX often move in tandem with ETH as the "Layer 1 trio."
⚙️ RISK MANAGEMENT (THE GENTLEMAN'S CODE)
✅ Never risk more than 1-2% of portfolio per trade
✅ Consider partial profit-taking at resistance levels
✅ Trail your stop loss as price advances
✅ Don't marry your position—take the money and run when it's time! 💰
🎩 FINAL WORDS FROM YOUR FRIENDLY NEIGHBORHOOD CHART THIEF
This analysis combines technical indicators, market structure, and a healthy dose of swagger. Remember: The market doesn't care about your feelings, your bills, or your dreams. Protect your capital like it's the Crown Jewels! 👑
Trade smart, stay humble, and may the pips be ever in your favor! 🎲
✨ If you find value in my analysis, a 👍 and 🚀 boost is much appreciated — it helps me share more setups with the community!
#ETHUSDT #Ethereum #CryptoTrading #SwingTrading #DayTrading #TechnicalAnalysis #CryptoTA #ETHUSD #AltcoinTrading #CryptoStrategy #TradingIdeas #CryptoSignals #BullishSetup #RiskManagement #TradingView #ETH #Cryptocurrency #DigitalAssets #CryptoMarket #TradingCommunity
📈 Chart Analysis | 🎯 Swing Trading | 💎 Crypto Markets | 🚀 To The Moon
ETH$9k target for CRYPTOCAP:ETH is becoming more realistic than ever as price structure continues to strengthen. Momentum is building fast, and both targets are aligning perfectly on the chart. I believe these setups will play out in the very near future, with potential for even higher levels ahead.

ETHEREUM ETHUSDTETHEREUM TECHNICAL INFORMATION.
THE WEEKLY TIME FRAME SHOWS THAT BUYERS REJECTED THE 4998-5000 ZONE AND IT BECOMES OUR NEW BUY LIMUS TEST IN THE FUTURE.THE BREAK AND COSE OF A WEEKLY CANDLE WILL CALL FOR 15MIN SCALP IN SEARCH OF POINT OF ENTRY TO AIM 6000-7000$ IN PROFIT.
THE CURRENT REALITY WITH ETHEREUM SHOWS LACK OF BIUY MOMENTUM AND ITS EVIDENT FROM THE BREAK AND RETEST OF 4200 LEVEL ON WEEKLY TIME FRAME ON THE CHART ,THIS REACTION IS DETAILED ON THE CHART FOR REFERENCE.
THE SELL CONFIRMATION WILL COME FROM THE WEEKLY BREAK AND CLOSE 3780 AND MY SELL TARGET WILL BE 3116$ DEMAND FLOOR AND ALSO 50% FIB LEVEL
TARGET 2 WILL BE 2727.8 DEMAND FLOOR
AND PRICE COULD GO LOWER BEYOUND THIS ZONE ON BEARISH SENTIMENT AND PROLONGED TAKE PROFIT,
ETHEREUM IN CONTEXT
Ethereum remains the second-largest cryptocurrency by market capitalization and continues to be a foundational platform for decentralized finance (DeFi), smart contracts, and tokenized assets.
Ethereum 2025 Overview and Outlook
Ecosystem Growth: Ethereum’s ecosystem is expanding with over 127 million active wallets and total value locked (TVL) in DeFi protocols reaching about $96.86 billion, a 50% increase since mid-2025.
Technology Upgrades: Recent upgrades like Pectra and Fusaka, along with Layer 2 solutions such as Arbitrum, improve scalability, reduce fees, and enhance user experience.
Macro and Regulatory: Institutional inflows via Ethereum ETFs total nearly $24.7 billion, supported by gradual regulatory clarity.
Price Forecast: Despite short-term volatility, Ethereum shows strong fundamental on structure and rally.
Summary
Ethereum remains a dominant blockchain platform with robust adoption and technical advancements, supporting a positive price outlook .currently, with potential to rally toward $5000-6000k if they break and close weekly resistance at 4200
the ecosystem growth, institutional participation, and network upgrades will be its bullish catalyst
.
#ethusd #ethereum

more optimistic cycle topbased on historic data and patterns, a potential -more optimistic- cycle top at price range of 9.5-9.8k USD.

High RR...Don't need to be right often - Q the flash dump - A braindead trade regardless of bias - fib targets plotted - if 1.618 busts assume it's a larger correction.

Possible Ethereum Scenario in the Week AheadPossible Ethereum Scenario in the Week Ahead
Possible Ethereum Scenario in the Week Ahead Given the price of Bitcoin, which doesn't seem very interesting, you should monitor the movement and volatility of Bitcoin.

ETHEREUM to $3300 #ETH is so cooked
Descending triangle. This is a textbook classic pattern
If it closes bellow $3700, then it should drop to $3300

ETH/USD Technical OutlookETH/USD Technical Outlook: Price remains within a long-term ascending channel. Current correction could form an ABC pattern, with key Fibonacci retracement levels at $3,832 (38.2%) and $2,715 (61.8%). If bullish momentum resumes, extension targets point to $4,570 and $5,300

Ethereum analysisI thing These two levels are the best for eth to give a possible strong reversal towards all time high.
Both levels coincide with fib levels.

ETHUSDT.P - November 7, 2025ETHUSDT.P is showing continued signs of short-term bearish momentum after rejecting from the $3,370 resistance zone. A short position is positioned around $3,280, targeting a move toward the $3,179 profit level for a quick scalp.
