ETH is finally showing some sign of lifeETH after being bearish for so long is finally seen some inflow of money towards it, meaning ALT season is starting to show little glimpses here and there.
ETH Long term looks really good, if everything continues as smooth as it is currently then I will expect ETH to do great, the current targets I have going up 2.4k if the price hold those levels then 3.4k will be a walk to the park.
if it goes down to the 1900 even the 1700 area, I will just buy more.
Always put stop loses the current economy is showing no mercy, neither should we.
Trade ideas

ETH Hit the First Target — The Downtrend Is Fully IntactETH has perfectly reached the first downside target we mapped earlier. Price broke the key support zone and today's candles confirm that the move was not a fakeout — this is real momentum, not noise.
Right now, ETH is only retesting broken structure and still trading below all major resistances. Nothing about this chart suggests strength.
🔻 Next Steps (as plotted on the chart):
A small bounce / retest is normal here, but as long as ETH stays below $3,700–$3,800, the trend remains bearish and continuation toward $2,900–$3,000 stays the primary target.
This is still not a place to consider longs — it's simply a corrective pullback inside a confirmed downtrend.
⚠️ Trend direction has not changed.
This move down is following the same plan we laid out from the top.
❗ Not financial advice — only my personal view.

ETH-----Sell around 3475, target 3408 areaETH Contract Technical Analysis (November 6th):
On the daily chart, yesterday's close was a small positive candle, with a pattern of consecutive negative candles followed by a single positive candle. The price is below the moving average, and the accompanying indicators are in a death cross, indicating a clear downtrend. Yesterday's rebound was a correction after a significant drop, with the price correcting back to the moving average and facing secondary downward pressure – a common and predictable pattern. On the hourly chart, the rebound after the decline lacks strength and continuity, making it unlikely to establish a short-term trend. Therefore, intraday trading is expected to be range-bound, with the European session likely to see further downward pressure.
Today's ETH Short-Term Contract Trading Strategy:
Sell at 3475, stop-loss at 3510, target 3408.

ETH Giving Signals That The Market Has BottomedBitcoin did not que up a clear bounce in the charts, but many of the alts printed extreme colored candles into the clear Reversion Bands Support.

Eth bearish breakdownEthereum decisively broke through a major support line on high volume.
Unfortunately, it will be headed lower this year and next.
Target1: 2790 (highly likely)
Target2: 2160 (still possible)
Target3: 1430 (not likely)

Short trade
Day TF overview
📘 Trade Journal Entry
Pair: ETHUSDT.P
Direction: Sell-Side Trade
Date: Tue 4 Nov 25
Time: 12:40 pm
Session: NY Session PM
Timeframe: 1 Day
🔹 Trade Details
Metric Value
Entry 3,983.39
Profit Level (TP) 3,000.44 (+11.71 %)
Stop Level (SL) 4,141.42 (–4.7 %)
Risk–Reward (RR) 1:8.68
Projected Target
(Extended) 2,577.25 (–34.14 %)
🔸 Technical Context
Market Structure:
ETHUSDT has completed a Preliminary Supply → Buying Climax → UTAD sequence indicative of Wyckoff Distribution Phase C–D. Price has broken below the Change of Character (CHOCH) level at 3,900, confirming a bearish bias. The Breaker Block formed near 4,050 was retested and rejected — validating institutional sell-side control.
15min ~ TF overview
Fair Value Gaps (FVGs):
Multiple downside FVGs remain unmitigated between 3,800 → 3,000, offering magnet zones for draw-on-liquidity targets.
Daily inefficiencies suggest further markdown toward the 3,000 handle.
Confluence Factors:
Adaptive KAMA turning downward (bearish momentum confirmation).
High-volume rejection wicks at the 4,100–4,150 zone (supply confirmation).
A daily displacement candle formed after the retest (institutional order flow shift).
🔹 Narrative & Bias
ETH is transitioning into a markdown leg after completing a multi-month accumulation rally.
The rejection at 4,100 aligns with the broader crypto sector rotation into BTC dominance and short-term USD strength.
Phase Alignment:
Wyckoff Distribution → Phase D to Phase E progression.
Characterised by lower highs and successive liquidity sweeps.
Macro Sentiment:
BTC outperforming ETH across cross-pairs (ETHBTC ratio declining).
The market is reacting to tightening liquidity and lower risk appetite post-Fed communications.
Projection:
Primary target: 3,000 zone (daily FVG mitigation + PD array).
Extended target: 2,577 (institutional discount zone aligning with prior accumulation base).
Continuation bias is valid while below 4,050 resistance and until FVGs below 3,200 are filled.

ethusdtThe price is moving towards the opposite level of the daily trend after breaking the daily trend.

ETHA bad time to invest in Ethereum. The target at 2100 won’t be the final one. In the coming months, the only direction is down.

ethI have a strategy with 80% win rate.
The essence of it is that by the end of October, we will not see ETH above 4100.
On the other hand, we are still within the body of the 12-month candle from 2021. In 2024, we failed to hold above 3700, which indicates weakness and increases the likelihood of a move toward the 2021 low, around 700.
Right now, this sounds pessimistic and I don't like this scenario, but that’s how I see the chart.

ETHUSDT.P - November 4, 2025ETHUSDT.P is maintaining a clear bearish structure, with price accelerating lower toward the $3,400.00–$3,381.34 zone. The setup indicates a potential continuation of the downtrend toward this target area, unless invalidated by a recovery above the $3,681.23 resistance level. A decisive breakdown below $3,381.34 would open further downside extension, while a rebound from this zone could signal short-term relief before further weakness.
Risk Assessment: Moderate risk — momentum remains bearish, but proximity to a key support zone may trigger temporary corrective bounces before continuation.

ETHUSDT.P - November 4, 2025ETHUSDT.P is currently attempting a short-term bullish reversal within a broader corrective structure. After forming a local low near the $3,460.00–$3,446.72 support zone, price has rebounded and is now targeting a potential buy setup around the $3,538.13 level. This suggests buyers are seeking confirmation for continuation toward the $3,625.51 partial profit area and ultimately the $3,647.77 profit target.
A break and sustained move above $3,625.51 would reinforce the bullish momentum, while failure to hold above the $3,538.13 entry zone could expose ETH to renewed downside pressure, revisiting the stop level.
Risk Assessment: Moderate risk — price is showing early signs of recovery, but confirmation is needed above near-term resistance. The trade setup offers a favorable risk-to-reward ratio if the $3,460.00 support holds, though volatility may persist before directional clarity emerges.

ETH Extends Red Scenario — Key Support at 3,435Last week, Ethereum also followed our red scenario and is currently continuing its decline. The price is now very close to the previous low, and there’s a high chance of breaking it at 3,435 , which could lead to a further drop toward 3,128 .
A return of bullish sentiment is only possible above 3,945 — until then, we remain in a downtrend.

ETH/USDT 1W Chart📊 Market Structure:
Main Trend: Still up (higher lows and highs pattern persists).
Current Phase: Correction in an uptrend.
Local Trend: Down for several weeks (series of red weekly candles).
⚙️ Key Support and Resistance Levels:
Resistance (green lines):
4,753 USDT – recent local high, very strong resistance.
4,373 USDT – previous consolidation level, currently a supply zone.
3,979 USDT – current key local resistance, which previously served as support.
Support (red lines):
3,600 USDT – currently tested support level (coincides with the uptrend line).
3,165 USDT – next strong support level (previous local lows).
2,740 USDT – strong long-term support, potential target for further correction.
📈 Trendline:
The black uptrend line connects successive higher lows since April 2024.
The current weekly candlestick is testing this line (confluence with support at 3,600 USDT).
Maintaining this line = still a bullish medium-term scenario.
A breakout and weekly close below ~3,580–3,600 USDT → a signal of a possible trend reversal.
📉 Volume:
Downward volume is increasing, indicating supply pressure.
A lack of strong demand candlesticks = buyers are cautious in this zone.
🔄 Stoch RSI Oscillator (bottom of the chart):
Located in the oversold zone (below 20).
The %K (blue) and %D (orange) lines are starting to converge → a possible rebound signal in the coming weeks if a crossover occurs upwards.
🧭 Scenarios:
🟢 Bullish
Holding support at 3,600 USDT + trendline.
Confirmation with a bullish candle with higher volume.
Target: Return to 3,980 → 4,370 USDT.
🔴 Bearish:
Closing the week below 3,580 USDT (trendline + support).
Potential decline to 3,165 USDT, and even 2,740 USDT beyond.
RSI and volume suggest that downward pressure remains significant.
📌 Summary:
Key level: 3,600 USDT → decisive point for the market's further direction.
Short-term: Still downward pressure, but a technical rebound is possible (Stoch RSI).
Medium-term: The uptrend has not reversed until ETH closes below the trend line and 3,550 USDT.

[SeoVereign] ETHEREUM BEARISH Outlook – November 03, 2025I would like to share my Ethereum idea as of November 3.
This idea is an extension of the one from October 27. The short positions entered on the 27th will be closed in profit in connection with this idea, and I plan to add some additional positions at the same time.
Basis — Harmonic 1.414 Butterfly Pattern
Currently, Ethereum is approaching the completion zone of the 1.414 Harmonic Butterfly pattern that I personally designed.
This zone is structurally an overextension area,
where a strong technical reversal possibility exists.
Accordingly, I set the average target price around 3,400 USDT.
Further position management and updates will be provided depending on market conditions.
Thank you for reading.

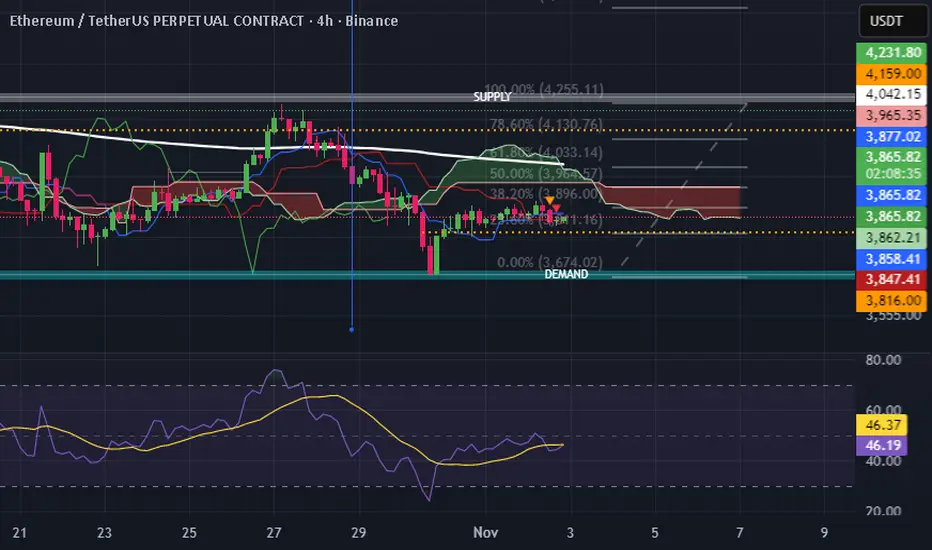
ETHUSD — Ichimoku & Fibonacci Time Analysis (4H)Ichimoku + RSI + Fibonacci used to identify key confluence.
Support zone: 3965–3896 (50–61.8% fib).
Bull confirmation above 4253. Next targets: 4409, 4491.
Strategy focus: time/price balance (Ichimoku-based).
ETHUSD — Ichimoku & Fibonacci Time Analysis (4H) and (1H)Ichimoku + RSI + Fibonacci used to identify key confluence.
Support zone: 3965–3896 (50–61.8% fib).
Bull confirmation above 4253. Next targets: 4409, 4491.
Strategy focus: time/price balance (Ichimoku-based).
bearish

ETH/USDT Swing Trade | Heikin Ashi Confirmation + Pullback Plan🚀 ETH/USDT: The Great Crypto Heist — Swing/Day Trade Wealth Strategy! 🤑
Ladies and Gentlemen, welcome to the Thief’s Master Plan for ETH/USDT (Ethereum vs. Tether)! 🎩 This is a fun, professional, and calculated swing/day trade setup designed to catch the bullish wave while dodging the traps. Let’s break down this heist with style, precision, and a sprinkle of humor! 😎
📊 Asset: ETH/USDT (Ethereum vs. Tether)
Market: Crypto (High Volatility, High Reward!)
Strategy: Swing/Day Trade with a Thief’s Layered Entry approach
Vibe: Bullish, sneaky, and ready to outsmart the market! 🦹♂️
🧠 The Plan: Bullish Breakout with Technical Confirmation
✅ Bullish Confirmation: We’re riding the bullish wave with a Triangular Moving Average (TMA) pullback. This confirms the trend direction and filters out noise.
✅ Heikin Ashi Magic: A strong bullish Heikin Ashi candle signals momentum. Watch for smooth green candles to confirm the trend’s strength! 📈
🔑 Key Insight: The TMA pullback combined with Heikin Ashi gives us a high-probability setup for a breakout. Stay sharp, Thieves!
🚪 Entry: The Thief’s Layered Approach
🕵️♂️ Strategy: Use a layered entry (multiple buy limit orders) to scale into the trade like a true market bandit!
📍 Entry Levels:
Buy Limit @ $4250
Buy Limit @ $4300
Buy Limit @ $4350
Buy Limit @ $4400
💡 Pro Tip: Feel free to add more layers based on your risk appetite! Stack those orders like a master thief stacking loot. 💰
⚠️ Note: You can enter at any price level within this range if you spot momentum. The layered approach maximizes flexibility!
🛑 Stop Loss: The Thief’s Escape Route
🚨 Stop Loss: Set at $4150 to protect your loot.
⚠️ Thief’s Disclaimer: This is my suggested stop loss, but you’re the boss of your own heist! Adjust based on your risk tolerance. Don’t get caught by the market cops! 👮♂️
🎯 Target: Steal the Profits, Dodge the Trap!
🏦 Target Price: Aim for $4700 as our primary profit zone.
🚨 Resistance Alert: A police barricade (strong resistance) lurks around $4800. This level is overbought and a potential trap for greedy thieves. Cash out early to secure your gains!
💡 Pro Tip: Don’t get too greedy — take profits at your own discretion. The market is full of traps, so escape with your loot! 🏃♂️
👀 Related Pairs to Watch
Keep an eye on these correlated pairs to confirm market sentiment and strengthen your setup:
BTCUSDT ($): Bitcoin often leads the crypto market. If BTC is pumping, ETH is likely to follow. Watch for BTC breaking key resistance at $60,000 for added bullish confirmation.
ETHBTC: This pair shows ETH’s strength relative to BTC. A rising ETH/BTC ratio suggests ETH is outperforming, reinforcing our bullish bias.
SOLUSDT ($): Solana often moves in tandem with ETH. A breakout in SOL above $150 could signal broader altcoin strength.
Key Correlation: ETH’s price action is tightly linked to BTC and overall market sentiment. Monitor BTC’s trend and crypto market cap for context.
🔍 Key Points & Why This Setup Works
TMA Pullback: Acts as a dynamic support zone, ensuring we enter after a healthy retracement.
Heikin Ashi Confirmation: Filters out choppy price action, giving us clear bullish signals.
Layered Entries: Spreads risk and allows flexibility in volatile markets.
Risk Management: Tight stop loss at $4150 keeps the risk-reward ratio attractive.
Market Context: Crypto markets are volatile, but ETH’s bullish structure and correlation with BTC make this a high-probability trade.
📝 Thief’s Code: Risk Management
Dear Ladies and Gentlemen (Thief OGs), this is a fun strategy, but trading is serious business! 🕴️
Set your own stop loss and take profit based on your risk tolerance.
Never risk more than you can afford to lose — this is a heist, not a gamble!
Stay disciplined, and don’t let the market cops catch you off guard! 🚓
“If you find value in my analysis, a 👍 and 🚀 boost is much appreciated — it helps me share more setups with the community!”
Disclaimer: This is a Thief-Style trading strategy crafted for fun and educational purposes. Always do your own research and trade at your own risk. The market is a wild place — stay sharp, Thieves! 🦹♂️
#ETHUSDT #CryptoTrading #SwingTrading #DayTrading #ThiefStrategy #Bullish #TechnicalAnalysis #HeikinAshi #TradingView

Eth Weekly Key SupportEth weekly candles currently have support of the Gann 1x2 fib ray and 78.60% fib
If Monday's candle can open above these supports then we can expect a price rally eventually reaching the top of the chart at around $6k
Breaking of ascending support would see a drop looking for next support at $2.8k-$3k
Opening of the next weekly candle will show direction

Will Ethereum’s tight range lead to a breakout? | Day 34☃️ Welcome to the cryptos winter , I hope you’ve started your day well.
⏰ We’re analyzing BTC on the 1-Day timeframe .
👀 Ethereum on the daily timeframe. Ethereum is currently inside a box-like structure in a trading range format. The top of this trading range is in the $4,161 area, and the bottom of this trading range is in the $3,801 price area, where by breaking these zones, Ethereum can start a stronger and more impulsive leg of movement.
🧮RSI oscillator, which has now formed two important oscillation zones for us — one around 54, which overlaps with our long trigger, and the other around 40, which overlaps with our short trigger. The fluctuation limit crossing these zones can give more momentum to Ethereum’s next move on the daily timeframe.
🕯 Ethereum’s volume, after the flash crash the market experienced, has increased sharply, but the tendency has been pushed toward selling pressure, which has caused Ethereum’s corrections to always come with selling pressure.
📈 For Ethereum positioning, the specified zones have high price action validity, where you can set alerts so that if the price reaches these zones, you can open a position. Or, in the multi-timeframe, you can find the identified support and resistance zones and open positions with lower risk around these areas, moving toward anticipating higher or lower levels, so that in each level, you can add some risk to your position.
❤️ Disclaimer : This analysis is purely based on my personal opinion and I only trade if the stated triggers are activated .

Historical Perspective: Previous Commodity Supercycles and Their1. Understanding the Concept of Commodity Supercycles
Before diving into history, it’s important to define what a commodity supercycle is. Unlike short-term price spikes caused by supply disruptions or speculative behavior, supercycles are long-duration upward trends in commodity prices — typically lasting 20 to 30 years — driven by massive structural demand changes.
These cycles reflect the interplay between:
Industrial demand (from large-scale urbanization and industrial growth)
Supply constraints (due to underinvestment in production)
Global economic transitions (such as post-war reconstruction or technological revolutions)
During the upward phase, rapid industrialization boosts demand for raw materials like oil, copper, steel, and agricultural goods. As prices rise, producers expand capacity — often overshooting — which eventually leads to a long-term correction and a downcycle.
2. The 19th Century: The First Modern Commodity Supercycle (1815–1873)
The earliest known commodity supercycle occurred during the Industrial Revolution of the 19th century. Following the Napoleonic Wars (1803–1815), Europe entered a period of peace and rapid industrial expansion, setting the stage for the first global surge in commodity demand.
Key Triggers:
Industrialization in Britain and Western Europe:
Britain’s industrial revolution accelerated demand for coal, iron, and steel. The invention of the steam engine and expansion of railways required massive quantities of these resources.
Urbanization and Infrastructure Development:
Rapid urban growth and the construction of factories, bridges, and transportation networks fueled consumption of metals, timber, and coal.
Global Trade Expansion:
The 19th century saw an unprecedented globalization of trade, driven by colonial expansion and improvements in shipping technology. This increased both the supply and the reach of commodities.
Outcome:
From the 1820s to the 1860s, prices for key commodities such as iron, copper, and coal rose sharply. However, the cycle ended around 1873, coinciding with the Long Depression, as supply caught up with demand and economic growth slowed. Nonetheless, this period laid the foundation for modern industrial economies and global commodity markets.
3. The Early 20th Century Supercycle (1899–1939)
The next significant supercycle unfolded between 1899 and 1939, overlapping with major historical events — including World War I, the Great Depression, and the early stages of the Second Industrial Revolution.
Key Triggers:
Technological Innovations and the Second Industrial Revolution:
Advances in electricity, the internal combustion engine, and chemical manufacturing spurred enormous demand for copper (for wiring), oil (for engines), and steel (for infrastructure and weapons).
Global Urbanization and the Automobile Era:
The rise of automobiles created a new and massive demand for oil and rubber. Countries like the U.S. became both producers and consumers of these resources at unprecedented scales.
World War I (1914–1918):
The war generated extreme demand for metals, food, and energy. Governments mobilized vast industrial capacity to supply military needs, creating temporary price booms.
Post-War Reconstruction:
After the war, Europe required significant rebuilding, further pushing up commodity prices in the early 1920s.
Outcome:
The 1920s witnessed strong commodity prices, but the Great Depression (1929–1939) brought the supercycle to a crashing halt. Overproduction, financial instability, and protectionist policies caused global trade to collapse, sending prices plummeting. This cycle demonstrated how financial crises and overcapacity could abruptly end periods of prosperity.
4. The Post-World War II Supercycle (1946–1973)
After the devastation of World War II, the world embarked on a massive phase of reconstruction and modernization, which fueled one of the most well-documented commodity supercycles.
Key Triggers:
Post-War Reconstruction (Marshall Plan):
Europe and Japan undertook extensive rebuilding efforts financed by the United States through the Marshall Plan (1948–1952). This drove global demand for steel, cement, copper, and machinery.
The Rise of Consumer Economies:
The mid-20th century saw the emergence of middle-class consumption in Western economies. Automobiles, housing, and appliances required vast amounts of raw materials and energy.
Decolonization and Global Integration:
Newly independent nations began industrializing, expanding agricultural and mining activities, and increasing trade participation.
Oil Demand and Energy Expansion:
The oil industry experienced explosive growth during this period. Petroleum became the lifeblood of modern economies, fueling transport, industry, and electricity generation.
Outcome:
This supercycle peaked in the early 1970s, when strong global growth and tight oil supply culminated in the 1973 Oil Crisis. The OPEC oil embargo sent prices skyrocketing, marking both the climax and the collapse of the post-war boom. The subsequent stagflation of the late 1970s and early 1980s signaled the end of this cycle. Yet, it transformed the global energy landscape and established oil as the most strategically vital commodity.
5. The 2000s Supercycle: The China-Led Boom (2000–2014)
The most recent and perhaps most influential supercycle in modern memory began around 2000 and lasted until roughly 2014. It was primarily driven by the rapid industrialization and urbanization of China, along with strong growth across emerging markets.
Key Triggers:
China’s Industrial Expansion:
China’s entry into the World Trade Organization (WTO) in 2001 catalyzed a historic wave of manufacturing and infrastructure investment. The country became the world’s largest consumer of steel, copper, coal, and cement.
Urbanization Across Emerging Economies:
Beyond China, countries like India, Brazil, and Indonesia experienced rising urbanization, boosting demand for construction materials and energy.
Financialization of Commodities:
The early 2000s saw increased investor participation in commodity markets through ETFs and futures. Commodities became a mainstream asset class, amplifying price movements.
Energy Demand and the Rise of Oil Prices:
Oil prices surged from around $20 per barrel in 2000 to over $140 per barrel in 2008, driven by strong global demand and geopolitical tensions in the Middle East.
Underinvestment in Supply:
The previous two decades of low commodity prices had discouraged exploration and investment. When demand spiked, supply was unable to keep pace, intensifying the price surge.
Outcome:
The 2008 Global Financial Crisis temporarily interrupted the supercycle, but prices rebounded quickly due to China’s massive stimulus package and infrastructure spending. However, by 2014, oversupply — especially in oil and metals — combined with slowing Chinese growth, ended the cycle. This period reshaped the global commodity market, making China the central player in global demand dynamics.
6. Common Triggers and Patterns Across Supercycles
While each supercycle is unique, historical analysis reveals recurring themes and triggers:
Industrialization and Urbanization:
Every major supercycle coincided with rapid industrial expansion — whether in 19th-century Europe, post-war America, or 21st-century China.
Technological Transformation:
Breakthroughs like steam power, electricity, and automobiles dramatically shifted commodity usage and demand profiles.
Demographic and Economic Expansion:
Population growth and income rises fuel demand for housing, transport, and consumer goods — all resource-intensive sectors.
Supply Lag and Investment Cycles:
Commodity supply responds slowly due to long project lead times in mining, energy, and agriculture. This delay amplifies the effects of demand surges.
Geopolitical and Military Events:
Wars, embargoes, and trade disruptions often accelerate price booms by constraining supply and increasing uncertainty.
Financialization and Speculation:
In modern times, increased participation by institutional investors has made commodity markets more sensitive to financial sentiment.
7. Lessons from Historical Supercycles
A. The Role of Structural Demand Shifts
Sustained demand growth — not temporary shocks — is essential for a true supercycle. Industrial revolutions and global reconstruction phases have consistently been the key demand drivers.
B. The Danger of Overinvestment
Each boom phase has historically been followed by a glut as producers overexpand capacity. This overinvestment eventually depresses prices and leads to prolonged downturns.
C. The Importance of Policy and Global Coordination
Government policy, trade agreements, and geopolitical stability can either extend or shorten a supercycle. For example, the Bretton Woods system and post-war cooperation helped sustain the 1950s–1970s boom.
D. The Cyclical Nature of Commodities
Despite new technologies and financial instruments, the commodity market remains inherently cyclical. Prices eventually revert as supply catches up and demand matures.
8. Could We Be Entering a New Supercycle?
Many analysts argue that the 2020s could mark the beginning of a new commodity supercycle, driven by factors reminiscent of past booms but adapted to modern realities:
Green Energy Transition: Demand for lithium, copper, nickel, and rare earth elements is soaring due to renewable energy technologies and electric vehicles.
Infrastructure Stimulus: Governments worldwide are investing heavily in post-pandemic recovery and infrastructure modernization.
Supply Constraints: Years of underinvestment in mining and oil exploration could limit supply just as demand accelerates.
Geopolitical Realignments: Conflicts, trade tensions, and resource nationalism are reshaping supply chains and commodity flows.
If history is a guide, the combination of these structural forces suggests that another long-term uptrend in commodities may be emerging — though, as always, the balance between supply and demand will ultimately determine its longevity.
Conclusion
The history of commodity supercycles is, in essence, the story of human progress — from steam engines to skyscrapers, from oil booms to electric revolutions. Each supercycle reflects a period when global society undergoes transformative change, demanding vast quantities of raw materials to fuel development.
From the 19th-century Industrial Revolution to the China-led boom of the early 21st century, the triggers have remained consistent: industrial growth, technological innovation, and demographic expansion. Yet, each cycle has also taught hard lessons about overproduction, economic imbalance, and the limits of natural resources.
As the world moves toward a low-carbon, technology-driven future, the next supercycle may look very different — centered around green commodities and sustainable growth — but it will still be governed by the same fundamental forces that have shaped markets for over two centuries.

Can Short-Term Holders Rescue Ethereum From a Drop to $3,500?At the time of writing, Ethereum is trading at $3,846, holding just above the $3,802 support level. The altcoin king is likely to remain rangebound as market conditions show limited volatility.
Ethereum’s price currently fluctuates between $4,154 and $3,802. This consolidation range could persist in the coming sessions, with ETH possibly retesting resistance if short-term momentum returns.
However, if bearish conditions intensify and Ethereum loses the $3,802 support, a further drop could follow. A breakdown below this level may send the price under $3,742 and toward $3,500, invalidating the bullish thesis and signaling deeper market weakness ahead.

ETHUSDTFollow the previous TA, i drawed order blocks in our way to reach the Final target...
please check both TAs

ETHUSDT Sell Position smashed the TPAfter predicting a Sell on ETHUSDT on the 4hr timeframe due to a crazy 4hr Double Top pattern that formed on a bullish Trendline, I presumed that the Trendline would be no match for the HTF chart pattern and the rest was history. 1:2 Risk to Reward ratio achieved.
