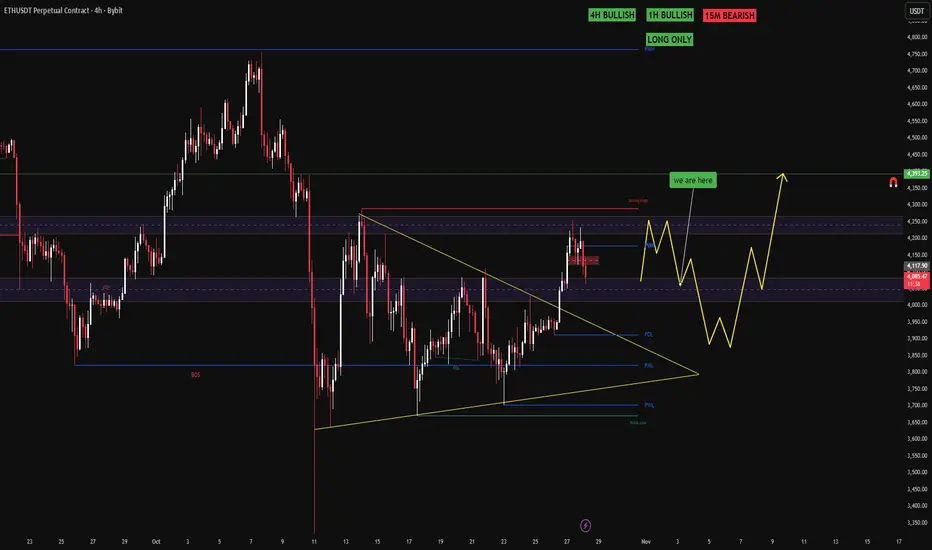
Ethereum Correction: Key Support at 200 SMA & TrendlineLast week, Ethereum moved according to our orange scenario.
At the moment, the price is in a local downward correction. The weekly pivot point is at 4,015 — if it breaks, we’ll need to see a bounce from the 200 SMA and a quick recovery above the reversal level. Otherwise, the chances increase for a move toward the trendline.
Trade ideas

ETH Daily Technical Overview — Cycle & Box AnalysisCycle Structure:
HWC (Higher Wave Cycle – Long-Term): Bullish 🔼
MWC (Middle Wave Cycle – Mid-Term): Range 🔁
LWC (Lower Wave Cycle – Short-Term): Bearish 🔽
Market Context:
The first step is to assess the market from a cycle and wave perspective 🧐. Recent sharp down moves are ignored as they are emotional reactions.
The current support is a box 📦 that has been tested for around 35 days with four significant touches. My bias is long here 🚀.
Long Setup:
Weakness in the short-term MWC 🔁 could trigger a bullish move if 4232 resistance is broken and confirmed ✅.
The next resistance at 4757 🚧 could turn all cycles bullish 🔼🔼🔼 if broken, offering strong upside potential 📈.
Short Consideration:
The market is unpredictable ⚠️, so short scenarios should be considered too.
Until price reaches 3708 ⬇️, I won’t consider shorts ❌.
Shorts require more structure and confirmation.
Remember, downside moves are still possible ⚡, so risk management is key 🛡️.
📌 Signature:
If you want a specific coin analyzed, drop a comment 💬👇 and I’ll cover it.
⚠️ Without proper risk management, you're just a ticking time bomb 💣

ETH-USDTSee the dot in Ethereum
Exactly 4050 as I said stopped the decline 💰👀
If it manages to break 4300, Ethereum and altcoins will enter a new bullish phase✔️🚀


Ethereum could make a new ATH if the price could hold above Ethereum could make a new ATH if the price could hold above this significant and major support level however in LTF there could be some liquidation to the lower price its just good for healthy market by end of Q4 2025 - Q1 2026 we could get the peak alt season as well
ETHEREUM climbing up slow and steadyETH is slowly breaking above resistance levels. However, the hard work is not over. As ETH tries to reclaim its range, it's important that the bull maintain momentum. Volume is a factor in with current price action. Without volume back PA, it will be difficult to sustain the bullish move.

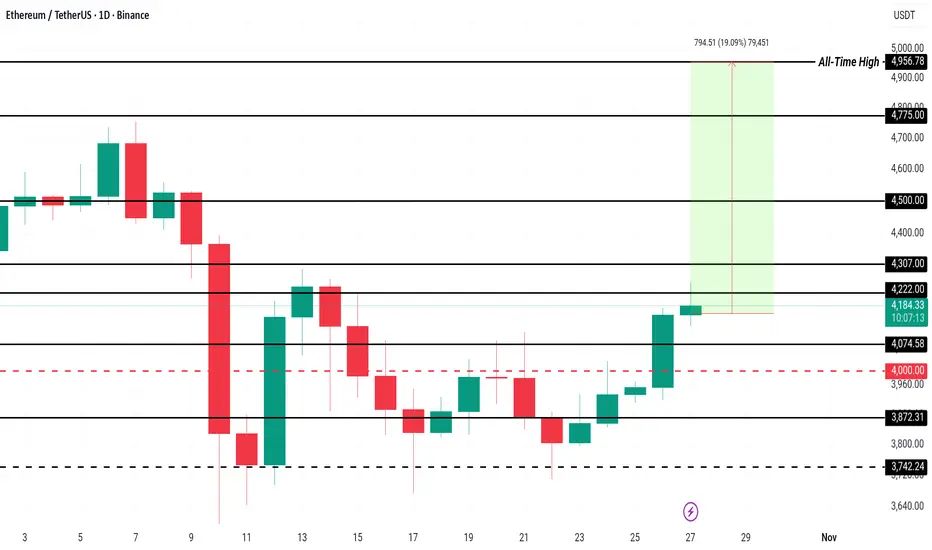
3 Altcoins That Could Hit All-Time Highs In November 2025Ethereum is trading at $4,156, holding firmly above the $4,000 support while facing resistance at $4,221. The altcoin king's recent consolidation reflects cautious optimism among traders.
To reach its all-time high of $4,956, Ethereum needs a 19% price increase. This requires breaking through resistances at $4,221 and $4,500. The Relative Strength Index (RSI) indicates strengthening bullish momentum, suggesting buyers are regaining control and could drive ETH higher.
However, if selling pressure intensifies, Ethereum could fall below $4,000 and target $3,872 or even $3,742. Such a decline would signal weakening demand and invalidate the bullish outlook.
Second Leg Incoming? Ethereum Needs Volume.👋🏻 Hey everyone! Hope you’re doing great! Welcome to SatoshiFrame channel.
✨ Today we’re diving into the 4-Hour Ethereum analysis. Stay tuned and follow along.
👀 Looking at Ethereum on the 4-hour timeframe, we can see that just like Bitcoin, Ethereum began a strong bullish leg yesterday, breaking several of its multi-timeframe resistances. With this price jump, it has now reached its resistance area at $4,252. Keep in mind that the market may take a short rest at this level, and price may experience a brief pullback to the downside.
🧮 The RSI oscillator is currently exiting the OverBuy zone, which is a sign that a multi-timeframe correction may begin for Ethereum.
🕯 During this bullish leg, Ethereum’s volume has increased slightly. However, since sell orders have been lower than before, this volume increase does not appear very strong on the 4-hour chart. Therefore, if Ethereum intends to form its second bullish leg upward, we will likely need to see a more noticeable increase in buying volume.
✍️ The scenario ahead for Ethereum, like Bitcoin, is independent of any trade or position, and it simply helps us better understand Ethereum’s corrective price behavior.
🛡 Ethereum, similar to Bitcoin, is entering a price resting phase. This rest can extend down toward support levels, and if a stronger bullish continuation wants to form, we may see a reversal reaction near these zones. If such a move occurs, the analysis and scenarios will be updated for you.
❤️ Disclaimer : This analysis is purely based on my personal opinion and I only trade if the stated triggers are activated .

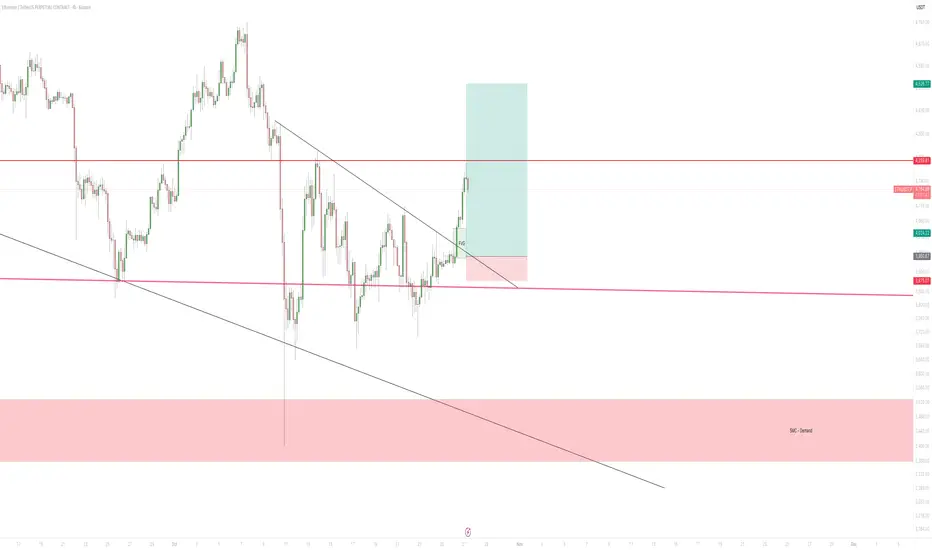
ETH - BreakoutpatternThis chart shows a clear breakout from a descending trendline, indicating a potential shift from bearish to bullish momentum. The market had previously been in a downtrend, forming a series of lower highs and lower lows, but price has now broken above that structure. After the breakout, there’s a slight pullback toward the former resistance area, which is now acting as support. This zone also aligns with a Fair Value Gap (FVG), suggesting a short-term demand area where buyers might step in to defend price.
Currently, price is consolidating just above that zone, which often happens during a retest phase before a possible continuation move higher. The upper red line represents a key resistance level, marking a logical take-profit zone based on previous structure highs. The larger red box below the chart shows a major demand zone, which would act as strong support if price were to fall back into that area.
The trade setup displayed on the chart is a long position with a favorable risk-to-reward ratio — entry after the breakout and retest, stop loss below the FVG and trendline area, and target near the upper resistance zone. As long as price remains above the retested breakout zone, the bias stays bullish and a continuation toward higher levels is likely. However, if the market closes back below the broken trendline or dips into the deeper red demand zone, it would invalidate the bullish scenario and signal renewed bearish pressure.
In short, the chart illustrates a bullish breakout and retest pattern with potential for continuation, but with clear invalidation levels defined below the current structure.
ETH/USDTETH is currently trading within a consolidation range.
The direction of the next move — and the formation of a potential trading strategy — will depend on which side of the range gets taken out first and how the breakout occurs.

ETH Support Holding, But Cracks ShowingAs long as CRYPTOCAP:ETH holds the key support zone, the overall structure remains bullish and there’s nothing to worry about.
However, the technical setup is starting to weaken, a break below this support could turn things ugly, especially for altcoins.
DYOR, NFA
#PEACE
Thanks for reading! Appreciate your support and engagement 🙏

Etherium to 7500Right now BINANCE:ETHUSDT is just barely holding above 3500 area which is a good sign and showing it's potential to break ATH. But remember 3500 is not that major support, so it may break this support area and look for major support zone which is around 2100-2600 area. That would be a perfect opportunity enter long position on BINANCE:ETHUSDT , or maybe buy on spot. It can also fakeout 3500 area and go up. And also there is a obvious triangle pattern appeared in 1W timeframe which is a very good sign to go up in my opinion. Our first target will be 7500 and then 10k, 12k, 15k. So time will tell.

ETH-USDT Technical Analysis Report- 25/10/2025 ETH-USDT Technical Analysis Report
## Current Situation Summary
**Current Price:** 3928.43 USDT
**24-Hour Change:** +54.47 USDT (+1.41%)
**Price Range:** 3864.9 - 3957.25 USDT
**Volume:** 72,052,749 Contracts
---
## Price Trend Analysis
### **Overall Trend**
Ethereum is currently in a **mild uptrend**. The price has gained 1.41% in the past 24 hours and has managed to break through the support level of $3864.9.
### **Key Points**
- **Main Resistance:** 3957.25 USDT (24-hour high)
- **Strong Support:** 3864.9 USDT (24-hour low)
- **Current Price:** Near the middle of the price channel
---
## Volume and Volatility Analysis
### **Trading Volume**
The 24-hour trading volume of 72 million contracts indicates **moderate** market activity. This volume is suitable for a price move of 1.41% and indicates a relative balance between buyers and sellers.
### **Volatility Analysis**
- **Volatility Range:** 92.35 USDT (2.35% of current price)
- **Volatility:** Medium to Low
- **Price Stability:** Fairly Favorable
---
## Candlestick Pattern Analysis
Based on hourly data from the past 24 hours:
### **Strengths**
1. **Sustained Uptrend:** Price has risen from 3886.76 to 3928.44
2. **Resistance Break:** Successfully crossed the $3920 level
3. **Strong Support:** Positive reaction at $3864.9
### **Weaknesses**
1. **Resistance at 3957:** Unable to fully break this level
2. **Bearing Volume:** Volume has decreased in recent hours
3. **Hesitation at Highs:** Retracement from daily highs
---
## Forecast and Scenarios
### **Bullish scenario (60% probability)**
- **Short-term target:** 3980-4000 USDT
- **Condition:** Support 3900 held and break 3957
- **Volume requirement:** Increase in trading volume
### **Neutral scenario (25% probability)**
- **Range:** 3880-3950 USDT
- **Duration:** 2-3 days
- **Characteristics:** Fluctuation in the current channel
### **Bearish scenario (15% probability)**
- **Target:** 3820-3850 USDT
- **Trigger:** Break of support 3864.9
- **Warning:** Sharp decrease in volume
---
## Trading recommendations
### **For day traders**
- **Entry:** On retracement to 3900-3910
- **Exit:** Near 3950-3960
- **Stop Loss:** Below 3880
### **For Medium-Term Investors**
- **Expect:** Until a clear break of 3957
- **Target:** 4050-4100 USDT
- **Risk:** Medium
### **Risk Management**
- Maximum 2-3% of capital per trade
- Use a mandatory stop loss
- Monitor trading volume
---
## Conclusion
ETH-SWAP-USDT is currently in a **cautious uptrend**. Despite the 1.41% growth, the market is still waiting for a clear break of the $3957 resistance. Moderate volume and controlled volatility indicate a balanced market. Traders should wait for stronger signals to enter large positions.

ETHEREUM ETHUSDT WEEKLY PERSPECTIVE ETHEREUM TECHNICAL INFORMATION.
THE WEEKLY TIME FRAME SHOWS THAT BUYERS REJECTED THE 4998-5000 ZONE AND IT BECOMES OUR NEW BUY LIMUS TEST IN THE FUTURE.THE BREAK AND COSE OF A WEEKLY CANDLE WILL CALL FOR 15MIN SCALP IN SEARCH OF POINT OF ENTRY TO AIM 6000-7000$ IN PROFIT.
THE CURRENT REALITY WITH ETHEREUM SHOWS LACK OF BIUY MOMENTUM AND ITS EVIDENT FROM THE BREAK AND RETEST OF 4200 LEVEL ON WEEKLY TIME FRAME ON THE CHART ,THIS REACTION IS DETAILED ON THE CHART FOR REFERENCE.
THE SELL CONFIRMATION WILL COME FROM THE WEEKLY BREAK AND CLOSE 3780 AND MY SELL TARGET WILL BE 3116$ DEMAND FLOOR AND ALSO 50% FIB LEVEL
TARGET 2 WILL BE 2727.8 DEMAND FLOOR
AND PRICE COULD GO LOWER BEYOUND THIS ZONE ON BEARISH SENTIMENT AND PROLONGED TAKE PROFIT,
ETHEREUM IN CONTEXT
Ethereum remains the second-largest cryptocurrency by market capitalization and continues to be a foundational platform for decentralized finance (DeFi), smart contracts, and tokenized assets.
Ethereum 2025 Overview and Outlook
Ecosystem Growth: Ethereum’s ecosystem is expanding with over 127 million active wallets and total value locked (TVL) in DeFi protocols reaching about $96.86 billion, a 50% increase since mid-2025.
Technology Upgrades: Recent upgrades like Pectra and Fusaka, along with Layer 2 solutions such as Arbitrum, improve scalability, reduce fees, and enhance user experience.
Macro and Regulatory: Institutional inflows via Ethereum ETFs total nearly $24.7 billion, supported by gradual regulatory clarity.
Price Forecast: Despite short-term volatility, Ethereum shows strong fundamental on structure and rally.
Summary
Ethereum remains a dominant blockchain platform with robust adoption and technical advancements, supporting a positive price outlook .currently, with potential to rally toward $5000-6000k if they break and close weekly resistance at 4200
the ecosystem growth, institutional participation, and network upgrades will be its bullish catalyst
.

Ethereum weakened or holding structure? | ETH 1H Analysis👋🏻 Hey everyone! Hope you’re doing great! Welcome to SatoshiFrame channel.
✨ Today we’re diving into the 1-Hour Ethereum analysis. Stay tuned and follow along.
👀 We observe Ethereum on the 1-hour timeframe. After breaking and stabilizing at the $3,889 zone, Ethereum formed a higher low on this area and is now moving along a trendline (dynamic support), with an important static resistance at $3,982.50. Price has reacted to this level once but has not succeeded in breaking it!!!
🧮 Using the RSI oscillator is a reasonable approach in this situation. Since Ethereum is currently in a box/trading range, a breakout requires entering overbuy territory and surpassing the 70 level. Note that there is a significant oscillation support below the average, at the 44.5 zone, which holds strong validity and represents our swing low.
🐷 Pay attention to Ethereum’s volume. To break the specified zone, Ethereum needs to show a strong reaction, fill sell orders, and liquidate futures contracts. Therefore, we need buyer market makers to support the breakout, causing volume to increase through a price jump.
✍️ The scenario forming for Ethereum may require some patience and could play out differently, because we are now facing the second touch of this level, so the win rate of this scenario may be slightly lower.
🟢 Long Position Scenario
Breaking Ethereum’s resistance at $3,982.50 along with surpassing the 70 RSI level and seeing a significant increase in buying volume and price squeeze can form a good long position scenario on Ethereum.
❤️ Disclaimer : This analysis is purely based on my personal opinion and I only trade if the stated triggers are activated .

High RR...Don't need to be right often - Q the flash dump - A braindead trade regardless of bias - fib targets plotted - if 1.618 busts assume it's a larger correction.

more optimistic cycle topbased on historic data and patterns, a potential -more optimistic- cycle top at price range of 9.5-9.8k USD.

ETHUSDTBINANCE:ETHUSDT have a amazing trend because this is second the best crypto an head of all project so is in watchlist of best traders.
Support for buy: 3750$
Resistance for targets: 4045 - 4200 - 4435 - 4755
Please your risk management.

Possible Ethereum Scenario in the Week AheadPossible Ethereum Scenario in the Week Ahead
Possible Ethereum Scenario in the Week Ahead Given the price of Bitcoin, which doesn't seem very interesting, you should monitor the movement and volatility of Bitcoin.

ETH Eyes Upside RunEthereum shows signs of regaining strength after a prolonged corrective phase. The asset is currently stabilizing, supported by gradual inflows from institutional participants and renewed investor accumulation. Market behavior indicates controlled volatility, suggesting a preparation phase before a potential expansion.
Network data reflects consistent transaction activity, while liquidity concentration hints at sustained participation from long-term holders. The recent stabilization in funding rates and improved open interest add weight to the recovery outlook.
If momentum continues to build under these conditions, Ethereum could enter a structured growth cycle in the coming sessions.

ETHEREUM to $3300 #ETH is so cooked
Descending triangle. This is a textbook classic pattern
If it closes bellow $3700, then it should drop to $3300

Ethereum Sees Major Sell-Off as Price Fails to Break $4,000Ethereum’s price sits at $3,950 at the time of writing, stuck below the critical $4,000 resistance. The altcoin has been oscillating near $3,872, showing no clear directional bias.
The current indicators suggest that this consolidation phase above $3,742 support is likely to persist. However, if market conditions worsen and ETH slips below $3,742, a further decline toward $3,489 could follow. Such a move would confirm a bearish continuation pattern.
Conversely, if buying activity strengthens and overall sentiment improves, Ethereum could breach the $4,000 resistance level. A successful breakout would open the path toward $4,221, invalidating the bearish outlook and signaling renewed investor confidence.

eth bearish set upas you see there will be a new bearish trend !! i show you an ABC pattern (major trend) and inside than we are completing an triangle as (B) so i predict a bearish trend as (c) in near future.
