Trade ideas

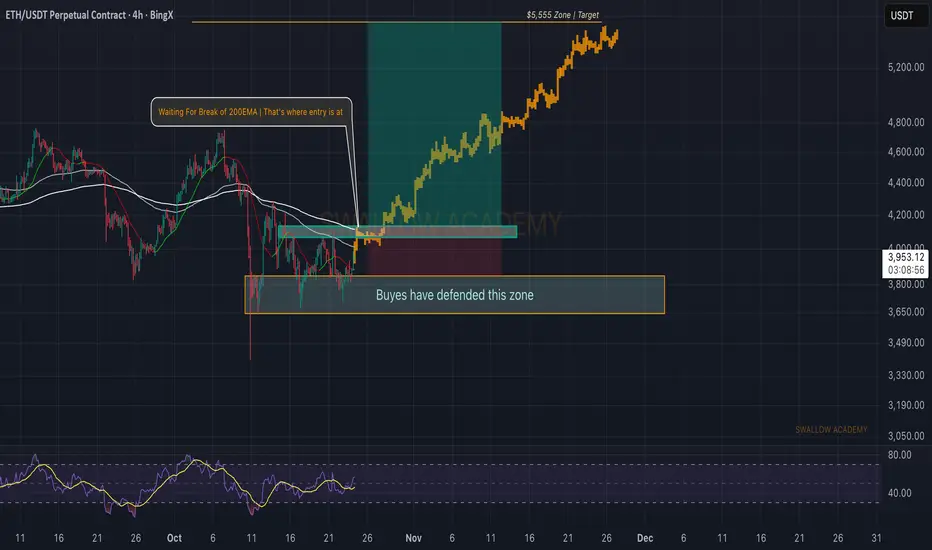
Ethereum (ETH): Getting Closer To 200EMA | Waiting is KeyETH is getting closer and closer to that 200 EMA line, which is the game changer at the current moment. As soon as we see the buyers overtake that zone, we will be aiming to see a decent upside movement.
Momentum is good; the only thing that concerns us is that we are entering the weekend markets.
Swallow Academy
ETH 1h chartCRYPTOCAP:ETH 1H Chart
Ethereum showing a clear market structure shift.
After a liquidity grab and CHoCH, price respected the 1H FVG and confirmed a bullish BOS, signaling potential continuation to the upside.
If price maintains above the FVG zone, ETH could look for higher targets in the short term.
#ETH #Ethereum #Crypto #PriceAction

ETHUSDT 2-Hour Chart Analysis. ETHUSDT 2-Hour Chart Analysis.
ETH is consolidating above key support levels ($3,700–$3,800) and exhibiting a lateral range, but a clear breakout has yet to occur.
The chart path indicates a bullish scenario: if ETH holds above this base, the next major resistance lies near $4,280—a move above this could lead to a target of $4,400+.
Bullish traders will want to see a strong candle above $3,900 to maintain momentum; failure to hold $3,700 raises the risk of a move towards the $3,390 support level.
DYOR | NFA

ETHUSDT.P - October 24, 2025This indicator introduces a minimalist Buy/Sell signal methodology designed for clarity and power. The goal is to strip away all visual clutter—no trendlines, no Boxes, no FVGs—to focus solely on generating precise market directional signals.
It is specifically developed for stability and reliability on well-established major-cap cryptocurrencies (e.g., ETH, BTC). It is not intended for use with high-volatility, low-cap, or memecoins.
Observed Performance
The underlying logic has shown strong results on major pairs. A sample backtest on ETHUSDT.P demonstrated a focus on quality over quantity, yielding 4 clean trades over a 60-day period with a 100% win rate.
The methodology is currently for private study and application, serving as an example of how powerful, clean indicators can be developed for traders focused on large-cap stability.
This content is for educational and analytical purposes only and does not contain any promotional material, solicitation, or fundraising requests.

ETHUSDT-LONG IDEA ETHUSDT is getting toward upside from support level. changed its internal structure at 30 mins forming HH and HL breaking above this level will lead price toward upside for short period of time as it is in accumulation no rally can be expected in this range right now.

ETH/USDT 4H CHART REVIEW🔍 Overall market structure
• Ethereum is moving in a descending triangle/converging channel (yellow trend lines).
• The upper trend line acts as strong resistance (~$4,000-$4,150).
• The lower trend line (rising) provides key support around ~$3,730-$3,750.
⸻
📊 Key levels
Resistances:
• $3,875 – local resistance, where the price rebounded several times.
• $3,990 – another resistance resulting from the yellow trend line.
• $4,143 – main resistance in the breakout zone of the formation (potential target after breaking the downtrend).
Support:
• $3,808 – short-term support.
• $3,733 – important level within the formation (lower yellow trendline).
• $3,637 – strong support that should not be broken while maintaining bullish sentiment.
⸻
📈 Indicators
MACD:
• MACD and signal lines are close to each other - no clear momentum.
• Histogram decreases → possible short-term weakness or consolidation.
RSI:
• RSI indicator around 45–50 → neutral, with no clear advantage of buyers or sellers.
• No divergence, but potential for a rebound if RSI drops to ~40 and rebounds.

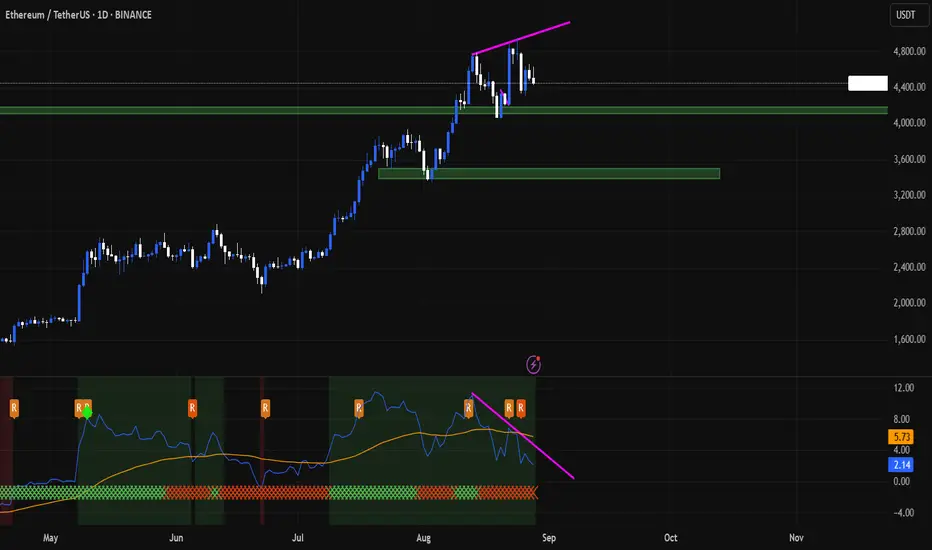
Ethereum Daily Chart Update📉 Ethereum Daily Chart Update
ETH has diverged on the daily timeframe and indicators suggest a pullback.
⚡ First support: $4,000
⚡ Second support: $3,500
Stay cautious — key levels ahead! 🚀
ETH | Tuesday High of the week - Thursday ContinuationToday I'm looking for a continuation to sellside for the weekly profile framework.
I would like to see a distribution on 10 AM news and a delivery to DOL tomorrow with CPI.
Invalidation levels marked out on chart

It is time for ETH To touch the moonEthereum has conclusively breached the major resistance of the descending trendline we previously identified on the weekly timeframe. The price has since retested this former resistance level twice, which has now held firm, confirming its new role as support. This successful conversion of resistance into support signifies a robust bullish shift in market structure. Consequently, the asset demonstrates strong momentum, indicating a high potential for a sustained and significant upward trend.
DISCLAIMER: ((trade based on your own decision))
<<press like👍 if you enjoy💚
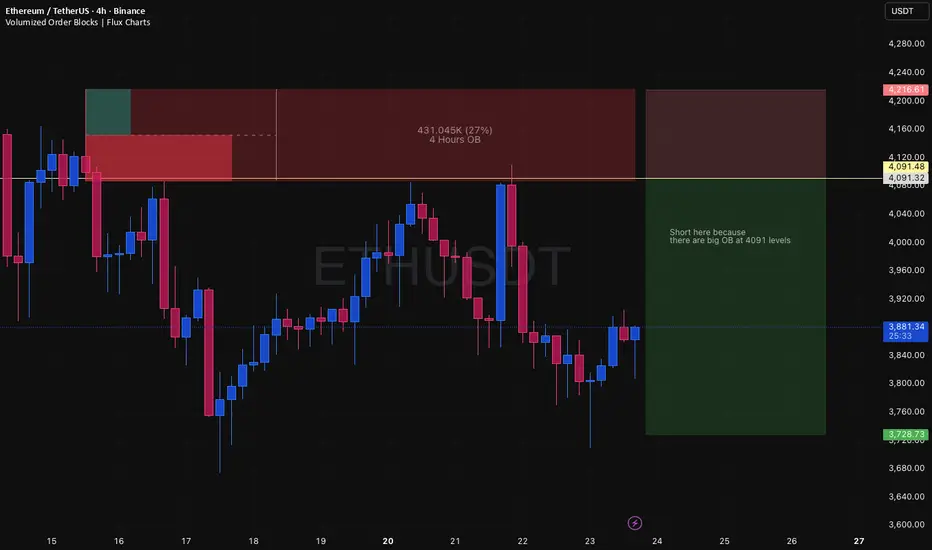
ETHUSDT 4H – Order Block Short Setup
Symbol: ETHUSDT (BINANCE)
Trade Type: Short
Timeframe: 4 Hour (4H)
Setup Details:
Entry: Short at 4091 (identified order block/OB level).
Stop Loss: 4216 (above OB, outside wick traps, 3.06% risk).
Target: 3728 (major support, large RR potential: 2.89).
Rationale: There is a significant order block resistance at 4091, historically rejected. Price recently touched and failed to break above here, giving textbook risk/reward for shorting.
Conditional: If candle closes convincingly above 4091 or OB structure shifts bullish, exit trade and wait for confirmation.
Position Size/Leverage: Size appropriately so stop loss is not account-threatening. Avoid over-leverage given proximity to major level.
Notes:
Do NOT hold if obvious breakout above 4091 or aggressive volume enters.
Consider partial profit at 3840 for risk management; full TP at 3728 on momentum flush.
Tags: #ETHUSDT #OrderBlock #Short #4H #TradingIdea
Visual: Chart shows RR box and marked OB. Text: “Short here because there are big OB at 4091 levels.”
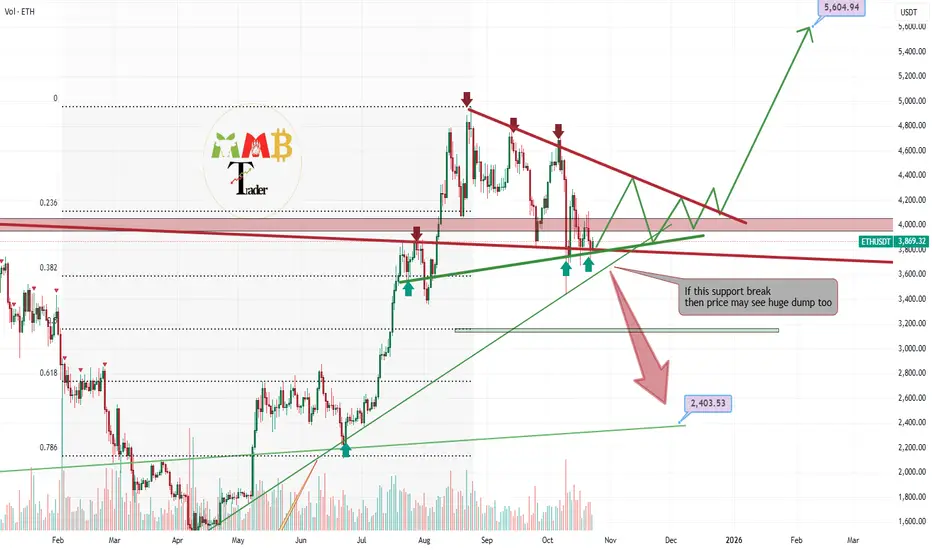
ETHUSDTAs you can see on the chart, the price has formed a beautiful triple-bottom pattern and is currently accumulating liquidity.
As we all know, liquidity accumulation usually comes with a period of time correction (consolidation).
If the price loses the triple-bottom support zone, it’s likely to drop toward 3300–3400.
However, if buying pressure appears here and we see a confirmed price stabilization above the 4000 zone,
we can expect the first potential bullish target around 4640.
Respectfully

ETH-USDTThe previous one was exactly what I said
That is, the trend line was broken and the pullback resulted in a 5% price increase 💎💰
If Ethereum can get above $3900 in the new update,
its path to rise to $4100 will open up

DeGRAM | ETHUSD is correcting📊 Technical Analysis
● ETH/USD remains in a broad ascending channel but is now testing its mid-range support near 3,900 after multiple rejections from the upper resistance line.
● A breakdown below 3,800 may trigger a move toward 3,380, aligning with the lower boundary of the long-term channel and completing a corrective wave.
💡 Fundamental Analysis
● Ethereum’s price faces pressure amid slower network activity and rising competition from L2 ecosystems, while macro uncertainty weighs on crypto sentiment.
✨ Summary
● Short bias below 3,900; targets 3,380. Structural breakdowns and weaker fundamentals point to a medium-term retracement phase.
-------------------
Share your opinion in the comments and support the idea with a like. Thanks for your support!
ETHEREUM → Manipulation before a possible fall BINANCE:ETHUSDT , as part of manipulation and updating the local maximum to 4108, confirms strong resistance, forms a false breakout, and falls, testing key support.
Bitcoin, as part of yesterday's rally in the US trading session, is trying to turn the tide, but after encountering resistance at 113600, it forms a false breakout and sells off all the growth, which is generally a signal of readiness for a decline. This could have a negative impact on the entire market...
Ethereum is testing support - trigger 3822.5. After a sharp drop, there is no rebound, which indicates buyer weakness. Consolidation is forming near support, which only reinforces the pre-breakdown potential.
Resistance levels: 3963, 4030, 4090
Support levels: 3822, 3660, 3366
The classic implementation of the “liquidity hunt” scenario led to a rally to resistance, and a false breakout at 4090 led to heavy selling. As part of the current consolidation, the market is reducing volatility ahead of support, which only increases the chances of a breakdown. A close below 3822 could trigger a further decline. Key liquidity zones are 3658 - 3366.
Best regards, R. Linda!

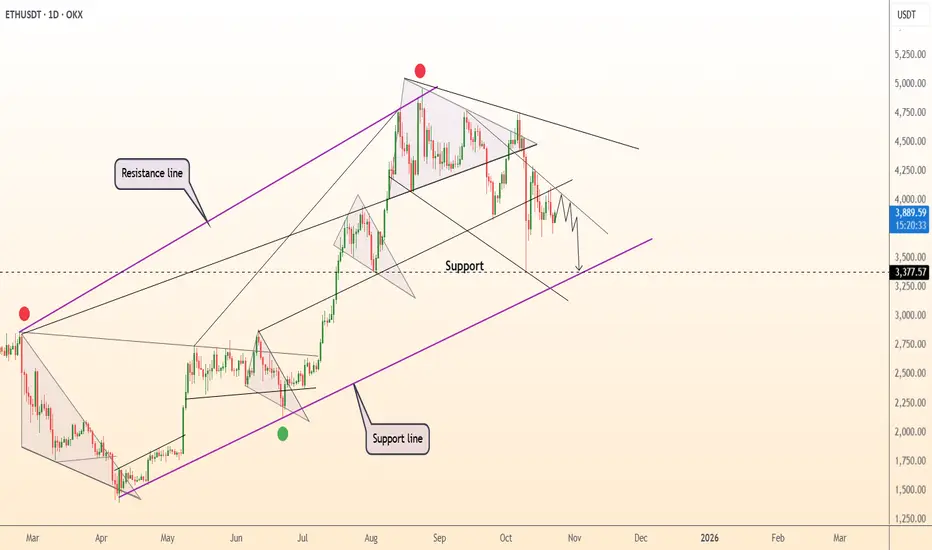
ETHUSDT – Sideways Trend with Clear Technical StructureETHUSDT is currently trading within a sideways range between $3,750 and $4,580. The support at $3,750 has been tested multiple times and remains strong, while the resistance at $4,580 continues to be tested but has not been broken yet.
Technical Analysis:
EMA34 and EMA89 are providing support from below, indicating that the long-term uptrend is still intact, although in the short term, the market is struggling to break through the current resistance levels.
The price is moving within a narrow range, creating a clear sideways trend. However, if the price cannot break $4,580, there is a possibility it will continue to trade within this range.
News:
Institutional inflows into ETH remain steady, supporting the long-term uptrend, although in the short term, the market lacks the momentum to break the resistance levels.
Macro factors like the U.S. CPI and expectations for Fed rate adjustments will impact the cryptocurrency market, but overall, ETH continues to maintain good stability within this range.


Defend that zone or drop furtherAnytime market tries to push up it always come back down
If ETH lose that zone we'll see further drop to like 3,500 or 3,400
Let's see what happens in the coming days
Hold the zone or lose the zone

ETH short?Salaam
ETH broke symmetrical triangle to the downside after down impulsive move, so I expect downside continuation.
For more confirmation watch today candle close below yesterday and below the triangle.
The projective target of the triangle is somewhere about 3100 - 3200.
Remember about risk management
Good luck

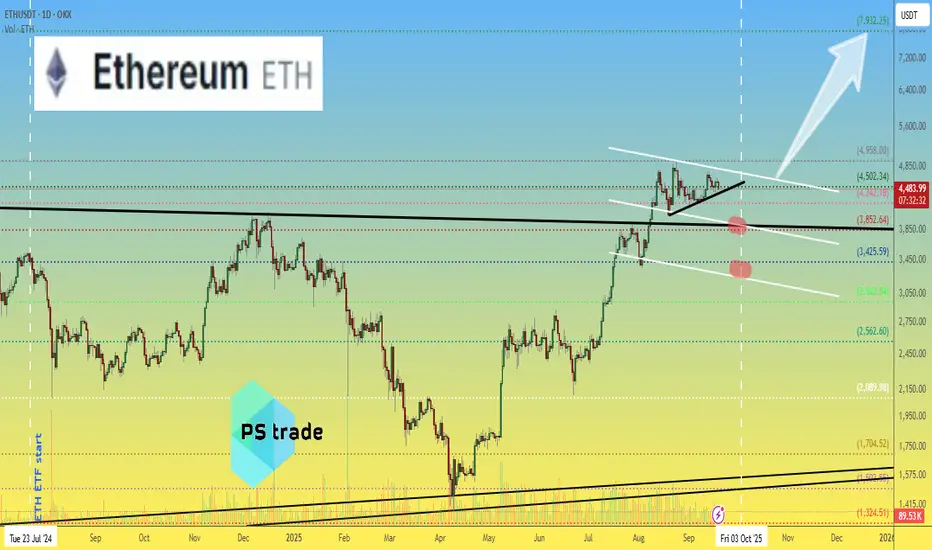
ETH/USDTCRYPTOCAP:ETH might revisit the $3370 zone one final time before it’s ready for liftoff. That level would serve as a strong higher low before the next leg up. Once momentum shifts, I’m expecting around a 115% move toward the $7200 target, a key breakout level on the chart.

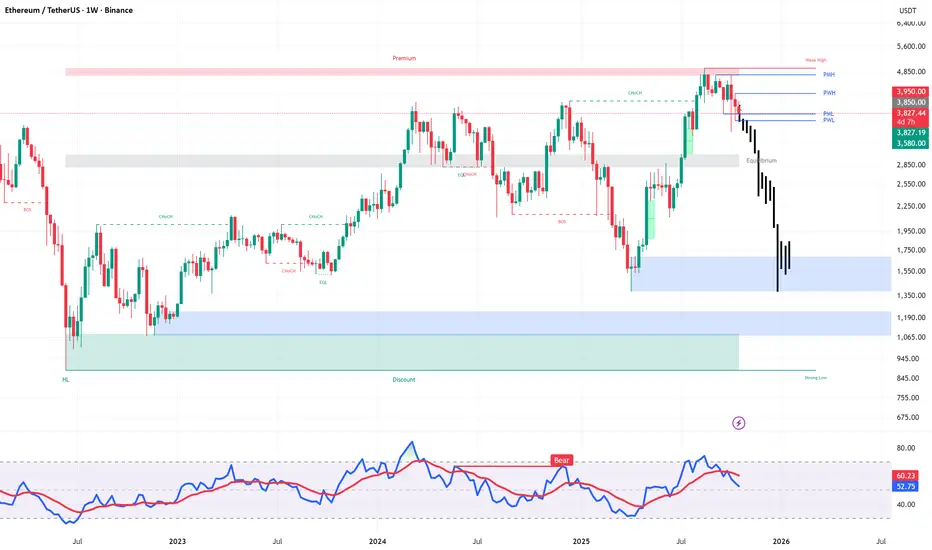
Ethereum (ETHUSDT) – Weekly AnalysisTrend: Bearish
Structure: Break of Structure confirmed – Redistribution Phase
Date: October 22, 2025
🧭 Technical Overview
Ethereum rejected from the premium zone (3,850–3,950) after forming a weak high.
The market confirmed a Break of Structure (BOS) below the previous weekly low and is now trading inside a discount zone.
The projected black path shows a possible move down toward 1,550–1,600, followed by a short-term rebound toward 2,200–2,400, before potential continuation of the downtrend — unless a clear structural shift occurs.
📊 Key Levels
Premium Supply Zone: 3,850–3,950 → strong resistance
Equilibrium: 2,700 → now acts as resistance
Discount Demand Zone: 1,450–1,600 → potential rebound area
Strong Low: 900 → break = long-term bearish continuation
⚙️ RSI & Momentum
RSI (Weekly) remains below 50 with a recent bearish crossover, confirming downward momentum.
No clear bullish divergence yet.
🧠 My Outlook
✅ Base Scenario (≈70%)
Price continues falling toward 1,550–1,600, reacts bullishly, and corrects to 2,200–2,400 before likely resuming the downtrend.
⚠️ Alternative Scenario (≈30%)
If 1,550 fails to hold, next key support lies around 1,180–1,250.
Bullish reversal only confirmed if weekly candle closes above 3,950.
📝 Summary
ETH is still bearish in the weekly structure.
I’ll look for liquidity sweeps or CHoCH signals near 1,550 to consider long positions.
Until then, selling rallies remains the preferred strategy.
#ETHUSDT #Ethereum #CryptoAnalysis #SmartMoneyConcepts #TechnicalAnalysis #PriceAction
🔹 تحلیل هفتگی اتریوم (ETHUSDT)
روند: نزولی
ساختار: تأیید شکست ساختار (BOS) – فاز بازتوزیع
تاریخ: ۲۲ اکتبر ۲۰۲۵
🧭 نمای کلی
اتریوم پس از برخورد به ناحیهی پریمیوم ۳۸۵۰ تا ۳۹۵۰ و تشکیل سقف ضعیف، وارد فاز نزولی شد.
بازار با شکست کف قبلی در تایم هفتگی (BOS) اکنون در محدودهی دیسکانت (Discount Zone) در حال نوسان است.
مسیر مشکی در چارت نشاندهندهی حرکت محتمل قیمت به سمت ۱۶۰۰–۱۵۵۰ دلار و سپس بازگشت موقت تا ناحیهی ۲۴۰۰–۲۲۰۰ دلار است، پیش از آنکه روند نزولی دوباره ادامه پیدا کند (مگر اینکه ساختار بهطور واضح تغییر کند).
📊 نواحی کلیدی
ناحیهی عرضه پریمیوم: ۳۹۵۰–۳۸۵۰ دلار (مقاومت قوی)
نقطهی تعادل (Equilibrium): حدود ۲۷۰۰ دلار (مقاومت جدید)
ناحیهی تقاضای دیسکانت: ۱۶۰۰–۱۴۵۰ دلار (احتمال واکنش صعودی)
کف قوی: ۹۰۰ دلار (در صورت شکست → نزول بلندمدت)
⚙️ مومنتوم و RSI
RSI هفتگی زیر سطح ۵۰ است و کراس نزولی داده؛ یعنی مومنتوم فروش هنوز فعال است.
در حال حاضر واگرایی صعودی خاصی دیده نمیشود.
🧠 چشمانداز
✅ سناریوی اصلی (احتمال ۷۰٪):
ادامهی نزول تا محدودهی ۱۵۵۰–۱۶۰۰ و سپس ریباند تا ۲۲۰۰–۲۴۰۰ دلار.
⚠️ سناریوی جایگزین (احتمال ۳۰٪):
در صورت شکست محدودهی ۱۵۵۰، تارگت بعدی ناحیهی ۱۲۵۰–۱۱۸۰ دلار است.
تغییر روند فقط با بستهشدن کندل هفتگی بالای ۳۹۵۰ تأیید میشود.
📝 جمعبندی
ساختار بلندمدت اتریوم همچنان نزولی است.
تا زمانی که نشانههای جذب نقدینگی یا CHoCH صعودی در محدودهی ۱۵۵۰ دیده نشود، استراتژی ترجیحی فروش در مقاومتهاست.
#اتریوم #تحلیل_تکنیکال #اسمارت_مانی #کریپتو #Ethereum #ETHUSDT
Ethereum ETH Price Outlook — Key Levels to WatchCRYPTOCAP:ETH continues to hold strong momentum, with OKX:ETHUSDT showing solid support.
A correction toward $3775–3850 would already be considered significant.
A deeper pullback into the $3250–3450 zone could offer attractive long-term entries.
With current conditions, further downside below this range looks less likely.
🤔 Do you expect #Ethereum to retest lower levels, or are we preparing for new highs?
______________
◆ Follow us ❤️ for daily crypto insights & updates!
🚀 Don’t miss out on important market moves
🧠 DYOR | This is not financial advice, just thinking out loud.
ETHUSDT – Bearish Continuation StructureEthereum #ETHUSDT – Bearish Continuation Structure
Current price: $3,827
Ethereum continues to trade within a descending channel, showing a clear pattern of lower highs and lower lows. The structure indicates potential for further downside extension before any meaningful recovery phase.
🧩 Technical Overview
• Price was rejected from the $4,120 resistance zone, confirming the upper boundary of the descending channel.
• The market failed to sustain above the $3,900 pivot and has since broken below the short-term trendline.
• Momentum remains weak, with sellers controlling the mid-term structure.
📉 Scenario
• The current move is likely part of a continuation correction, targeting deeper Fibonacci zones.
• Stop-loss: above $4,120, protecting against false breakouts.
• Downside zones to watch:
– $3,620–$3,440 — near 0.618 Fib / initial target area
– $3,260 — main support and prior reaction zone
– $2,900–$2,570 — extended targets aligning with 1.0–1.618 Fib projections
– $2,050–$2,000 — deep-cycle target (2.618 Fib extension)
• A break below $3,620 would confirm acceleration toward the lower targets.
⚙️ Market Context
• ETH underperforms BTC as capital rotation favors defensive positioning.
• Broader crypto sentiment remains cautious amid risk-off macro environment.
• The structure remains bearish unless ETH reclaims $3,900–$4,100 with strong momentum.
🧭 Summary
Ethereum is holding below key resistance and continues to follow a bearish channel structure.
Below $4,120, short-term bias remains downward, with focus on $3,440, $3,260, and $2,900 as successive support levels.
Reclaiming the $4,000 area would be the first sign of potential trend reversal — until then, the path of least resistance remains to the downside.
