3750$ support area worth the riskETH’s still cruising inside that downward trendline, and the 3.75K zone’s lookin’ like a solid reef of support 🧱 — price has bounced there multiple times, showing bulls are still guarding that level hard.
We’re seeing the market move sideways between 3.75K and 4K, kinda like it’s gathering energy for the next big wave 🌊. The structure still hasn’t gone fully bearish yet, but momentum’s definitely slowed down. If ETH can hold that 3.75K base and start building higher lows, we could see another solid ride up.
But if the bears push it under that line, it might dip deeper before catching the next set. Either way, 3.75K’s the key area to watch for your midterm long setups 🤙.
Trade ideas

ETH Tries to BounceEther tries to bounce back after the huge selloff. It might bounce to 50%-60% of the retreat. Don't forget to take your stop upward gradually if price go up as well.

ETHUSDT PREPARING THE STORM
Market Outlook: The "Coordinated Pivot" Thesis (Nov 1, 2025)
This analysis outlines a high-probability thesis for a major policy pivot that could spark a significant reflationary, risk-on rotation in the markets. The central forecast, with a 55-70% probability, is a coordinated move involving a pause on tariffs and a 50 basis point (bp) interest rate cut. This would act as a "green light" for risk assets.
Supporting Evidence & Observations
The outlook is supported by several recent market developments:
Technical Resistance: Gold was firmly rejected at the $2,450/oz level, which is consistent with historical resistance and typical behavior in a pre-reflation environment.
Yield Breakout: The U.S. 10-Year Treasury yield broke out from 4.55% to 4.68% between Oct 15-21. This move aligns more with the market repricing for growth rather than fearing a recession.
Institutional Flows: A spike in crypto trading volume on Oct 11 showed signatures of institutional-scale accumulation, a pattern seen in previous risk-on cycles.
The model also assumes that current tariffs are creating a drag on the economy (-0.5pp on GDP, -490k jobs) that policymakers will be motivated to reverse.
Scenarios & Probabilities
While the coordinated pivot is the base case, it's crucial to understand the alternative paths.
📈 Coordinated Pivot (55-70% Probability): A tariff pause plus a 50bp cut triggers synchronized relief.
Expected Impact: A weaker USD and a strong risk-on rotation into cyclical stocks, small caps, and high-yield credit. Safe havens like gold and long-duration Treasuries would underperform.
⚖️ Fed Fights Alone (20% Probability): The Fed cuts by 50bp, but there is no tariff pause, creating a policy mismatch and a stagflationary tilt.
Expected Impact: Commodities and TIPS would get a bid, along with quality defensive stocks. Trade-exposed cyclical assets would come under pressure.
📉 Policy Stalemate (10-15% Probability): No tariff pause and no significant rate cut leads to a high risk of a policy error and recession.
Expected Impact: A classic risk-off move where investors flee to Treasuries, the USD, gold, and defensive stocks.
Actionable Strategy & Key Triggers
The recommended approach is to begin pre-positioning for the base case while managing risk until confirmation.
Core Positioning: Start making incremental additions to cyclicals and high-yield (HY) credit. However, maintain hedges (USD, gold) until policy is officially confirmed.
Optionality: Use call spreads on small caps and industrials to capture upside, while using protective puts on major indices to hedge through the November event window.
Watch these triggers to confirm or invalidate the thesis:
✅ Bull Trigger: Explicit announcement of a tariff pause combined with guidance for a rate cut. This is the signal to fully commit to the risk-on stance.
⚠️ Neutral Trigger: A rate cut is announced, but there is no action on tariffs. This would require a reassessment of equity exposure.
❌ Bear Trigger: No rate cut is announced, and tariff rhetoric escalates. This is the signal to rotate fully into a risk-off, defensive posture.

ETH(20251022) market analysis and operationTechnical Analysis of the ETH Contract on October 22nd:
Today, the large-scale daily chart closed with a small negative candlestick pattern. The K-line pattern continued to decline, and the price remained at a low level. The accompanying indicator formed a downward death cross, and the overall downward trend is still very clear. Although the overall momentum is not strong at present and remains within the range, such a trend is easily affected by news or data, and a significant downward breakout is likely. Therefore, the short-term trading strategy of the high point remains unchanged. The short-term hourly chart showed downward pressure on the price in the early morning. The current K-line pattern continued during the Asian morning. The accompanying indicator formed a downward death cross and broke through the previous day's low. Therefore, today is a simple matter. Focus on the day and wait for a pullback correction in the European session before entering the market and selling directly. The strategy and timing are relatively clear, so please strictly follow it.

ETHCRYPTOCAP:ETH is setting up beautifully, building strong structure. I’m targeting $7200 as the next major level. A retest of $3400 is possible before liftoff, which would be a healthy reset. Ultimately, I believe ETH will break past $7200 and push toward $10K+ once consolidation completes.

New Indicator Released!🚀 New Indicator Released!
Dear followers,
The listed indicator is now available — it’s extremely useful for identifying market trend directions and momentum shifts.
Please like the script and add it to your chart to explore how it works.
If you have any questions, feel free to drop a comment — I’ll be happy to reply! 💬

ETH Consolidating Before the Next Move$ETH/USDT has been trading sideways for the past 74 days, holding strong at the confluence of the rising trendline and key support zone. This prolonged consolidation suggests that both buyers and sellers are in a state of equilibrium, waiting for a decisive move.
A breakout on either side could set the tone for the next major trend. If ETH manages to hold this support and gain momentum, we might see a strong recovery toward the upper resistance levels.
However, if it loses this zone, a deeper correction could follow before any significant upside move.
DYOR, NFA
PEACE


ETH - NEUTRAL, but bearish bias#ETHERUM - price update:
👉Monthly = bullish, if bulls stay above 3185$ |
Double top resistance Monthly around 4800$ (no breakout).
👉Weekly = Neutral area: 4200 | 3185$
👉Possible bearish retest daily completed under 4080$ ✅📉
My bias:
Consolidation phase (monthly).
Neutral area, lower support haven"t been tested yet. 📉
I expect to slee a slow correction toward 3200 - 3100$ to grab liquidities, before to see another potential leg up!
Under 4100$, bear may be in control.
A daily candle close above 4800$ is required to confirm bull breakout HTF.
Possible setup & important levels in my charts.

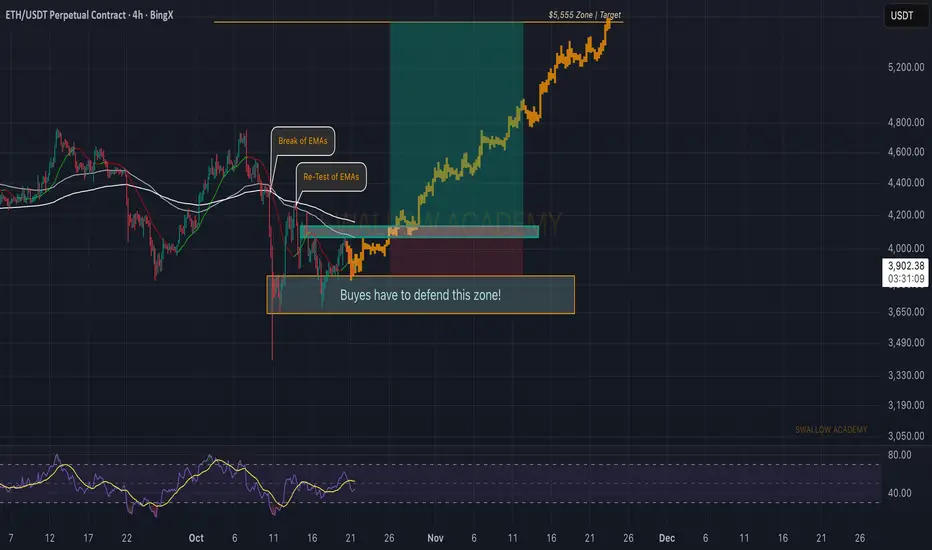
Ethereum (ETH): Buyers Have To Secure The EMAsETH needes to secure those lines of EMAs, after what we will be looking for some kind of entry but only after wee that buyers have fully secured that zone.
After those final confirmations, we would possibly be looking at a very good R:R trading setup with the target being a new ATH of $5555.
Swallow Academy
ETH Bottom $3825 Confirmed2025-10-21 4 Hour Chart
1). ETH broke out the downtrend line and topped at $4085
2). Nice pullback and confirmed bottom $3825

ETH-USDTThe trend line has broken well
This move can be considered a pullback to the broken line ✔️
And it will start to rise slowly towards 4300, maintaining the indicated support

ETH: Head and Shoulders Pattern Targets $3,800Hi Teams!
Ethereum has recently completed a head and shoulders formation. The neckline around $3,920 was broken decisively, confirming the pattern and triggering further downside momentum.
After the breakdown, the price slipped toward the lower boundary of the descending channel, finding temporary support near $3,860. A short-term corrective move is now unfolding, with ETH likely to retest the neckline zone and the upper boundary of the channel before facing renewed selling pressure.
As long as Ethereum trades below $3,920–$3,940, the bearish structure remains valid. A rejection from this area could accelerate the decline toward the target of the head and shoulders pattern, which aligns with the $3,800–$3,820 support zone.
However, a clear breakout above the descending trendline would invalidate this bearish outlook and could open the way for a recovery toward the $4,000–$4,050 resistance area.
Levels to Watch:
Resistance: $3,920 – $3,940 / $4,000 – $4,050
Support: $3,860 / $3,800 – $3,820
Bearish Target: Around $3,800 zone
Outlook: Bearish while below $3,920.

[SeoVereign] ETHEREUM BEARISH Outlook – October 21, 2025Hello everyone,
This idea is connected to the one shared on the 19th.
I am still holding the short position that was entered based on the October 19 idea, and since some of the underlying reasons have been slightly revised, I’m sharing this as an additional update.
Today, as of October 21, I would like to present my bearish (short) outlook on Ethereum.
Basis — BEARISH BAT PATTERN / WAVE5 = WAVE1 × 0.5
Ethereum is currently positioned near the PRZ (Potential Reversal Zone) of the Bearish Bat Pattern.
This pattern represents a typical retracement-based bearish reversal structure,
where the price tends to form a top around the 0.886 retracement level of XA before transitioning into a downward move.
In addition, within the wave structure, the ratio of WAVE5 = WAVE1 × 0.5 is being formed,
which is generally interpreted as an early termination zone of a short-term downward wave.
In other words, both pattern completion and ratio convergence are occurring simultaneously,
indicating that the current region provides a valid reversal signal from a bearish perspective.
Accordingly, I set the average target price around 3,756 USDT.
Depending on future chart developments,
I will continue to provide updates regarding position management and any changes.
Thank you.

ETHUSDT: Breaks Through FVG Zone – Can It Push Beyond 4,200?Hello everyone,
Ethereum is showing a convincing recovery after the recent sharp decline from the 4,400–4,500 region. On the H4 timeframe, price formed a short-term bottom near 3,780 before bouncing, maintaining a Higher Low structure – a signal that buyers have begun to regain partial control of market momentum. More importantly, ETH has just broken through the final Fair Value Gap of the previous downtrend and is now approaching the key resistance zone at 4,100–4,200 – which aligns with the upper boundary of the Ichimoku Kumo and a significant historical supply zone. This will be a decisive region to determine whether the ongoing move is merely a pullback or the beginning of a new bullish leg toward 4,300–4,350 or even 4,420 where another unfilled FVG remains.
On the macro side, current sentiment slightly favours the bulls. US bond yields have cooled off, putting pressure on the Dollar and allowing capital to rotate back into risk assets like crypto. The market is also pricing in a 70% probability of a Fed rate cut in December 2025, reducing the opportunity cost of holding non-yielding assets such as gold and Ethereum. Adding to that, Ethereum Spot ETF approval is entering its final review phase, raising expectations of institutional inflows – similar to the effect seen with Bitcoin previously.
However, I remain cautiously optimistic as the upside bias has yet to be confirmed without a decisive candle close above 4,200. This area may trigger short-term profit-taking. If ETH faces rejection here, a pullback to 4,000–4,050 would be considered healthy, and a deeper correction towards 3,880–3,820 (bullish FVG + previous structure support) is also possible before bulls accumulate enough liquidity for the next leg.
Do you think ETH breaks 4,200 from here – or one more liquidity sweep before launch?

Just a POV about ETH , what do you guys think ?BINANCE:BTCUSDT.P It's just my simple analysis for ETH ,
I mean , it's just following it perfectly i guess!

Ethereum — Losing the PremiumThe Ethereum future’s chart is showing weakness, and I’m expecting a drop toward the $3,760 area from current levels.
Scenario invalidation — the zone is marked on the chart at $4,041

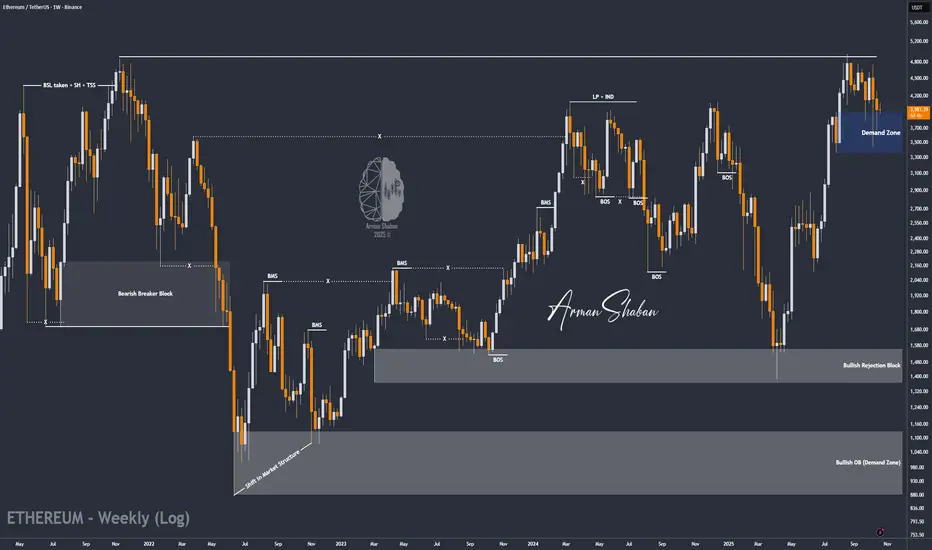
ETH/USDT | ETH Update – Waiting for Confirmation Above $4K!By analyzing the #Ethereum chart on the weekly timeframe, we can see that price has been consolidating around the $4,000 level after a sharp recovery from the $3,400 demand zone. This sideways movement shows ongoing accumulation, but a clear breakout and close above $4,000 is still needed to confirm renewed bullish momentum.
As long as ETH holds above the $3,900–$4,000 support range, the broader bullish outlook remains valid. The next upside targets are $4,950, $5,500, and $6,000 , but continuation strongly depends on Bitcoin’s ability to stay above $112K .
In short — ETH is gearing up for its next move, but the key lies in a confirmed breakout above $4K with BTC providing stability.
Please support me with your likes and comments to motivate me to share more analysis with you and share your opinion about the possible trend of this chart with me !
Best Regards , Arman Shaban

#ETHUSDT 4H ChartPrice traded into the 12h demand zone where it bounced from and it is currently still getting rejected off the 200MA. MACD is showing some bullish weakness, RSI and EMAs are neutral. Price needs to break above both the 100MA and the 200MA to expect further bullish movements towards the 12h supply zone at $4,450.

ETH 6K to 8K !? My analysis atm for ETH
Possible to bounce right back to ATH and price discovery mode to 6K hopefully 8K+
What ya all think, drop it bellow ?

Ethereum | Long | 3 hrs | Target: 4220This technical analysis is for informational and educational purposes only. It does not constitute financial advice. Remember to always research and consult with a professional before making investment decisions. Good luck! 📈💼🚀

ETH analysis 20 oct 2025if today 20 oct 2025 daily close we can stand the price above 4000, possibly we can continue rally up
