ETH-----Sell around 4035, target 3960 areaETH Contract Technical Analysis (October 29th):
On the daily chart, yesterday's close was a small bearish candle, indicating a consecutive decline. The price is still within a range, and the accompanying indicators show a golden cross with decreasing volume. The overall trend remains bullish, but the price is currently in a range-bound movement. However, attention should be paid to data releases and news-driven stimuli. On the hourly chart, the price faced downward pressure during the US session, but rebounded from early support this morning. The current candlestick pattern shows a consecutive bullish reversal, while the accompanying indicators show a bearish cross with decreasing volume. However, the four-hour chart shows significant price suppression, with resistance around the 4035 area.
Today's ETH Short-Term Contract Trading Strategy:
Sell at the 4035 area, stop loss at the 4070 area, target 3960 area;
Trade ideas

ETHUSDT-LONG IDEAETHUSDT has broken its trendline toward upside and formed the first internal higher high the retracement to 0.5 fib is done. The overall market structure is bullish So mark your buy stop order here at the given point. do your own research before taking any trade.

ETHUSDT.P - October 28, 2025Price has broken the short-term descending trendline, showing early bullish momentum towards the profit level 4228.35, with the stop level at 4061.07 and breakeven adjustment at 4148.53. Given the wide stop distance relative to recent volatility, this is a medium-risk setup.

ETH movement according to planOn October 26, Ethereum showed a clear upward movement on the 4-hour chart from the 4043.78 level. I entered on the next candle after confirmation and gradually closed positions at three profit-taking levels. I distributed the deposit across these zones and collected around 5 percent profit with 1.5x leverage.
The key is not greed but structure. Thanks to a secret proprietary strategy, it was possible to clearly see the levels and avoid emotional reactions. Many traders at that moment tried to chase the market, entering too late, but precise calculations and visualized levels allowed me to act calmly and without haste.
I often notice that even experienced traders make mistakes by ignoring their plan and technical references. But discipline is what separates chaotic trading from a system. Each level was predetermined, and the price moved exactly according to the calculations.

ETH heavy pump ahead after major daily breakoutEthereum (ETH) is approaching a critical technical juncture as it tests a key descending trendline. A decisive breakout above this trendline, confirmed by a sustained close and supported by high trading volume, would signal a potential reversal of the recent bearish momentum.
Such a confirmed breakout is often followed by a significant bullish impulse. The initial phase of this move would likely be characterized by strong, high-volume bullish candles, indicating robust buyer conviction.
Based on classical technical analysis principles, and specifically using measured move projections from the prior consolidation range, the initial upside target following a successful breakout is projected toward the $5,500 level. This represents a significant resistance zone and a logical first objective for a new bullish phase.
DISCLAIMER: ((trade based on your own decision))
<<press like👍 if you enjoy💚

It looks like the market is about to move in a continuation trenIt seems the economy may not undergo a “bubble reset” anytime soon. If that’s the case, the value of money will continue to depreciate, making investment channels such as stocks and cryptocurrencies increasingly attractive to investors. Although the core purpose of crypto is to promote balance and decentralization, when ownership becomes concentrated in the hands of a small group or a single entity, it exposes a structural weakness in the digital asset market — particularly for BTC and ETH.

ETH bullish flag pattern ETH bullish flag pattern aligns with a third-wave structure suggesting upside if support holds healthy consolidation
ETH has formed a bullish flag pattern, and the movement is parallel to the third Elliott wave of the wave analysis. The news background is neutral
Current price: $4,137
According to the pattern, the upward movement could soon reach $4,200 , $4,250 , and highter...
If the price declines and reaches $4,070 , the movement will continue in a downward corridor, and the pattern will not form anytime soon

Long biasAll indications Say that ETH/USDT is going up , at least to 5000 USDT ,
we have VOLUME and a PULLBACK to a récent key level plus the general BULLISH TREND .

Ethereum Correction: Key Support at 200 SMA & TrendlineLast week, Ethereum moved according to our orange scenario.
At the moment, the price is in a local downward correction. The weekly pivot point is at 4,015 — if it breaks, we’ll need to see a bounce from the 200 SMA and a quick recovery above the reversal level. Otherwise, the chances increase for a move toward the trendline.

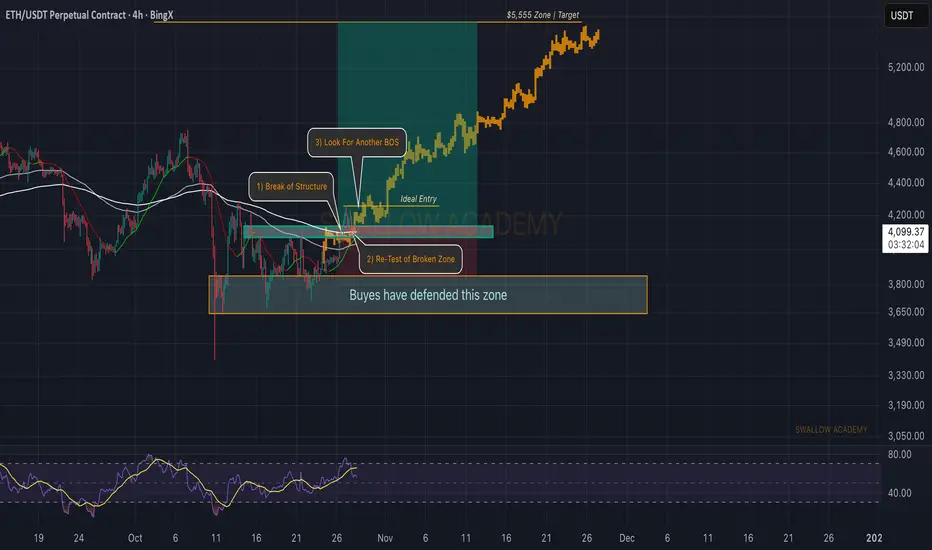
Ethereum (ETH): Last Step For Perfect Entry | Wait For Last BOSOne of the best setups that has been working for us is BOS/Re-Test/BOS, where ETH is at the last stage to potentially give us an ideal entry for a long position.
The game plan is simple: we wait for BOS to form; once we get that, we are going to target the current ATH area near $4900 and then a new ATH, which we have been aiming for, of $5555.
Swallow Academy
ETH Daily Technical Overview — Cycle & Box AnalysisCycle Structure:
HWC (Higher Wave Cycle – Long-Term): Bullish 🔼
MWC (Middle Wave Cycle – Mid-Term): Range 🔁
LWC (Lower Wave Cycle – Short-Term): Bearish 🔽
Market Context:
The first step is to assess the market from a cycle and wave perspective 🧐. Recent sharp down moves are ignored as they are emotional reactions.
The current support is a box 📦 that has been tested for around 35 days with four significant touches. My bias is long here 🚀.
Long Setup:
Weakness in the short-term MWC 🔁 could trigger a bullish move if 4232 resistance is broken and confirmed ✅.
The next resistance at 4757 🚧 could turn all cycles bullish 🔼🔼🔼 if broken, offering strong upside potential 📈.
Short Consideration:
The market is unpredictable ⚠️, so short scenarios should be considered too.
Until price reaches 3708 ⬇️, I won’t consider shorts ❌.
Shorts require more structure and confirmation.
Remember, downside moves are still possible ⚡, so risk management is key 🛡️.
📌 Signature:
If you want a specific coin analyzed, drop a comment 💬👇 and I’ll cover it.
⚠️ Without proper risk management, you're just a ticking time bomb 💣

Ethereum (ETH/USDT): Possible Short OpportunityHi guys!
ETH is currently testing the ascending trendline support after forming a potential lower high near the $4,165 zone. The structure shows early signs of weakness as buyers failed to maintain momentum above the last swing top.
A clean break below the trendline could confirm a short-term bearish shift, targeting the $4,030–$4,000 support zone, which aligns with the previous breakout level. The invalidation of this setup would occur if the price breaks and holds above $4,165, signaling renewed bullish momentum.
important levels:
Resistance: $4,165
Support: $4,030 – $4,000
Bias: Bearish below $4,165

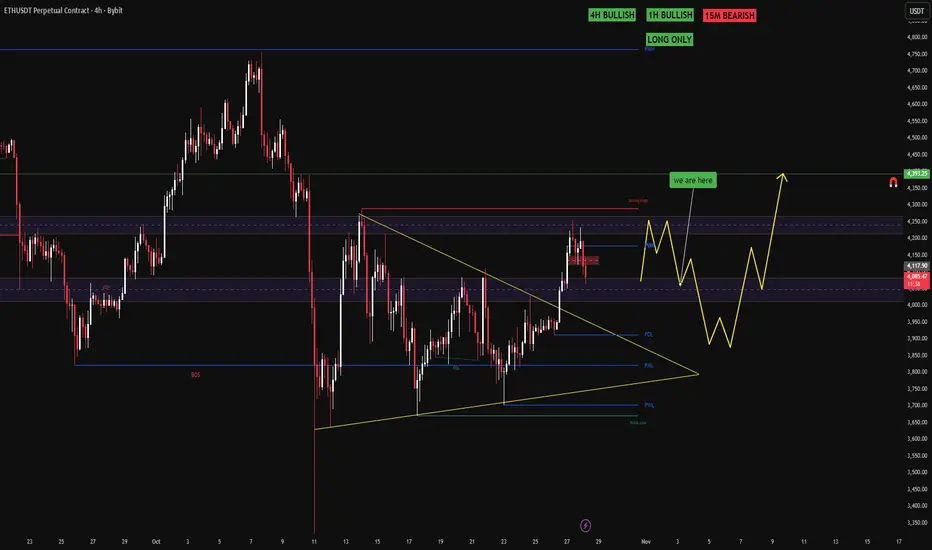
ETH Analysis (4H)After the heavy dump on altcoins, the market is still quite volatile. However, after several days and weeks of ranging, it’s gradually returning to normal and becoming more predictable for analysis.
Ethereum has formed a reversal pattern at the bottom and has made three higher lows. It’s expected to move toward the red zone while holding the green area, and then get rejected toward lower levels.
The best area for a long buy is the green box, and the best area for a short sell is the red box.
Let’s wait and see what happens next.
For risk management, please don't forget stop loss and capital management
When we reach the first target, save some profit and then change the stop to entry
Comment if you have any questions
Thank You

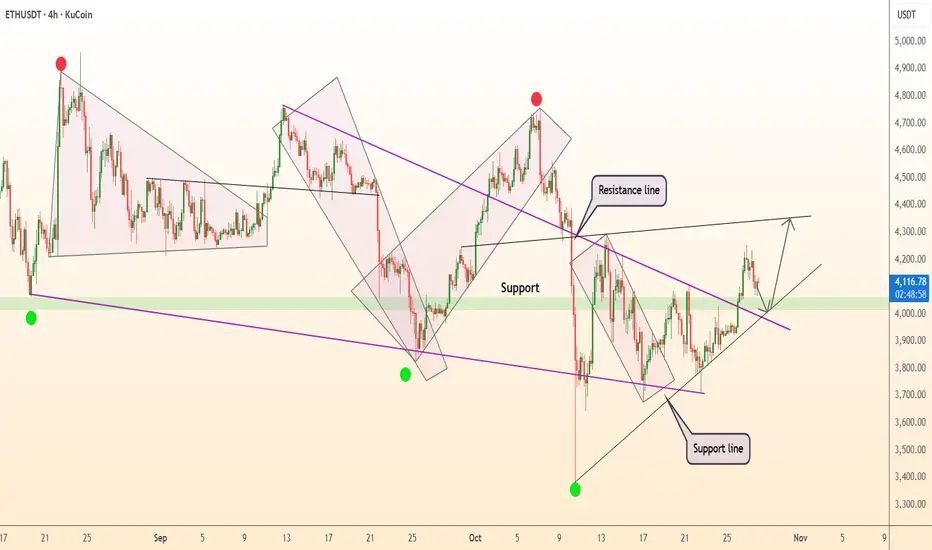
DeGRAM | ETHUSD is above the support area📊 Technical Analysis
● ETH/USD broke above its descending resistance line and retested the 4,000 support zone, confirming a breakout from a medium-term accumulation structure.
● The price now targets 4,300 as the next resistance, with ascending channel dynamics supporting continued bullish momentum.
💡 Fundamental Analysis
● Ethereum gains traction amid rising DeFi activity and institutional accumulation, while stable macro sentiment boosts broader crypto risk appetite.
✨ Summary
● Long bias above 4,000; targets 4,300. Breakout confirmation and improving fundamentals support medium-term upside.
-------------------
Share your opinion in the comments and support the idea with a like. Thanks for your support!
ETH-USDTSee the dot in Ethereum
Exactly 4050 as I said stopped the decline 💰👀
If it manages to break 4300, Ethereum and altcoins will enter a new bullish phase✔️🚀


Ethereum could make a new ATH if the price could hold above Ethereum could make a new ATH if the price could hold above this significant and major support level however in LTF there could be some liquidation to the lower price its just good for healthy market by end of Q4 2025 - Q1 2026 we could get the peak alt season as well
ETHEREUM climbing up slow and steadyETH is slowly breaking above resistance levels. However, the hard work is not over. As ETH tries to reclaim its range, it's important that the bull maintain momentum. Volume is a factor in with current price action. Without volume back PA, it will be difficult to sustain the bullish move.

Will Ethereum’s Market Flow Signal a New Bullish Phase?🎯 ETH/USD: The "Thief Strategy" Blueprint | Layer Your Way to Victory! 💰
📊 Market Overview
Asset: ETH/USD (Ethereum vs US Dollar)
Market: Crypto
Trade Type: Swing Trade
Bias: Bullish (Post-Breakout Setup)
🎭 The Thief's Master Plan
Ladies and gentlemen, gather 'round! 🎩 We're not just trading here—we're executing the legendary "Thief Strategy" where we sneak into multiple price levels like a professional heist crew. No single entry point for us, oh no. We layer up, diversify risk, and wait for the vault to open! 💎
🚀 Entry Strategy: The Layering Technique
Primary Entry Zone: Any price level AFTER a confirmed breakout above $4,200 ✅
The Thief's Layering Method (Multiple Limit Orders):
🥇 Layer 1: $3,900
🥈 Layer 2: $4,000
🥉 Layer 3: $4,100
🏆 Layer 4: $4,200
Pro Tip: Feel free to add more layers based on your capital allocation and risk appetite. The more layers, the smoother your average entry price! Think of it as building a ladder to success.
🛑 Stop Loss: Protect Your Treasure
Thief's Stop Loss: $3,700 🚨
⚠️ Important Disclaimer:
Dear Ladies & Gentlemen (Thief OG's), I'm NOT recommending you blindly follow my stop loss. This is MY risk tolerance. You need to assess YOUR own risk management strategy. Set your stop loss according to your capital size, risk appetite, and sleep-at-night comfort level. Remember: Your money, your rules! 💼
🎯 Take Profit Target: Know When to Exit the Heist
Primary Target: $4,600 🎰
Why This Level?
📈 Moving Average acting as a strong resistance zone (think of it as the police barricade!)
🔴 Overbought conditions on technical indicators
⚠️ Bull trap zone — smart money might be waiting to distribute here
Exit Strategy:
When you see the moving average resistance + overbought signals flashing, it's time to take your profits and vanish into the night! 🌙
⚠️ Important Disclaimer:
Dear Ladies & Gentlemen (Thief OG's), I'm NOT recommending you blindly follow my take profit level. This is MY analysis. Scale out profits at levels that make sense for YOUR trading plan. Partial profits, trailing stops, whatever works for YOU. Make money, then TAKE money—at your own discretion! 💵
🔗 Related Pairs to Watch
Keep an eye on these correlated assets to confirm the broader market direction:
BITSTAMP: BITSTAMP:BTCUSD — The king of crypto. When Bitcoin moves, ETH usually follows. Watch for BTC breakouts above resistance.
BINANCE: BINANCE:ETHBTC — Shows ETH's relative strength against Bitcoin. Rising = ETH outperformance.
TVC: TVC:DXY (US Dollar Index) — Inverse correlation. Weaker dollar = stronger crypto typically.
Total Crypto Market Cap — Confirms if capital is flowing INTO or OUT OF the crypto space.
COINBASE: COINBASE:SOLUSD , COINBASE: COINBASE:ADAUSD — Other major altcoins. If they're pumping too, it confirms alt season momentum.
Key Correlation Point: If Bitcoin is breaking resistance zones and the Dollar Index (DXY) is weakening, our ETH setup gets significantly stronger! 📊✨
🧠 Technical Analysis Breakdown
What We're Watching:
✅ Breakout Confirmation: Price must close above $4,200 with volume
✅ Support Levels: $3,900-$4,100 range acts as accumulation zone
✅ Resistance Zone: $4,600 where moving averages + overbought conditions converge
✅ Risk-Reward Ratio: Solid setup with layered entries minimizing average cost basis
The Thief Strategy Philosophy:
Instead of gambling on ONE entry point, we spread our risk across multiple price levels. This way, we're dollar-cost-averaging into the position BEFORE the breakout confirmation, positioning ourselves ahead of the crowd! 🎯
🎬 Final Words from the Thief
Remember, OG's: The best trades are the ones where you're positioned BEFORE the crowd rushes in. Layer your entries, manage your risk like a professional, and know when to take your profits and disappear! 👻
Stay disciplined, stay profitable, and let's make this heist a success! 🏆
✨ If you find value in my analysis, a 👍 and 🚀 boost is much appreciated — it helps me share more setups with the community!
#ETHUSD #Ethereum #CryptoTrading #SwingTrade #ThiefStrategy #LayeringStrategy #CryptoAnalysis #TechnicalAnalysis #TradingView #CryptoSetup #AltcoinSeason #ETHBreakout #RiskManagement #TradingStrategy #CryptoIdeas

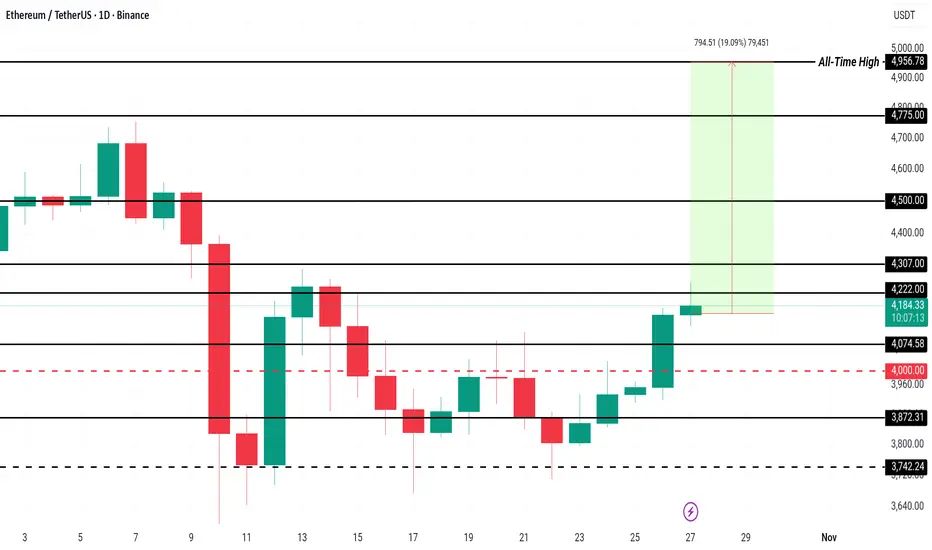
3 Altcoins That Could Hit All-Time Highs In November 2025Ethereum is trading at $4,156, holding firmly above the $4,000 support while facing resistance at $4,221. The altcoin king's recent consolidation reflects cautious optimism among traders.
To reach its all-time high of $4,956, Ethereum needs a 19% price increase. This requires breaking through resistances at $4,221 and $4,500. The Relative Strength Index (RSI) indicates strengthening bullish momentum, suggesting buyers are regaining control and could drive ETH higher.
However, if selling pressure intensifies, Ethereum could fall below $4,000 and target $3,872 or even $3,742. Such a decline would signal weakening demand and invalidate the bullish outlook.
Second Leg Incoming? Ethereum Needs Volume.👋🏻 Hey everyone! Hope you’re doing great! Welcome to SatoshiFrame channel.
✨ Today we’re diving into the 4-Hour Ethereum analysis. Stay tuned and follow along.
👀 Looking at Ethereum on the 4-hour timeframe, we can see that just like Bitcoin, Ethereum began a strong bullish leg yesterday, breaking several of its multi-timeframe resistances. With this price jump, it has now reached its resistance area at $4,252. Keep in mind that the market may take a short rest at this level, and price may experience a brief pullback to the downside.
🧮 The RSI oscillator is currently exiting the OverBuy zone, which is a sign that a multi-timeframe correction may begin for Ethereum.
🕯 During this bullish leg, Ethereum’s volume has increased slightly. However, since sell orders have been lower than before, this volume increase does not appear very strong on the 4-hour chart. Therefore, if Ethereum intends to form its second bullish leg upward, we will likely need to see a more noticeable increase in buying volume.
✍️ The scenario ahead for Ethereum, like Bitcoin, is independent of any trade or position, and it simply helps us better understand Ethereum’s corrective price behavior.
🛡 Ethereum, similar to Bitcoin, is entering a price resting phase. This rest can extend down toward support levels, and if a stronger bullish continuation wants to form, we may see a reversal reaction near these zones. If such a move occurs, the analysis and scenarios will be updated for you.
❤️ Disclaimer : This analysis is purely based on my personal opinion and I only trade if the stated triggers are activated .

Ethereum Shows Weakness at 0.618 Level — Lower High FormationEthereum’s price action is displaying significant weakness around the 0.618 Fibonacci retracement level, currently situated near $4,114. This region has repeatedly acted as a rejection zone, highlighting the lack of sustained bullish momentum in the current market structure.
If continual rejections persist at this level, the probability of a deeper corrective move increases, with the next major support target lying around $2,400. The broader structural framework remains bearish, as Ethereum continues to form lower lows on higher timeframes — a classic signal of downtrend continuation.
Key Points:
- Critical Resistance: The 0.618 Fibonacci level at $4,114 remains a key rejection zone.
- Bearish Structure: Ongoing lower lows suggest sustained weakness in market structure.
- Downside Target: Potential corrective move could extend toward $2,400 support.
From a technical perspective, this region can act as a lower high projection unless Ethereum decisively reclaims the $4,800 level. Until such a breakout occurs, the bias remains to the downside.
What to Expect:
As long as ETH fails to close above $4,114, bearish pressure will likely persist. A continued rejection here opens the door for a retracement toward $2,400, reinforcing the broader corrective outlook.

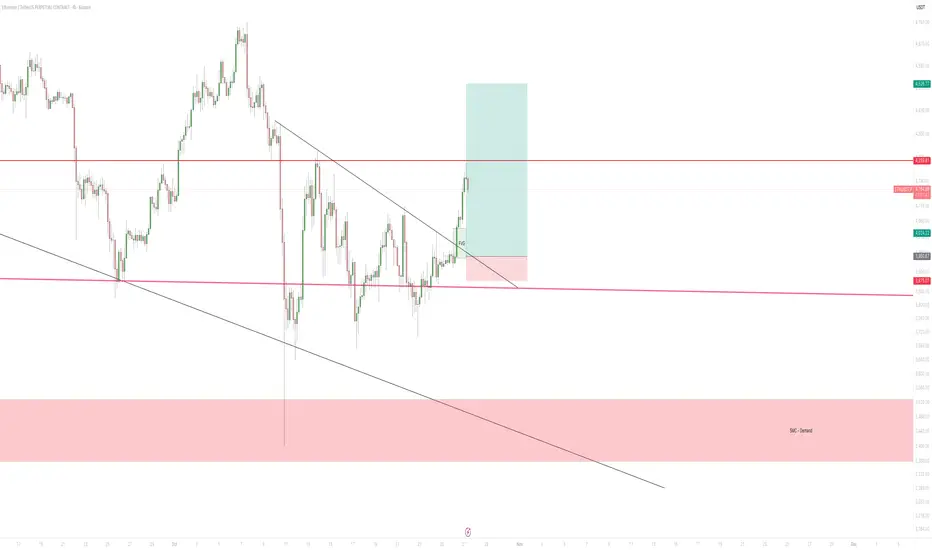
ETH - BreakoutpatternThis chart shows a clear breakout from a descending trendline, indicating a potential shift from bearish to bullish momentum. The market had previously been in a downtrend, forming a series of lower highs and lower lows, but price has now broken above that structure. After the breakout, there’s a slight pullback toward the former resistance area, which is now acting as support. This zone also aligns with a Fair Value Gap (FVG), suggesting a short-term demand area where buyers might step in to defend price.
Currently, price is consolidating just above that zone, which often happens during a retest phase before a possible continuation move higher. The upper red line represents a key resistance level, marking a logical take-profit zone based on previous structure highs. The larger red box below the chart shows a major demand zone, which would act as strong support if price were to fall back into that area.
The trade setup displayed on the chart is a long position with a favorable risk-to-reward ratio — entry after the breakout and retest, stop loss below the FVG and trendline area, and target near the upper resistance zone. As long as price remains above the retested breakout zone, the bias stays bullish and a continuation toward higher levels is likely. However, if the market closes back below the broken trendline or dips into the deeper red demand zone, it would invalidate the bullish scenario and signal renewed bearish pressure.
In short, the chart illustrates a bullish breakout and retest pattern with potential for continuation, but with clear invalidation levels defined below the current structure.