ETHEREUM ETHUSDT WEEKLY PERSPECTIVE ETHEREUM TECHNICAL INFORMATION.
THE WEEKLY TIME FRAME SHOWS THAT BUYERS REJECTED THE 4998-5000 ZONE AND IT BECOMES OUR NEW BUY LIMUS TEST IN THE FUTURE.THE BREAK AND COSE OF A WEEKLY CANDLE WILL CALL FOR 15MIN SCALP IN SEARCH OF POINT OF ENTRY TO AIM 6000-7000$ IN PROFIT.
THE CURRENT REALITY WITH ETHEREUM SHOWS LACK OF BIUY MOMENTUM AND ITS EVIDENT FROM THE BREAK AND RETEST OF 4200 LEVEL ON WEEKLY TIME FRAME ON THE CHART ,THIS REACTION IS DETAILED ON THE CHART FOR REFERENCE.
THE SELL CONFIRMATION WILL COME FROM THE WEEKLY BREAK AND CLOSE 3780 AND MY SELL TARGET WILL BE 3116$ DEMAND FLOOR AND ALSO 50% FIB LEVEL
TARGET 2 WILL BE 2727.8 DEMAND FLOOR
AND PRICE COULD GO LOWER BEYOUND THIS ZONE ON BEARISH SENTIMENT AND PROLONGED TAKE PROFIT,
ETHEREUM IN CONTEXT
Ethereum remains the second-largest cryptocurrency by market capitalization and continues to be a foundational platform for decentralized finance (DeFi), smart contracts, and tokenized assets.
Ethereum 2025 Overview and Outlook
Ecosystem Growth: Ethereum’s ecosystem is expanding with over 127 million active wallets and total value locked (TVL) in DeFi protocols reaching about $96.86 billion, a 50% increase since mid-2025.
Technology Upgrades: Recent upgrades like Pectra and Fusaka, along with Layer 2 solutions such as Arbitrum, improve scalability, reduce fees, and enhance user experience.
Macro and Regulatory: Institutional inflows via Ethereum ETFs total nearly $24.7 billion, supported by gradual regulatory clarity.
Price Forecast: Despite short-term volatility, Ethereum shows strong fundamental on structure and rally.
Summary
Ethereum remains a dominant blockchain platform with robust adoption and technical advancements, supporting a positive price outlook .currently, with potential to rally toward $5000-6000k if they break and close weekly resistance at 4200
the ecosystem growth, institutional participation, and network upgrades will be its bullish catalyst
.
Trade ideas

ETHEREUM ETHUSDTETHEREUM TECHNICAL INFORMATION.
THE WEEKLY TIME FRAME SHOWS THAT BUYERS REJECTED THE 4998-5000 ZONE AND IT BECOMES OUR NEW BUY LIMUS TEST IN THE FUTURE.THE BREAK AND COSE OF A WEEKLY CANDLE WILL CALL FOR 15MIN SCALP IN SEARCH OF POINT OF ENTRY TO AIM 6000-7000$ IN PROFIT.
THE CURRENT REALITY WITH ETHEREUM SHOWS LACK OF BIUY MOMENTUM AND ITS EVIDENT FROM THE BREAK AND RETEST OF 4200 LEVEL ON WEEKLY TIME FRAME ON THE CHART ,THIS REACTION IS DETAILED ON THE CHART FOR REFERENCE.
THE SELL CONFIRMATION WILL COME FROM THE WEEKLY BREAK AND CLOSE 3780 AND MY SELL TARGET WILL BE 3116$ DEMAND FLOOR AND ALSO 50% FIB LEVEL
TARGET 2 WILL BE 2727.8 DEMAND FLOOR
AND PRICE COULD GO LOWER BEYOUND THIS ZONE ON BEARISH SENTIMENT AND PROLONGED TAKE PROFIT,
ETHEREUM IN CONTEXT
Ethereum remains the second-largest cryptocurrency by market capitalization and continues to be a foundational platform for decentralized finance (DeFi), smart contracts, and tokenized assets.
Ethereum 2025 Overview and Outlook
Ecosystem Growth: Ethereum’s ecosystem is expanding with over 127 million active wallets and total value locked (TVL) in DeFi protocols reaching about $96.86 billion, a 50% increase since mid-2025.
Technology Upgrades: Recent upgrades like Pectra and Fusaka, along with Layer 2 solutions such as Arbitrum, improve scalability, reduce fees, and enhance user experience.
Macro and Regulatory: Institutional inflows via Ethereum ETFs total nearly $24.7 billion, supported by gradual regulatory clarity.
Price Forecast: Despite short-term volatility, Ethereum shows strong fundamental on structure and rally.
Summary
Ethereum remains a dominant blockchain platform with robust adoption and technical advancements, supporting a positive price outlook .currently, with potential to rally toward $5000-6000k if they break and close weekly resistance at 4200
the ecosystem growth, institutional participation, and network upgrades will be its bullish catalyst
.
#ethusd #ethereum

Ethereum weakened or holding structure? | ETH 1H Analysis👋🏻 Hey everyone! Hope you’re doing great! Welcome to SatoshiFrame channel.
✨ Today we’re diving into the 1-Hour Ethereum analysis. Stay tuned and follow along.
👀 We observe Ethereum on the 1-hour timeframe. After breaking and stabilizing at the $3,889 zone, Ethereum formed a higher low on this area and is now moving along a trendline (dynamic support), with an important static resistance at $3,982.50. Price has reacted to this level once but has not succeeded in breaking it!!!
🧮 Using the RSI oscillator is a reasonable approach in this situation. Since Ethereum is currently in a box/trading range, a breakout requires entering overbuy territory and surpassing the 70 level. Note that there is a significant oscillation support below the average, at the 44.5 zone, which holds strong validity and represents our swing low.
🐷 Pay attention to Ethereum’s volume. To break the specified zone, Ethereum needs to show a strong reaction, fill sell orders, and liquidate futures contracts. Therefore, we need buyer market makers to support the breakout, causing volume to increase through a price jump.
✍️ The scenario forming for Ethereum may require some patience and could play out differently, because we are now facing the second touch of this level, so the win rate of this scenario may be slightly lower.
🟢 Long Position Scenario
Breaking Ethereum’s resistance at $3,982.50 along with surpassing the 70 RSI level and seeing a significant increase in buying volume and price squeeze can form a good long position scenario on Ethereum.
❤️ Disclaimer : This analysis is purely based on my personal opinion and I only trade if the stated triggers are activated .

High RR...Don't need to be right often - Q the flash dump - A braindead trade regardless of bias - fib targets plotted - if 1.618 busts assume it's a larger correction.

more optimistic cycle topbased on historic data and patterns, a potential -more optimistic- cycle top at price range of 9.5-9.8k USD.

ETHUSDTBINANCE:ETHUSDT have a amazing trend because this is second the best crypto an head of all project so is in watchlist of best traders.
Support for buy: 3750$
Resistance for targets: 4045 - 4200 - 4435 - 4755
Please your risk management.

Possible Ethereum Scenario in the Week AheadPossible Ethereum Scenario in the Week Ahead
Possible Ethereum Scenario in the Week Ahead Given the price of Bitcoin, which doesn't seem very interesting, you should monitor the movement and volatility of Bitcoin.

ETH Eyes Upside RunEthereum shows signs of regaining strength after a prolonged corrective phase. The asset is currently stabilizing, supported by gradual inflows from institutional participants and renewed investor accumulation. Market behavior indicates controlled volatility, suggesting a preparation phase before a potential expansion.
Network data reflects consistent transaction activity, while liquidity concentration hints at sustained participation from long-term holders. The recent stabilization in funding rates and improved open interest add weight to the recovery outlook.
If momentum continues to build under these conditions, Ethereum could enter a structured growth cycle in the coming sessions.

ETHEREUM to $3300 #ETH is so cooked
Descending triangle. This is a textbook classic pattern
If it closes bellow $3700, then it should drop to $3300

Ethereum Sees Major Sell-Off as Price Fails to Break $4,000Ethereum’s price sits at $3,950 at the time of writing, stuck below the critical $4,000 resistance. The altcoin has been oscillating near $3,872, showing no clear directional bias.
The current indicators suggest that this consolidation phase above $3,742 support is likely to persist. However, if market conditions worsen and ETH slips below $3,742, a further decline toward $3,489 could follow. Such a move would confirm a bearish continuation pattern.
Conversely, if buying activity strengthens and overall sentiment improves, Ethereum could breach the $4,000 resistance level. A successful breakout would open the path toward $4,221, invalidating the bearish outlook and signaling renewed investor confidence.

eth bearish set upas you see there will be a new bearish trend !! i show you an ABC pattern (major trend) and inside than we are completing an triangle as (B) so i predict a bearish trend as (c) in near future.

ETHCRYPTOCAP:ETH is showing two clear setups right now, one being a symmetrical triangle and the other an ascending channel. Both point to strong bullish momentum building. I’m leaning toward a breakout scenario where ETH surges and taps $9000 with ease once momentum kicks in.


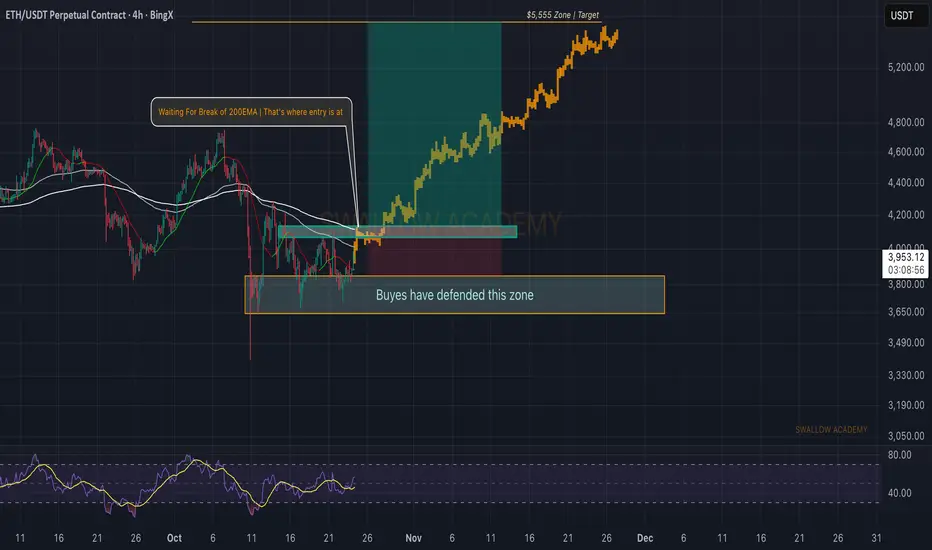
Ethereum (ETH): Getting Closer To 200EMA | Waiting is KeyETH is getting closer and closer to that 200 EMA line, which is the game changer at the current moment. As soon as we see the buyers overtake that zone, we will be aiming to see a decent upside movement.
Momentum is good; the only thing that concerns us is that we are entering the weekend markets.
Swallow Academy
ETH 1h chartCRYPTOCAP:ETH 1H Chart
Ethereum showing a clear market structure shift.
After a liquidity grab and CHoCH, price respected the 1H FVG and confirmed a bullish BOS, signaling potential continuation to the upside.
If price maintains above the FVG zone, ETH could look for higher targets in the short term.
#ETH #Ethereum #Crypto #PriceAction

ETHUSDT 2-Hour Chart Analysis. ETHUSDT 2-Hour Chart Analysis.
ETH is consolidating above key support levels ($3,700–$3,800) and exhibiting a lateral range, but a clear breakout has yet to occur.
The chart path indicates a bullish scenario: if ETH holds above this base, the next major resistance lies near $4,280—a move above this could lead to a target of $4,400+.
Bullish traders will want to see a strong candle above $3,900 to maintain momentum; failure to hold $3,700 raises the risk of a move towards the $3,390 support level.
DYOR | NFA

ETHUSDT.P - October 24, 2025This indicator introduces a minimalist Buy/Sell signal methodology designed for clarity and power. The goal is to strip away all visual clutter—no trendlines, no Boxes, no FVGs—to focus solely on generating precise market directional signals.
It is specifically developed for stability and reliability on well-established major-cap cryptocurrencies (e.g., ETH, BTC). It is not intended for use with high-volatility, low-cap, or memecoins.
Observed Performance
The underlying logic has shown strong results on major pairs. A sample backtest on ETHUSDT.P demonstrated a focus on quality over quantity, yielding 4 clean trades over a 60-day period with a 100% win rate.
The methodology is currently for private study and application, serving as an example of how powerful, clean indicators can be developed for traders focused on large-cap stability.
This content is for educational and analytical purposes only and does not contain any promotional material, solicitation, or fundraising requests.

ETHUSDT-LONG IDEA ETHUSDT is getting toward upside from support level. changed its internal structure at 30 mins forming HH and HL breaking above this level will lead price toward upside for short period of time as it is in accumulation no rally can be expected in this range right now.

ETH/USDT 4H CHART REVIEW🔍 Overall market structure
• Ethereum is moving in a descending triangle/converging channel (yellow trend lines).
• The upper trend line acts as strong resistance (~$4,000-$4,150).
• The lower trend line (rising) provides key support around ~$3,730-$3,750.
⸻
📊 Key levels
Resistances:
• $3,875 – local resistance, where the price rebounded several times.
• $3,990 – another resistance resulting from the yellow trend line.
• $4,143 – main resistance in the breakout zone of the formation (potential target after breaking the downtrend).
Support:
• $3,808 – short-term support.
• $3,733 – important level within the formation (lower yellow trendline).
• $3,637 – strong support that should not be broken while maintaining bullish sentiment.
⸻
📈 Indicators
MACD:
• MACD and signal lines are close to each other - no clear momentum.
• Histogram decreases → possible short-term weakness or consolidation.
RSI:
• RSI indicator around 45–50 → neutral, with no clear advantage of buyers or sellers.
• No divergence, but potential for a rebound if RSI drops to ~40 and rebounds.

Ethereum Daily Chart Update📉 Ethereum Daily Chart Update
ETH has diverged on the daily timeframe and indicators suggest a pullback.
⚡ First support: $4,000
⚡ Second support: $3,500
Stay cautious — key levels ahead! 🚀
ETH | Tuesday High of the week - Thursday ContinuationToday I'm looking for a continuation to sellside for the weekly profile framework.
I would like to see a distribution on 10 AM news and a delivery to DOL tomorrow with CPI.
Invalidation levels marked out on chart

It is time for ETH To touch the moonEthereum has conclusively breached the major resistance of the descending trendline we previously identified on the weekly timeframe. The price has since retested this former resistance level twice, which has now held firm, confirming its new role as support. This successful conversion of resistance into support signifies a robust bullish shift in market structure. Consequently, the asset demonstrates strong momentum, indicating a high potential for a sustained and significant upward trend.
DISCLAIMER: ((trade based on your own decision))
<<press like👍 if you enjoy💚
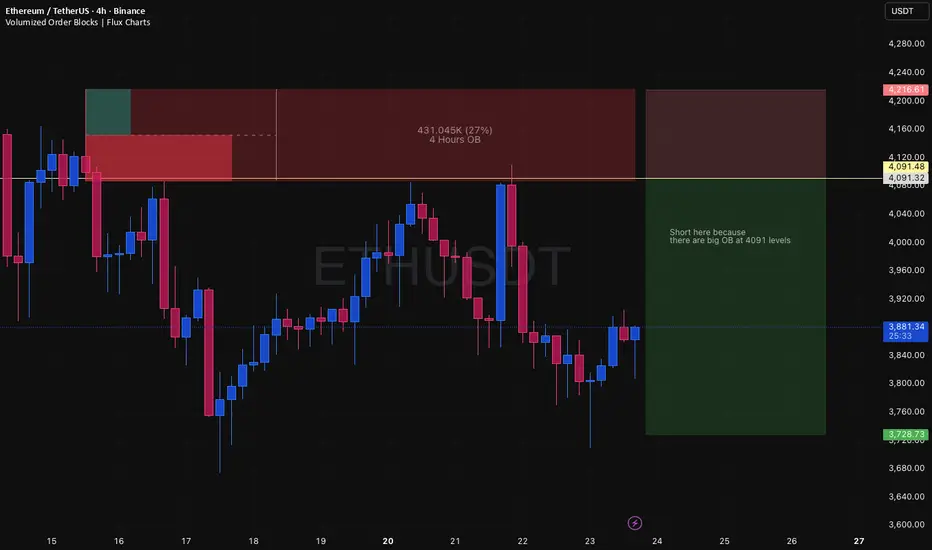
ETHUSDT 4H – Order Block Short Setup
Symbol: ETHUSDT (BINANCE)
Trade Type: Short
Timeframe: 4 Hour (4H)
Setup Details:
Entry: Short at 4091 (identified order block/OB level).
Stop Loss: 4216 (above OB, outside wick traps, 3.06% risk).
Target: 3728 (major support, large RR potential: 2.89).
Rationale: There is a significant order block resistance at 4091, historically rejected. Price recently touched and failed to break above here, giving textbook risk/reward for shorting.
Conditional: If candle closes convincingly above 4091 or OB structure shifts bullish, exit trade and wait for confirmation.
Position Size/Leverage: Size appropriately so stop loss is not account-threatening. Avoid over-leverage given proximity to major level.
Notes:
Do NOT hold if obvious breakout above 4091 or aggressive volume enters.
Consider partial profit at 3840 for risk management; full TP at 3728 on momentum flush.
Tags: #ETHUSDT #OrderBlock #Short #4H #TradingIdea
Visual: Chart shows RR box and marked OB. Text: “Short here because there are big OB at 4091 levels.”