ETH: Head and Shoulders Pattern Targets $3,800Hi Teams!
Ethereum has recently completed a head and shoulders formation. The neckline around $3,920 was broken decisively, confirming the pattern and triggering further downside momentum.
After the breakdown, the price slipped toward the lower boundary of the descending channel, finding temporary support near $3,860. A short-term corrective move is now unfolding, with ETH likely to retest the neckline zone and the upper boundary of the channel before facing renewed selling pressure.
As long as Ethereum trades below $3,920–$3,940, the bearish structure remains valid. A rejection from this area could accelerate the decline toward the target of the head and shoulders pattern, which aligns with the $3,800–$3,820 support zone.
However, a clear breakout above the descending trendline would invalidate this bearish outlook and could open the way for a recovery toward the $4,000–$4,050 resistance area.
Levels to Watch:
Resistance: $3,920 – $3,940 / $4,000 – $4,050
Support: $3,860 / $3,800 – $3,820
Bearish Target: Around $3,800 zone
Outlook: Bearish while below $3,920.
Trade ideas

[SeoVereign] ETHEREUM BEARISH Outlook – October 21, 2025Hello everyone,
This idea is connected to the one shared on the 19th.
I am still holding the short position that was entered based on the October 19 idea, and since some of the underlying reasons have been slightly revised, I’m sharing this as an additional update.
Today, as of October 21, I would like to present my bearish (short) outlook on Ethereum.
Basis — BEARISH BAT PATTERN / WAVE5 = WAVE1 × 0.5
Ethereum is currently positioned near the PRZ (Potential Reversal Zone) of the Bearish Bat Pattern.
This pattern represents a typical retracement-based bearish reversal structure,
where the price tends to form a top around the 0.886 retracement level of XA before transitioning into a downward move.
In addition, within the wave structure, the ratio of WAVE5 = WAVE1 × 0.5 is being formed,
which is generally interpreted as an early termination zone of a short-term downward wave.
In other words, both pattern completion and ratio convergence are occurring simultaneously,
indicating that the current region provides a valid reversal signal from a bearish perspective.
Accordingly, I set the average target price around 3,756 USDT.
Depending on future chart developments,
I will continue to provide updates regarding position management and any changes.
Thank you.

Just a POV about ETH , what do you guys think ?BINANCE:BTCUSDT.P It's just my simple analysis for ETH ,
I mean , it's just following it perfectly i guess!

Ethereum — Losing the PremiumThe Ethereum future’s chart is showing weakness, and I’m expecting a drop toward the $3,760 area from current levels.
Scenario invalidation — the zone is marked on the chart at $4,041

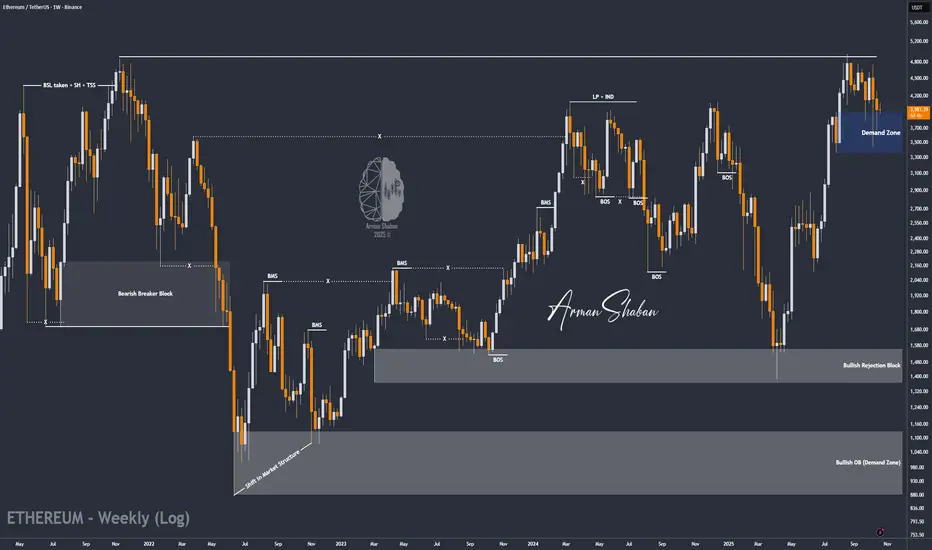
ETH/USDT | ETH Update – Waiting for Confirmation Above $4K!By analyzing the #Ethereum chart on the weekly timeframe, we can see that price has been consolidating around the $4,000 level after a sharp recovery from the $3,400 demand zone. This sideways movement shows ongoing accumulation, but a clear breakout and close above $4,000 is still needed to confirm renewed bullish momentum.
As long as ETH holds above the $3,900–$4,000 support range, the broader bullish outlook remains valid. The next upside targets are $4,950, $5,500, and $6,000 , but continuation strongly depends on Bitcoin’s ability to stay above $112K .
In short — ETH is gearing up for its next move, but the key lies in a confirmed breakout above $4K with BTC providing stability.
Please support me with your likes and comments to motivate me to share more analysis with you and share your opinion about the possible trend of this chart with me !
Best Regards , Arman Shaban

#ETHUSDT 4H ChartPrice traded into the 12h demand zone where it bounced from and it is currently still getting rejected off the 200MA. MACD is showing some bullish weakness, RSI and EMAs are neutral. Price needs to break above both the 100MA and the 200MA to expect further bullish movements towards the 12h supply zone at $4,450.

ETH 6K to 8K !? My analysis atm for ETH
Possible to bounce right back to ATH and price discovery mode to 6K hopefully 8K+
What ya all think, drop it bellow ?

ETH analysis 20 oct 2025if today 20 oct 2025 daily close we can stand the price above 4000, possibly we can continue rally up

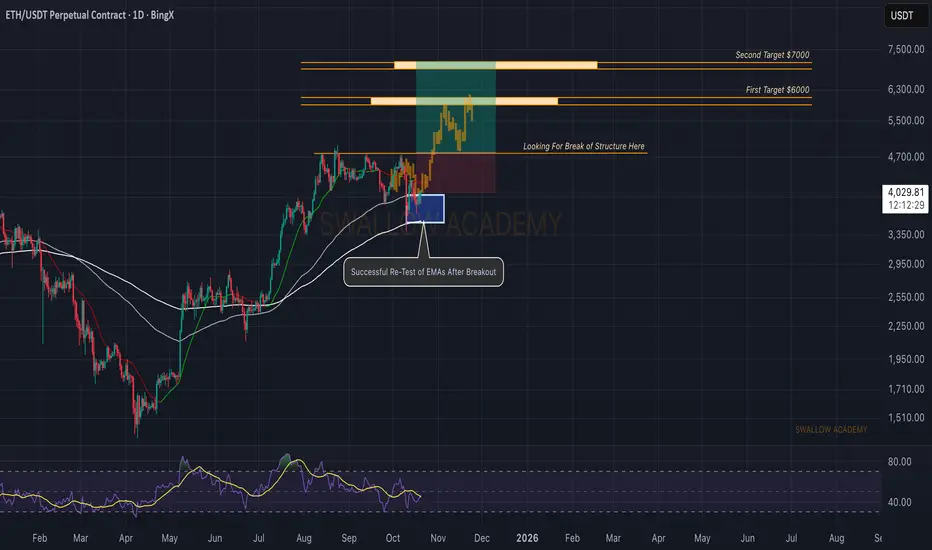
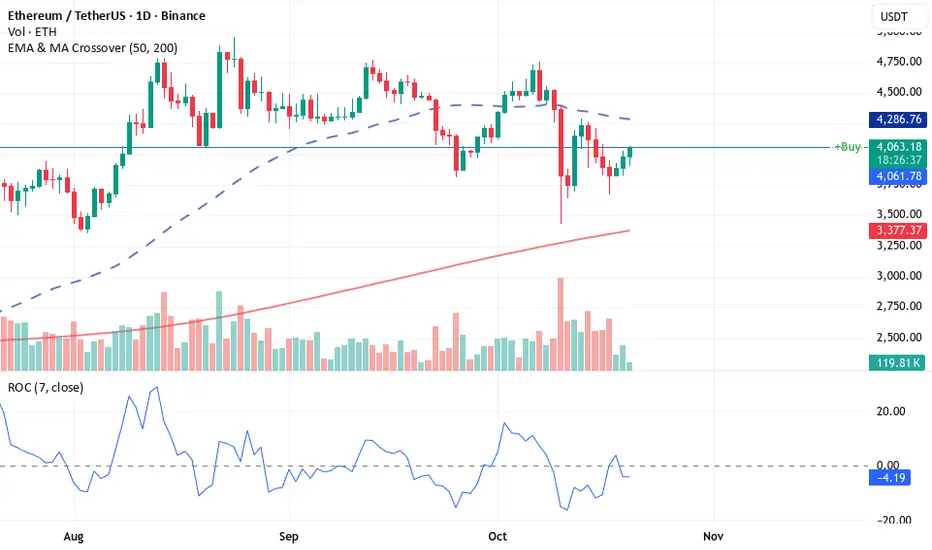
Ethereum (ETH): Successful Re-Test of EMAs | Expecting PushBuyers are showing some kind of dominance near the EMAs, which is the first crucial step toward our game plan that we have.
Once we see them to fully take control over the EMAs, we are going to look for that middle line of Bollinger Bands to be under control as well, and our final confirmation would be a BOS.
That's where our entry is sitting and that's what we are looking for as well (although we took a small long already but the main entry would be on the upper zones).
Swallow Academy
Ethereum (ETH): Chart Looks Very Healthy & BullishDespite the fact that the ideal entry for long on ETH would be after that break of local highs, we decided to go in from the current market price, where the price is still inside the bullish trend that has been keeping the price in a healthy trend run.
That being said, I would suggest going long here with a smaller position size, and once we see the price get that BOS near ATH, we would top up with a position twice as big.
Stop-loss would be considered once a weekly candle would close below the EMAs.
Swallow Academy

ETH: Another Attempt To Resume Upward Movement
Ethereum is showing strong bullish momentum after forming a bullish flag pattern on the chart. The price has broken above the flag, confirming the potential for further upside movement.
As long as ETH stays above the breakout zone, the next target levels are around $4,125 and $4,285.
If the price fails to hold above the breakout area, a short pullback could occur before another attempt to move higher.

ETH 4H Analysis | Day 4🥳 Hey everyone! Hope you’re doing great! Welcome to SatoshiFrame channel .
✨ Today we’re diving into the 4-Hour Ethereum analysis. Stay tuned and follow along!
👀 Ethereum, the best and largest altcoin in our market, has also broken its descending trendline just like Bitcoin, and the long position scenario we discussed earlier has pretty much played out — I hope you took advantage of it.
🔍 After breaking through its previous resistances, Ethereum is now facing a new resistance area where some sellers have stepped in and some buyers are taking profits. There’s a possibility of a short-term pause in price movement. This zone has created a trigger for us, and the next, more logical long triggers for Ethereum are at $4,252 and $4,723. A breakout above these levels could kick off a strong upward move.
🧮 Looking at the RSI oscillator, it’s approaching the 70 zone but has been rejected near that level. For a confirmed breakout above $4,078, RSI needs to enter the overbought region. There’s also a support zone around 50, which could act as a rebound area for oscillatory movement. Right now, RSI has two key zones — 50 and 70 — that define its structure.
🕯 Notice the Ethereum volume behavior: to break through both static and dynamic resistance zones, the volume increased — this happened because a large number of sell orders were stacked in that area, and those orders needed to be filled before price could move upward smoothly. After that breakout, buying volume started to decline slightly, meaning both price and volume are now resting. For Ethereum to break this resistance zone, we either need sell orders to be absorbed or short positions to get squeezed by trapped traders.
🧠 We can outline a few possible scenarios for Ethereum’s position — some of them might be slightly more complex to manage:
🟢 Long Position Scenario 1
We need patience and a price cooldown. Wait for Ethereum to touch its nearest support zone, then rise with increasing volume. If during this move we see setup candles along with a resistance breakout, we can enter the position with a tight stop size.
🟢 Long Position Scenario 2
We can use an order-book stop-buy setup at Ethereum’s resistance and place a wider stop to catch any breakout spike. This allows participation in a potential price surge and can yield solid profit — though these setups usually take longer to reach an ideal risk-to-reward ratio.
🟢 Long Position Scenario 3
This one’s less likely but still worth noting: Ethereum could break its resistance with rising volume, then pull back to retest that same resistance (now turned support). Afterward, if we see volume increase, setup candles, and a confirmed pullback breakout, we can enter with a small stop size.
🔴 Short Position Scenario
A short setup would only make sense if the micro-buyer zone fails, accompanied by heavy whale candles, strong selling pressure, and an overall market crash.
❤️ Disclaimer : This analysis is purely based on my personal opinion and I only trade if the stated triggers are activated .

ETHUSDTETH is making LH/LL within certain boundaries, where support ranges from 3663 to 3821 and resistance is at 4091 may take entry while breaking the resistance, but it is better to take entry with 2nd BoS in 1H TF. There is no divergence .

ETH Local Uptrend — Watching 3,817 and 4,292 LevelsLast week, the price also continued its downward movement, but on the Binance chart, it received a positive reaction from the support zone. At the moment, the price is in a local uptrend.
The risk level for this week is 3,817 — if it breaks and the price fails to recover quickly, we could see a drop toward the 3,365 target. As long as the price remains above this level, the goal is to reach and break the previous high at 4,292 .

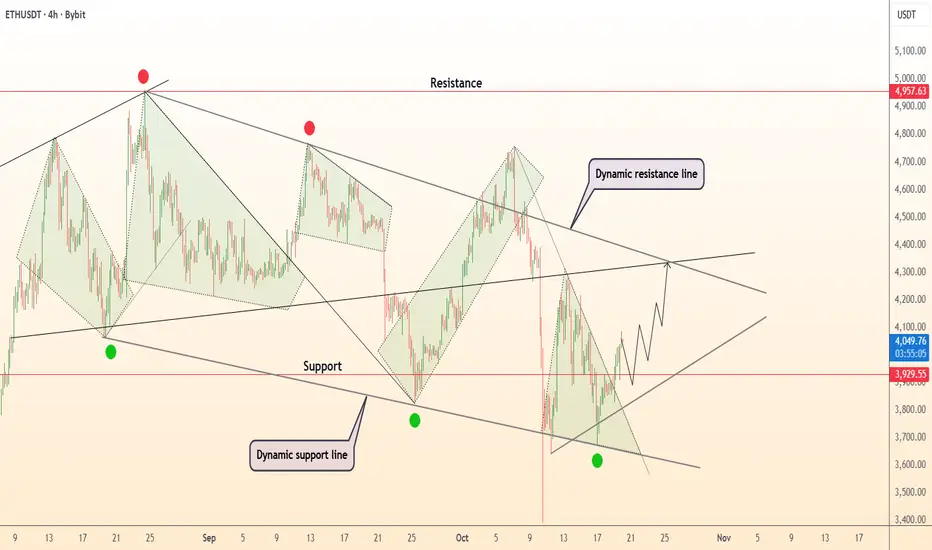
DeGRAM | ETHUSD fixed above the support line📊 Technical Analysis
● ETH/USD is forming a recovery structure after rebounding from the dynamic support near 3,930, showing higher lows that confirm renewed buyer control.
● Price is expected to advance toward 4,350–4,400, where the dynamic resistance line intersects, marking the next key breakout zone for continuation.
💡 Fundamental Analysis
● Ethereum gains support as network activity and L2 adoption rise, while investor sentiment improves following a decline in gas fees and strong DeFi flows.
✨ Summary
● Long bias above 3,930; objectives 4,350–4,400. Technical recovery aligns with improving network fundamentals and risk-on crypto sentiment.
-------------------
Share your opinion in the comments and support the idea with a like. Thanks for your support!
ETH Range Ride – Bulls Still Holding the Line 🌊 🏄♂️
ETH’s still vibin’ inside that downward trendline, just bouncing between 4K and 3.75K like it’s riding the tide 🌊. This range has been soakin’ up liquidity for a while now — and it’s starting to look like a solid support zone where midterm bulls might wanna start stacking up for the next leg 📈.
Even with that sharp push down we saw a few days back, structure hasn’t flipped bearish yet. As long as price keeps holdin’ this base, the chart still leaves room for ETH to reclaim momentum and maybe even hunt new ATHs when the next big wave hits 🚀🤙.
Until then, it’s a patience game — wait for confirmation before paddling in. Let the move come to you, not the other way around ⚡
💬 What do you think about this scenario? Only share your idea if you’ve got another opinion — otherwise just hit that button 👍

The #1 Reason For The Recovering Crypto CrashI was pursing this girl and yesterday
i saw her with other men pursuing her as well.
Its all my fault...next time she goes
public while i pursue her i have to make sure
i propose fast and get the answer.
People use tricks to test us, sometimes
they test us to declare in the public that we want
them so that they have proof
in-case you turn out to be a fake friend.
I have to say the best time to buy BINANCE:ETHUSD
is when its between the moving averages
because you want to buy it after the market crash.
Look at the price pattern
This crypto crash has wiped out
so many traders.
And its because of this i have decided to only
buy this crypto CRYPTO:ETHUSD
after a market crash
Look at the price pattern...
do you see the double bottom?
This double bottom has appeared between
the 50 EMA and the 200 EMA
this is pure market psychology at its best.
Rocket boost this content to learn more.
Disclaimer: Trading is risky please use
risk management and profit taking
strategies.
Also fee free to use a simulation trading account
before you trad with real money.
Ethusdt - dragon longIf you like the idea, please put a ‘like’. It's the best ‘Thank you!’ 😊 P.S. Always do your own analysis before a trade. Set a stop loss. Capture profits in instalments. Withdraw profits in fiat and make yourself and your friends happy.

eth 5293 on 30 min chartall chart indicator on 30 minutes chart
with fibo extension
with stochastics
all the way up

ETHUSDT/BUYThis is my analysis, not a signal.
"Ethereum is currently in a bullish phase. Analyzing the daily chart, we can observe a series of higher highs and higher lows, confirming the uptrend. The RSI is in positive territory without being overbought, and trading volume supports the upward move. The next key resistance to watch is around the $ mark. #Ethereum #ETH #TechnicalAnalysis #CryptoTrader"

ETH: Another Attempt To Resume Upward MovementETH: Another Attempt To Resume Upward Movement
Ethereum is showing strong bullish momentum after forming a bullish flag pattern on the chart. The price has broken above the flag, confirming the potential for further upside movement.
As long as ETH stays above the breakout zone, the next target levels are around $4,125 and $4,285.
If the price fails to hold above the breakout area, a short pullback could occur before another attempt to move higher.
Overall, the structure remains bullish while ETH trades above the $3,900 support zone.
You may find more details in the chart!
Thank you and Good Luck!
❤️PS: Please support with a like or comment if you find this analysis useful for your trading day❤️

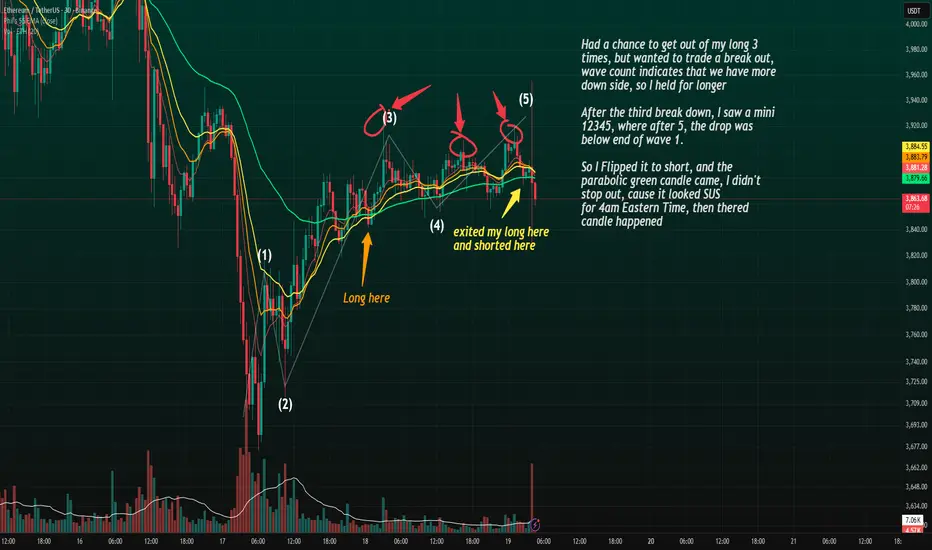
I trusted my wave count dispite volatilityI originally went long after seeing a potential breakout setup, expecting a higher time frame Wave 5 to unfold.
I had multiple chances to take profit on the way up (marked with red circles), but decided to hold since my wave count suggested there was more upside ahead.
After the third rejection, I spotted a clean mini 1-2-3-4-5 structure, and once Wave 5 completed, price broke below the end of Wave 1 — which confirmed weakness.
I flipped short right after exiting my long.
Almost immediately, a parabolic green candle appeared around 4 AM EST, which looked suspicious to me.
I held through it instead of panic-stopping, because the structure still looked like a completed impulse followed by a correction.
Zooming into lower time frames gave further confidence in the five-wave completion, supporting the short setup.