Ethereum (ETH): Momentum is Building | Bullish SignsETH has that recent dip below the EMAs just like we had on the 22nd of June. Similarities can be seen clearly and now if we get that breakout momentum and the price manages to regain the EMAs again, we might be onto a really good entry for a long here so eyes wide open!
Swallow Academy
Trade ideas

Ethereum | Redistribution in the MakingEthereum is carving out what appears to be a redistribution structure, but the context hints we may still need one more push upward, possibly a Last Point of Supply (LPSY) or even a UTAD (Upthrust After Distribution), before the markdown phase resumes.
Wyckoff Structure Overview:
Selling Climax (SC) and Automatic Reaction (AR) defined the lower boundary.
Secondary Test (ST) confirmed demand depletion.
Upthrust (UT) established resistance and began drawing a trendline of liquidity across the highs.
The recent Sign of Weakness (SOW) confirms heavy supply entering, but price action is extended and could retrace to relieve pressure.
The PSY zone between $3,580–$3,740 remains untested, aligning with both a liquidity pool and potential LPSY/UTAD territory. That’s where we’ll likely see whether this range completes redistribution or transforms into an even broader distribution with a deceptive final trap.
Volume and CVD Analysis
During the SOW, volume spiked — strong selling pressure confirmed. Yet CVD is diverging, showing aggressive sellers losing momentum while absorption quietly builds.
If we see a sharp rebound on weak delta, that will likely be smart money offloading into strength — the signature of an LPSY or UTAD.
The Lunar Influence
We’re in Lunar Day 23, during the Last Quarter Moon in Virgo — a cosmic rhythm often tied to misleading signals, short-lived reversals, and exaggerated reactions.
This phase tends to produce fakeouts that look like Signs of Strength or Signs of Weakness, but are actually exhaustion moves or liquidity grabs before the real continuation.
In Wyckoff terms, Lunar Day 23 energy often shows Phase C deception, which could be a UTAD disguised as a breakout or a terminal shakeout before markdown.
What to Watch Next
Rebound on declining volume → potential LPSY/UTAD forming.
Failed rally into the PSY zone with increased spread down-bars → confirmation of redistribution continuing.
Strong bullish delta with no follow-through → likely fake strength under Lunar Day 23 conditions.

$ETH $3,800 is the Critical Catalyst for the Next Major Move!CRYPTOCAP:ETH $3,800 is the Critical Catalyst for the Next Major Move 🚨
The recent #Ethereum (#ETH) washout brings us to a massive decision point. The $3,800 level isn't just a number it's where the current relief rally meets the heavy overhead resistance (downtrend line + key volume zone).
Watch $3.8k Closely:
Rejection: If we get a clear rejection (a lower high), expect the bear trend to continue, targeting the recent lows.
Breakout: A sustained close above $3.8k and the downtrend line flips the script, igniting optimism and potentially giving us a free road back to the $4.4k - $5k highs. 🚀
What's your bet?
#CryptoMarket

DeGRAM | ETHUSD has consolidated below the mirror📊 Technical Analysis
● ETH/USD is testing the broken dynamic support line, which now acts as resistance near $3,600. This retest aligns with the descending channel structure, confirming the dominance of sellers.
● A rejection from this level could lead to a continuation toward the $3,200–$3,100 support zone, coinciding with the previous accumulation area visible from July.
💡 Fundamental Analysis
● Ethereum faces mild pressure as risk appetite fades amid uncertainty over upcoming U.S. economic data and delayed ETF approvals, dampening short-term demand.
✨ Summary
● Resistance: $3,600. Support: $3,200. ETH remains bearish while below resistance, with potential continuation toward the next support zone.
-------------------
Share your opinion in the comments and support the idea with a like. Thanks for your support!

Ethereum Trade IdeaThe recent volatility has pushed Ethereum and the entire altcoin market lower than expected, but this is exactly where disciplined traders find their edge. The setup on the chart shows a fresh order block with clear upside targets (TP1–TP4), offering a structured path for potential recovery. Stay focused, stay patient, and remember capital preservation is your strongest weapon. Only risk what you’re comfortable losing, trust your process, and let the market come to you. Smart risk management will carry you farther than any single trade.

Checking for support near 3472.96
Hello, traders!
Follow us to get the latest information quickly.
Have a great day!
-------------------------------------
(ETHUSDT 1D chart)
This period of volatility is expected to last until November 14th.
After this period of volatility, the key question is whether the price can rise after gaining support near the HA-Low indicator (3472.96) on the 1D chart.
At this point, it's crucial to see if the price can rise above the M-Signal indicator on the 1W chart and maintain its upward momentum.
If the price fails to rise, it is expected to meet the M-Signal indicator on the 1M chart again.
Therefore, to continue the uptrend, the price must remain above the 3239.06-3472.96 level.
The formation of the HA-Low indicator on the 1D chart indicates a significant decline, forming a low.
Therefore, even if the downtrend continues, there's a possibility of an eventual uptrend, so we need to consider countermeasures.
However, if the price meets the HA-High indicator on the 1D chart or falls near the HA-High level, the price is likely to decline until it meets the HA-Low indicator again or the DOM (-60) indicator.
Therefore, we must remember the basic trading strategy of buying in the DOM(-60) ~ HA-Low range and selling in the HA-High ~ DOM(60) range.
If the HA-High ~ DOM(60) range rises, a stepwise upward trend is likely, while if the DOM(-60) ~ HA-Low range falls, a stepwise downward trend is likely.
Therefore, the basic trading strategy should be a segmented trading approach.
To determine trading within the box range and trend trading outside the box range, we refer to the additional auxiliary indicators, StochRSI, TC (Trend Check), and OBV.
To continue the uptrend by breaking above a key point or range, the StochRSI, TC, and OBV indicators must show upward trends.
1. The StochRSI indicator should not have entered the overbought zone.
2. The TC indicator should remain above 0. 3. The OBV indicator should remain above the High Line.
Therefore, it's important to observe the movement around important points or ranges, such as the DOM(-60) ~ HA-Low and HA-High ~ DOM(60).
The next period of volatility will be around November 20th.
-
Thank you for reading to the end.
I wish you successful trading.
--------------------------------------------------

$ETH $3,800 is the Critical Catalyst for the Next Major Move!CRYPTOCAP:ETH $3,800 is the Critical Catalyst for the Next Major Move 🚨
The recent #Ethereum (#ETH) washout brings us to a massive decision point. The $3,800 level isn't just a number it's where the current relief rally meets the heavy overhead resistance (downtrend line + key volume zone).
Watch $3.8k Closely:
Rejection: If we get a clear rejection (a lower high), expect the bear trend to continue, targeting the recent lows.
Breakout: A sustained close above $3.8k and the downtrend line flips the script, igniting optimism and potentially giving us a free road back to the $4.4k - $5k highs. 🚀
What's your bet?
#CryptoMarket

Ether Breakout ImminentWith the Bitcoin testing the key trend, Trump's team start to talk about crypto, a lot. I think the ones who needed to buy the dip has finished their jobs. After that a sudden momentum to end shutdown begins but first attempts failed thus far. But the change of dynamics are clear and it could be positive for crypto and metals.
I will bet on upward breakout for Ether, and please check the BTC idea as well:

Don’t Miss the Wave: Navigating the Markup & Acceleration PhasesEvery strong rally begins with a period of quiet buildup. The price moves sideways, creating a base, while smart money quietly accumulates. Then, at a certain point, something shifts. The Markup Phase begins, and soon after, the market enters the Acceleration Phase — a fast-paced, FOMO-driven surge that catches everyone’s attention. Understanding these phases is key to riding the wave before it crashes.
How to Trade the Markup and Acceleration Phases?
During the Markup Phase, many traders look for opportunities to enter positions gradually, avoiding the temptation to chase after the rapid price movement. A more strategic approach is to scale in on retests of breakout zones or key support levels, which can provide better entry points with lower risk.
As the market moves into the Acceleration Phase, the price tends to surge rapidly, often with little to no pullback. At this stage, it's crucial to protect profits and manage risk. Traders often trail stop-loss orders to lock in gains or take partial profits as the price continues to climb. Parabolic moves are thrilling, but they don't last forever — it's important to stay alert and ready for a reversal or correction when the momentum starts to fade.
🔑 Key Indicators to Watch
During the markup phase, technical signals can help confirm that the move is real. Look for:
Rising volume — confirms genuine interest behind the breakout;
Higher highs and higher lows — a clear sign of trend formation;
Moving averages (20/50-day) — the price staying above these lines often signals trend strength;
RSI and MACD — momentum indicators showing acceleration or potential exhaustion;
Open interest and funding rates — rising figures suggest growing trader participation and leverage.
As the rally gains traction, the market enters the Acceleration Phase. This is where hype replaces logic — the charts go parabolic, social media buzzes, and new traders rush in driven by FOMO. Price action becomes almost vertical, and corrections get instantly bought up. Typical signs of this stage include overbought RSI, spiking volumes, and extreme funding rates — all pointing to overheated market sentiment. Find out what drives the market in our article here .
🪤Common Traps to Avoid
The biggest mistake traders make during these phases is confusing momentum with sustainability. Entering too late, ignoring overheated sentiment, or overleveraging during acceleration can quickly turn profits into losses. Always check whether volume supports the move and watch for sudden spikes in funding rates — they often signal that the trend is near exhaustion.
🏁Final Thoughts
Understanding where the market stands in this cycle helps traders make smarter decisions. The markup and acceleration phases can bring big opportunities, but also major risks for those entering too late. Always rely on your own analysis and use proper risk management. The market doesn’t reward emotions; it rewards patience and discipline.

Ethereum (ETH): There is Still Hope | Still BullishIdk about you guys but ETH still looks bullish despite the recent dip we had. The shakeout was huge, that's true, but price still remains near the bullish trend, which means buyers are still holding somewhat the control over that area.
Will be monitoring the ETH for the next days and weeks; as soon as we see bigger signs of recovery (for example, if buyers manage to overtake the zone near the middle line of BB). Meanwhile, we monitor; ETH still has potential!
Swallow Academy

ETH/USDT: Bullish Breakout to $3740?BINANCE:ETHUSDT is setting up for a potential bullish breakout on the 4-hour chart , where price has formed a higher low while testing a downward trendline, converging near the good entry zone at cumulative short liquidation levels—suggesting buyers could trigger a squeeze if support holds, aiming for higher resistances. This position carries high risk, so always prioritize strict risk and capital management to avoid significant losses in volatile crypto markets.
Entry between $3370-$3417 . Target at $3740 in the take profit zone. Set a stop loss on a close below $3320 to mitigate downside. 🌟 Look for confirmation with a bullish close above the entry and surging volume, riding Ethereum's momentum amid broader crypto trends.
📝 Trade Setup:
🎯 Entry Zone: $3,370 – $3,417
💰 Target: $3,740 (Take-Profit Zone)
❌ Stop Loss: Close below $3,320
⚖️ Risk-to-Reward: Approximately 1:3, depending on entry execution and volatility
⚠️ This remains a high-risk trade setup — strict risk and capital management are essential in volatile crypto conditions.
What's your view on this high-risk setup? Drop your thoughts below! 👇

ETH / USDT (4H Timeframe)Pattern: Break & Retest + Ascending Trendline (Bullish Continuation Setup)
The chart shows ETH breaking out of a key resistance zone, retesting it as support, and continuing to move inside a rising trendline channel. This structure signals strong bullish momentum with potential continuation toward the next major supply zone.
Key Observations
🔹 Support Flip Zone: $3,500 – $3,540 — previous resistance now acting as clean support after a successful retest.
🔹 Ascending Trendline: ETH is riding a strong upward channel, forming higher lows and maintaining momentum.
🔹 EMA (50): Price has reclaimed the EMA and is now trading above it, adding bullish confirmation.
🔹 Targets Marked: Chart highlights $3,700 as the first resistance/target and $3,800 as the secondary upside level.
🔹 Structure: As long as ETH holds above the green support zone + trendline, buyers remain in control.
Potential Move
If ETH continues to respect the support zone and trendline:
🎯 Target 1: $3,700
🎯 Target 2: $3,800
A clean break above $3,800 opens a path toward the major resistance zone at $3,820–$3,900.
A breakdown below the trendline or $3,500 zone would weaken the bullish structure and delay the move.
Summary:
ETH is showing a strong bullish continuation pattern after a successful break and retest of key resistance.
Holding above the $3,500–$3,540 support keeps momentum intact, with upside targets at $3,700 and $3,800.
Structure remains bullish unless price loses the rising trendline and dips back into the previous range.
#coinpediamarkets #ETH #ETHUSDT #CryptoAnalysis #TechnicalAnalysis #Altcoins #SupportZone #ResistanceZone #BullishTrend

ETHUSDT.P - November 9, 2025ETHUSDT.P is showing potential for a short-term bearish reversal after testing resistance near the $3,400 zone. A sell short limit is placed at $3,348, targeting a move down toward the $3,307 partial profit zone and the $3,214 profit level. A sustained move above the $3,416–$3,432 stop level would invalidate this short setup and signal renewed bullish momentum.
Risk Assessment: Moderate to High — Structure leans bearish, but confirmation requires a breakdown below $3,348 and continued weakness toward $3,300.
Note: Do not trade if the price touches the invalidation level first before the sell short limit order.

ETH + BULLISH CROSSEvery time Ethereum has a bullish cross on the Stochastic RSI in the oversold area, we see a rally for a few weeks.

Ethereum analysisTo summarize briefly, Ethereum is now at one of its most important support levels, which might be one of the best times to enter a long position.
Looking at the chart’s history, the price has reached this area before and found excellent support.
Although I prefer the price to go lower so I can buy gradually along the way, the yellow lines indicate the prices I really like to buy at — though I don’t think Ethereum will reach those levels again.
Currently, there are two options:
* Short positions are forbidden.
* Long positions are risky but can be taken with proper risk management, hoping for a price increase.
Alternatively, we can wait for confirmation before entering a long.
In any case, the price is at a very sensitive level, and our view is fully focused on buying.
If for any reason, for example due to fundamentals, our analysis fails, it will be updated quickly and we will prepare for new triggers.

ETHUSDT-LONG IDEAETHUSDT is in internal short term bearish trend very soon it is going to hit its Higher time frame support of demand area. I've market the zone if you find eth in this zone wait for LTF structure shift and Buy. This is just an idea not a Financial Advice.

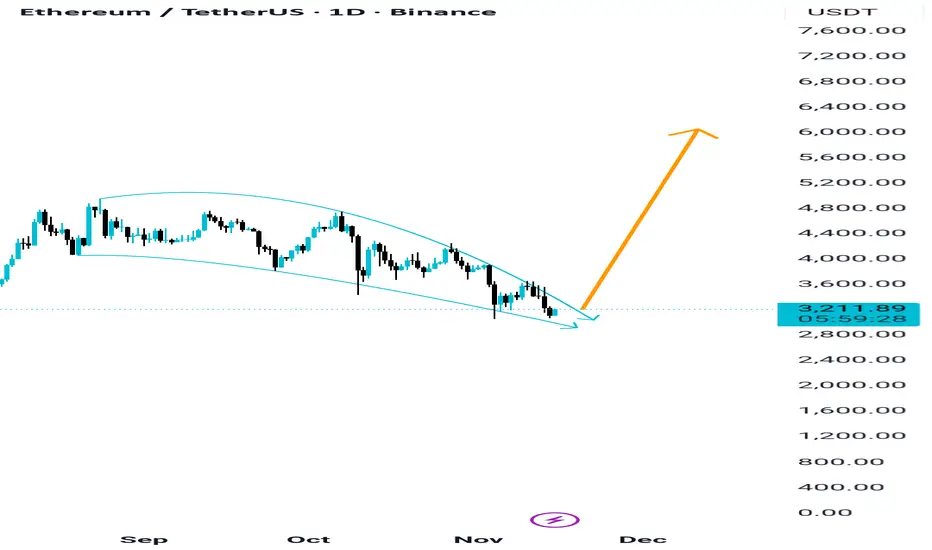
Ethereum to 6000$ if successfully Breakout this Curve If we look at Ethereum on the daily timeframe, we can clearly see that a curve-shaped pattern is forming — you can also call it a curved trendline. This type of structure usually shows a gradual shift from a slow accumulation phase into a stronger upward trend.
If Ethereum manages to break out properly above this curved trendline — with strong volume and a clean retest — then the move can easily extend toward the $6,000 to $7,000 zone. But the key condition here is a confirmed breakout, not just a wick or a temporary spike.
A successful breakout of a curved trendline often signals the start of a stronger momentum phase. And if Ethereum breaks out cleanly from this pattern, we can also expect the possibility of an altseason, because Ethereum strength usually boosts mid-caps and low-caps as liquidity rotates into the rest of the market.
So the main points are:
A curved trendline/curve pattern is developing on the daily chart
A clean breakout is required to validate this structure
If confirmed, Ethereum has room to run toward $6K–$7K
Such a breakout can also trigger a wider altseason across the market
Follow me for more useful premium updates for free
🚀🚀🚀
ETHEREUM Roadmap (3D)This is a broader outlook on Ethereum in the higher timeframe.
From the point marked as "Start" on the chart, it seems that Ethereum's correction has begun, forming an ABC pattern. Wave B appears to have completed as a symmetrical structure, and we are likely in wave X of B or wave C.
We expect a price rebound from the green zone.
So, keep a close eye on the chart and monitor it carefully.
For risk management, please don't forget stop loss and capital management
When we reach the first target, save some profit and then change the stop to entry
Comment if you have any questions
Thank You

Long trade 📘 Trade Journal Entry
Pair: ETHUSDT.P
Date: Thu 7 Nov 2025
Session: London → New York AM
Direction: Buy-side Trade
Timeframe: 1 Hour
🔹 Trade Details
Entry: 3202.91
Take Profit (TP): 3803.73 (+18.76 %)
Stop Loss (SL): 3181.80 (–0.64 %)
Risk / Reward (RR): 28.54 R
🔹 Market Context
The structure shows a clear Selling Climax with heavy volume expansion, signalling the potential completion of the markdown leg.
🧾A Secondary Re-test at the 3200 base level confirms buyer absorption and shift in short-term order flow.
🧾The Consolidation Phase and Preliminary Stop above mark prior distribution range now serving as the target zone (premium liquidity pool).
🧾KAMA (MA) flattening suggests a transition from distribution to accumulation.
🧾Price defended the POI (Point of Interest) at ≈ approximately 3244, forming higher lows in the intraday structure — confirmation of buyside intent.
1Hr TF
🔹 Model Type
Accumulation → Re-accumulation → Continuation Model
🧾The setup follows a textbook Wyckoff Accumulation: Selling Climax → Automatic Rally → Secondary Test → Spring → Markup.
🧾The Spring formed via liquidity sweep below 3200, reclaiming structure with strong close and volume support.
🔹 Execution Notes
Entry refined at re-test of the spring low on volume tapering (sign of absorption).
Risk confined below the Selling Climax wick. Target placed at prior consolidation premium zone (≈ 3.8 k) aligning with inefficiency fill. Volume profile and session timing support entry during London–New York overlap, consistent with institutional execution windows.
🔹 Trade Narrative
This ETHUSDT setup captures a phase-transition shift from markdown into early markup.
After the Selling Climax, the market re-tested structural demand at 3200 — confirming buyer presence. The confluence of liquidity sweep, volume divergence, and EMA / KAMA flattening provides a strong foundation for a buyside reversal.
🧩The trade aims to ride the short-term expansion leg toward the higher-timeframe premium zone, capturing displaced liquidity left by prior distribution. A clean break and close above 3.4 k would further confirm continuation toward the 3.8 k objective.

ETHUSDT.P - November 14, 2025ETHUSDT.P on the 15-minute chart remains in a short-term downtrend, defined by a clear descending trendline that continues to cap price. Current price action is consolidating beneath the $3,240 resistance zone, where repeated rejections suggest sellers are still in control unless a clean breakout and retest occur above this level. Immediate support sits near $3,104; a breakdown below this shelf would likely accelerate momentum toward the broader demand zone around $2,960–$2,900. Conversely, if buyers manage to reclaim the trendline and hold above the $3,240 region, a short-term relief rally could develop, but until then the bias leans bearish within the current structure.


ETH-USDTBetween the two green boxes, it has experienced some range.
As long as it can stay above 3480
and can break the resistance above it at 3715 📊,
it can start a new leg toward its next resistance 🔼🔼

ETHUSDT.P - November 15, 2025The price is currently below the trendline and seems to be consolidating. If the price breaks upwards 3,276.75, consider buying long with the first target at 3,441.72. Partial profits can be taken at this level, and the stop loss should be adjusted to break-even.
If the price breaks below 3,168.65, consider entering a short position, with the next potential target near 3,100.
