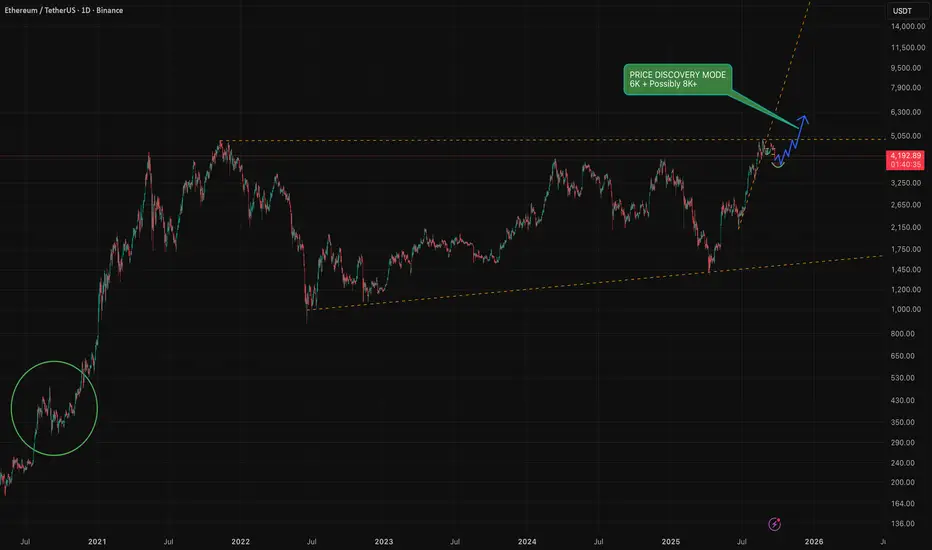
ETH Top / all time high In my earlier analysis I predicted the 2020 September happening again and it is happening as you are reading this.
From the chart and my analysis I can see ETH topping out around 6.8K this run !
I know, we are all hoping for 12K this BullRun and more but personally I am taking out profits around 6K slowly until the top hits and see a clear reversal.
Trade ideas

History doesn't repeat but RHYMES ! I highly recommend everyone to have look at September 2020
I personally think that this will be the same scenario where we will have some fake-outs to drive the retails out / liquidate then the price will carry on upwards and go into price discovery mode where we are more likely to see 6K and hopefully more, if the volume and kicks in the ETF's and more retail pump we can see somewhere between 8K to 12K ( Optimistically )
I personally will be taking profits along the way tho and not going to wait for the top as we all know no one can predict the top nor the bottom !
Thank you all for reading my idea and feel free to share yours here in the comments.
To get access to my indicators please join the FREE tg channel, link in my BIO !
#ETH is in heavy resistance, cautiously bullish📊#ETH is in heavy resistance, cautiously bullish ⚠️
🧠From a structural perspective, we've reached overlapping resistance zones, so be wary of a pullback. If we can establish a bearish short structure here, consider taking some short trades.
➡️Aggressive resistance is near 4330, while standard resistance is near 4410.
Let's see 👀
🤜If you like my analysis, please like 💖 and share 💬
BITGET:ETHUSDT.P

Ethereum Price Approaches $4,500 Despite Crucial Holders’ ExitEthereum is trading at $4,383, just below the $4,500 resistance level. The altcoin king has attempted several times to secure $4,500 as a support floor but has not yet succeeded. This remains the most critical barrier in determining ETH’s near-term direction.
If inflows continue strengthening, ETH could break past $4,500 and secure it as support. Such a move would pave the way for a rise toward $4,775 and potentially retest the all-time high of $4,956. The continuation of this momentum would reinforce a strongly bullish outlook.
However, failure to breach resistance could change sentiment. Ethereum risks slipping back to $4,222 support, with the possibility of falling to $4,074. Such a decline would invalidate the bullish thesis and signal renewed weakness in the altcoin king’s price action.

ETH market snapshotETH has broken above the key $4,250 level and is now hesitating. If we keep consolidating here today/tomorrow, it will signal buyer weakness and likely send us back to retest $3,800. For now, I see this as just a correction within the broader downtrend from the highs. I’ll reconsider my view only if we move above $4,500.

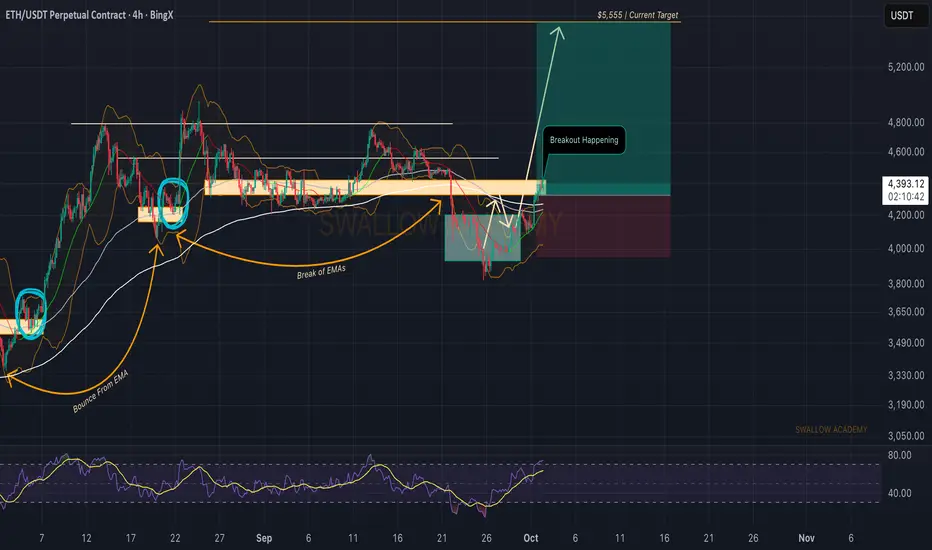
Ethereum (ETH): Secured EMAs + Going For Breakout | BULLISH AFBuyers have secured the lines of EMAs and are now leading ETH for a proper breakout, which will mark the start of upcoming bullish movement, which we think can lead us to a new ATH.
The game plan is simple, so now we just wait for a confirmatory breakout!
Swallow Academy
#ETHUSDT 2H ChartPrice moved up leaving a 2h demand zone at $4,150 as well as an imbalance at $4,250. MACD is showing some bullish weakness, RSI is bought and EMAs are turning bullish. Price is expected to reach the 6h supply at $4,450 before potentially retracing again.

ETHEREUM - THE TRAP IS UNFOLDING – EXPECT A BLOODBATH!As I mentioned in my latest Bitcoin and ChainLink analysis , I believe the crypto market is setting up for a huge long squeeze. Let’s break down why this move looks fragile and why you should be cautious.
What do we need for a healthy rally?
Spot demand – Real buyers (spot market) need to step in and absorb supply. Without this, rallies are built on leverage and tend to collapse quickly.
Controlled leverage – A healthy move isn’t fueled by overleveraged longs. If open interest keeps spiking while spot demand is flat or negative, that’s a recipe for a squeeze.
Auction structure support – Price should build strong bases (value areas, balanced profiles) instead of just ripping up through inefficiencies.
Right now? We don’t have these ingredients.
Step 1: Look at CRYPTOCAP:TOTAL3
For those unfamiliar, CRYPTOCAP:TOTAL3 is the crypto market cap excluding BTC and ETH. It’s a great index to measure the “altcoin market” and often shows where broader crypto is heading.
Now let’s apply some tools:
Anchored VWAP (AVWAP): Tracks the average position of buyers/sellers from a specific swing (like a cost-basis anchor).
Fixed Range Volume Profile (FRVP): Shows where most trading occurred (value area, POC, low/high volume nodes).
What CRYPTOCAP:TOTAL3 shows:
The upper AVWAP band from the swing low (A) is at 1.12T.
The upper AVWAP band from the swing high (B) is also at 1.12T.
Price is retracing into the Value Area High (VAH). This lines up with:
An ascending trendline retest and a Fib retrace (0.75–0.786 zone).
When AVWAP bands from opposite swings collide like this, it’s a double-sided supply zone.
Longs from the low see this area as “expensive” → they reduce risk.
Shorts from the top defend their break-even.
This creates a congestion zone where strong reversals often happen unless fresh spot demand breaks through.
Example: Imagine two teams pushing on opposite sides of a door at the same time. Unless one side gets backup (spot demand), the door doesn’t move — it slams shut.
Step 2: Apply This to CRYPTOCAP:ETH
Now, let’s clear one thing up: CRYPTOCAP:TOTAL3 excludes both Bitcoin and Ethereum. It’s basically the “altcoin index,” showing how the rest of the market behaves without the two giants.
But here’s why it still matters for ETH:
ETH often moves in strong correlation with altcoins, especially during risk-on or risk-off events.
When CRYPTOCAP:TOTAL3 is at a critical resistance or AVWAP collision zone, it usually signals that risk appetite across alts is stretched.
And since ETH trades like a “bridge asset” between BTC and alts, it tends to get caught in the same flows.
So while ETH isn’t included in CRYPTOCAP:TOTAL3 , the technical structure of CRYPTOCAP:TOTAL3 gives us strong hints about where ETH and the altcoin market could be heading.
Step 3: Check USDT Dominance (USDT.D)
Yes, you can chart USDT dominance, and it’s often a leading indicator. Why?
If USDT.D goes up → money flows into stablecoins → crypto selling pressure.
If USDT.D goes down → money flows into crypto → bullish risk-on move.
Right now:
USDT.D broke out of a descending trendline and is retesting the breakout region.
It’s also printing a harmonic pattern that suggests upside continuation.
Step 4: Order Flow – who’s really buying ETH?
This is where the story gets clear:
Aggregated Spot CVD = trending down heavily.
Price goes up while spot CVD goes down = spot is selling into strength → no real demand.
Futures CVD (stablecoin-margined) = trending up heavily.
This means perps are pushing price higher with leverage.
Futures CVD (coin-margined) = trending down.
Another divergence → no strong confirmation from that side either.
Stablecoin OI:
First impulse up = OI dropped → shorts closing, not buyers entering.
Since Oct 1, OI rising → new longs piling in.
ByBit Order Flow: heavy leveraged longs entering, but looks like absorption.
For those that don't understand it:The rally is built on FOMO leverage longs, not real buyers. That’s fragile.
Conclusion
All the ingredients are here for a mega squeeze:
CRYPTOCAP:TOTAL3 at double AVWAP + VAH + Fib confluence,
ETH backfilling inefficiencies into double AVWAP supply,
USDT dominance signaling risk-off,
Order flow showing no spot demand, only leveraged perp longs.
When this unwinds, it won’t just be ETH. Expect broad crypto to follow.
The trap is unfolding. Don’t get caught on the wrong side.
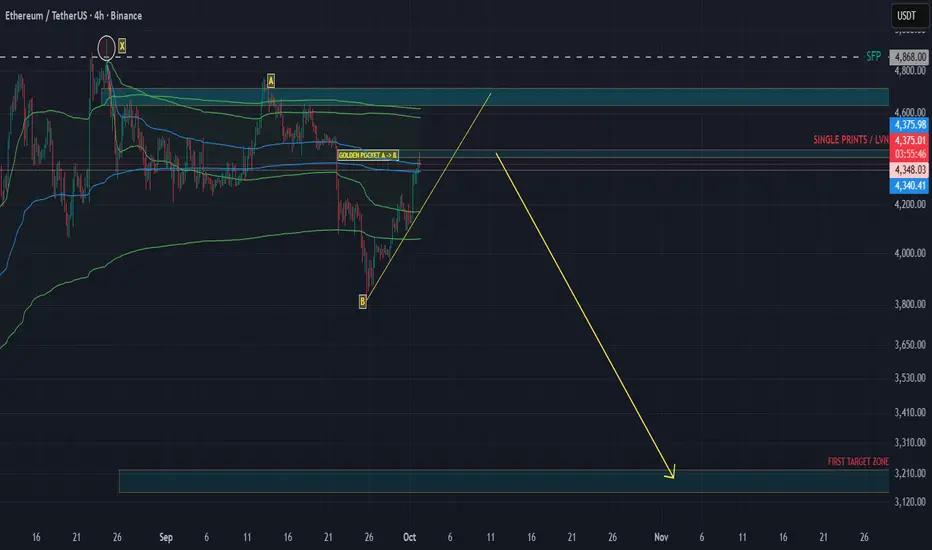
Chart Speaks for itselfBullish divergence at a double bottom. This is important because it is at a very critical zone where multiple times was used as resistance is now support; not shown on the graph but zooming out into higher intervals shows this.

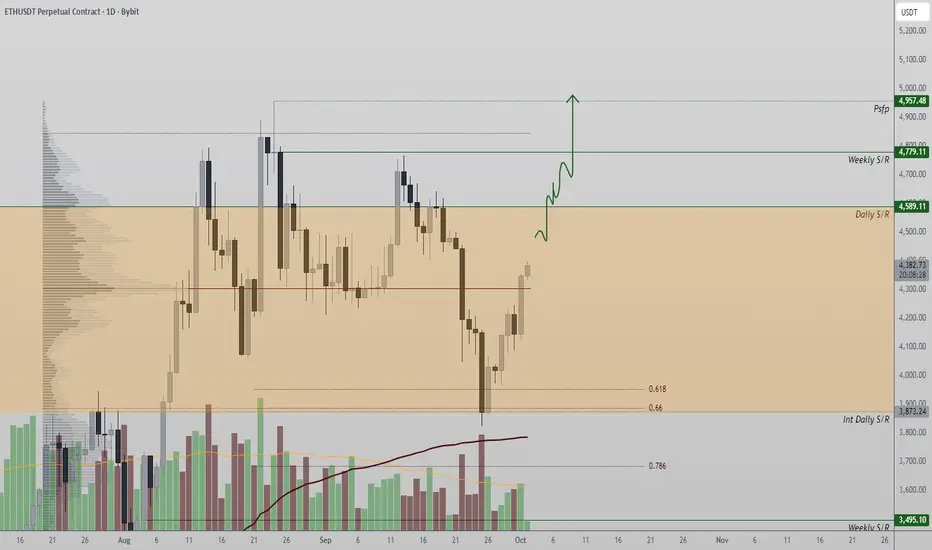
Ethereum Defends $3,800 Support as Bulls Target $4,580Ethereum has rebounded from $3,800, a confluence of Fibonacci and daily support, reclaiming its point of control. This sets up the probability of expansion toward $4,580 and beyond.
Ethereum’s price action has responded strongly to a technical bounce at $3,800, where both the 0.618 Fibonacci retracement and daily support converged. This reaction enabled ETH to reclaim its POC, previously a resistance, and now viewed as a new base for upside expansion.
Key Technical Points:
- $3,800 support holds with 0.618 Fibonacci confluence.
- POC reclaimed, signaling renewed strength.
- Next major resistance lies at $4,580, a key decision level.
After briefly testing lower levels, Ethereum bulls defended $3,800 with conviction. The rebound brought ETH back within its trading range and confirmed the POC as support. This structural shift strengthens the bullish case, particularly as higher closes suggest market acceptance of elevated valuations.
The next resistance, $4,580, remains a key hurdle. A decisive break here, supported by strong volume inflows, will open the door toward a new all-time high. Sustained demand and accumulation above the POC are crucial for follow-through.
What to Expect in the Coming Price Action:
Ethereum looks poised to extend higher, provided it maintains support at the POC. Traders should watch $4,580 for decisive breakout signals that could mark the path to new highs.
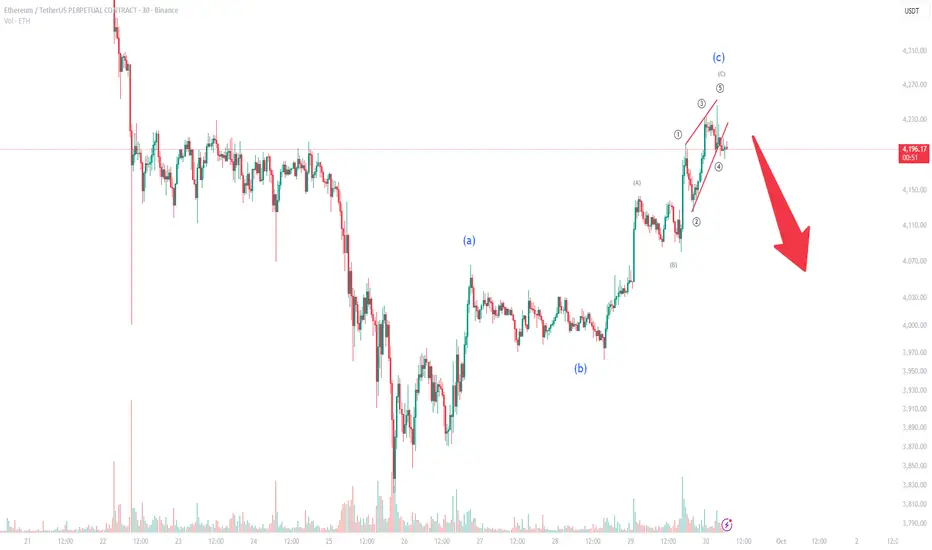
Ethereum Elliott Wave Update: Correction Ahead?Ethereum has recently completed the final leg of its ABC corrective structure, with the C-wave forming as a clear ending diagonal. This technical pattern often signals exhaustion in the current upward move and hints at a potential reversal.
With the structure now completed, a corrective move is likely. Current price action suggests that Ethereum could retrace toward the $4,000 support region, which aligns with both technical targets and key psychological levels.
📉 Trading Outlook:
Short-term traders should be cautious of potential downside volatility.
A corrective wave into the $4,000 zone may offer opportunities for repositioning or new entries depending on market reaction.
Risk management remains essential, as invalidation of the diagonal would occur if ETH pushes significantly higher without correction.
In summary, Ethereum’s Elliott Wave count points toward a possible short-term pullback before the broader trend becomes clearer. Traders should keep a close eye on the $4,000 level for signs of support and potential bullish re-engagement.
ETH 1H Analysis - Key Triggers Ahead | Day 29❄️ Welcome to the cryptos winter , I hope you’ve started your day well.
⏰ We’re analyzing ETH on the 1-Hour timeframe .
👀 On the 1-hour chart , After breaking lower resistance zones, ETH started a strong bullish leg toward higher resistance. It reacted to these levels but moved upward with micro-buyer support. Currently at $4323, a key seller ticker zone—breaking this could push ETH higher. Note: Trend shows some weakness; sell candles are engulfed but smaller. Over 90% of holders are in profit, causing frequent stop-hunts on selling pressure.
🧮 RSI: After moving from near oversold to overbought, RSI is cooling near the 70 level. With increased long volatility, multiple buy positions could form, but rejection here may lead to a correction. Key static resistance is 70; swing support is at 50.
🕯 Volume & Candles: Recent candle size and volume surged as buyers entered, but approaching $4300 resistance shows trend weakness. Candle size decreased; profit-taking and minor pullbacks are possible. For trend continuation, higher volume and repeated buying pushing ETH toward overbought are needed.
📊 Liquidation Heatmap : Unlike BTC, long and short orders cluster sparsely, forming max-pain zones. ETH approaching $4380 could trigger a short squeeze and remove the seller ticker, pushing toward $4500. Next long max-pain is $4246, with lower support around $4100. ETH is in a near-decision zone with one bullish leg.
💸 ETHBTC Pair Currently in a trading range; the floor is Maker Buyer Zone , the ceiling is Taker Seller Zone. Price bounced well from the floor. High concentration of longs and shorts makes range boundaries critical—breaking either could trigger a sharp move. Price is near 0.037 resistance, RSI close to swing resistance. Buyer and whale support could enable another bullish leg; rejection may slightly increase risk of range breakdown.
🧠 Focus on BINANCE:ETHBTC wait for exit from the trading range, then check ETH/USDT. Often aligns with BTC dominance drops. Selling volume in ETHBTC is decent; if whales add volume, this setup provides optimal trade duration.
↗️ Risky Long Scenario: Break 0.037 resistance ETHBTC, BTC dominance drop, breaking ETH/USDT seller ticker, RSI stabilizes in overbought. Small stop-loss; trade is risky but viable.
📉 High-Risky Short Scenario: Rejection from current zone, ETH/BTC rejection, swing rejections, indecision candles multi-timeframe, SMA7 touch, and rising sell volume could signal short positions.
❤️ Disclaimer : This analysis is purely based on my personal opinion and I only trade if the stated triggers are activated .

[SeoVereign] ETHUSDT BEARISH Outlook – October, 03 2025The key basis for presenting a bearish perspective in this idea is that the Crab pattern, one of the harmonic patterns, has been fully confirmed.
For clearer verification, I have directly plotted the relevant section on the chart for your reference.
For reference, the Crab pattern is an extended harmonic pattern with high volatility, typically forming point D at the 1.618 level relative to the XA wave, and is characterized by a strong reversal movement thereafter.
Due to these characteristics, it is evaluated as a highly reliable pattern within the Potential Reversal Zone (PRZ).
Accordingly, the average target price is set around 4,135.40 USDT.
Additional briefings will continue to be updated in this idea as the chart develops.

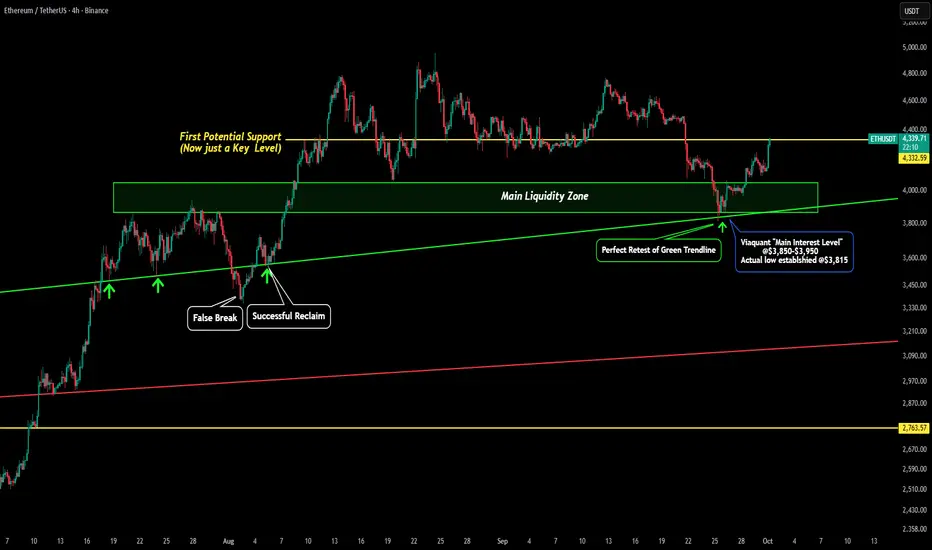
ETH - Viaquant Predicts the Future yet Again Here is an update to our post over 45 days ago:
From the time we hit the top @$4,950 we laid out all the levels to watch for ETH. We were watching some short term levels but the MAIN level we were watching for was the green box titled "MAIN LIQUIDITY ZONE". This zone ranged from $3,800-$4,100.
Since this was a multi-year resistance level we were watching it to act as a new macro support level. We pointed out how "buyers should find this level very appealing if we get a dip to there. The main interest level would lie between $3,850-$3,950."
Current day we can see how perfectly this prediction played out.
First main thing to not is the accuracy of our targets: the main level of interest ($3,850-3,950) was just $35 higher than where the actual bottom was established!
Also the "MAIN LIQUDITY ZONE" was even better with it only be $15 lower than the actual bottom being established at $3,815!!
The next key thing to note is how accurately price retested our green trendline. I have been posting about this green trendline for the past 3 months! Here are some other charts where I had this trendline that called the bottom drawn.
ETH - Zoomed In UpdateHere is an update to our last post:
In our last post we identified ETH was testing its key macro support of the green box and would be looking for a low established in that range.
We saw our $4,060 support level broken which led price to fall into our green box. Once price initially rebounded from the green box we topped out at the $4,060 level as (old support became new resistance). After a secondary dip to the $3,950 level price rebound and broke our resistance.
Upon the pullback we reclaimed our $4,060 as support again! This was our first major bullish signal. Then the next dip we got bulls front ran price around $4,090 showing strong demand once that level of support was reclaimed.
Now we have seen a move to our first key level around $4,280. All candle bodies have been holding above this level and need to continue to do so to potentially make a move towards our main resistance level.
This level would be the green trendline of old support that could now act as new resistance so keep an eye out for that.

ETH about to reach the new ATH👉 Overall, Ethereum has completed an ABC correction, with wave C beautifully bouncing off the 1.272 Fibonacci level. Today, we saw the price break through the key $4,200 level and stabilize above it.
📈 In my view, a new bullish trend has begun for Ethereum, and I expect a breakout from the trendline toward a new all-time high soon
🎯 Targets : 4700$ and 5250$


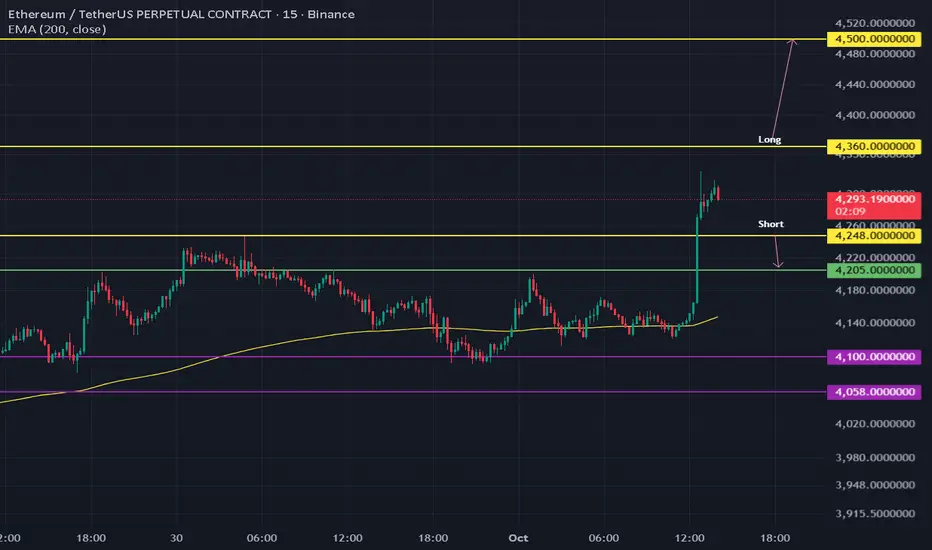
scalp ETHUSDTHi
LONG
Momentum Entry: Enter on a confirmed break and close above the immediate swing high (≈$4,350). This indicates the consolidation is over and the rally is resuming.
Take Profit (TP) $4,500.0 A ≈3.2% move, targeting the major daily resistance at $4,490 and the psychological $4,500 level.
Stop Loss (SL) $4,250.00 Placed precisely at the major pivot point (previous resistance, now strong support) to strictly manage risk. A break below here invalidates the entire pump structure.
Risk/Reward ≈1:2.8 (Risk: $110 / Reward: $140) - Excellent R:R for a strong trend continuation trade.
SHORT
Entry Price $4,248.00 Sell the Failure: Entry on a confirmed close below the critical $4,250 support, which would signal a large liquidity grab.
Take Profit (TP) $4,205.00 A ≈1.0% move, targeting the $4,200 psychological support, which was the first level reclaimed during the pump.
Stop Loss (SL) $4,300.00 Placed above the last hourly low and below the current high. If the price reclaims $4,300, the short is invalid.
Risk/Reward ≈1:0.8 (Risk: $52 / Reward: $43) - Lower R:R, strictly a defensive scalp.
Ethereum (ETH): Expecting Breakout From Resistance | Bullish AFETH is cooking something here; the price is back close to EMAs and the resistance area, where the price most likely will be going for a breakout, opening a potential for a new ATH, which we aim to be $5555.
The start of the month is good; now we need to see that buyers maintain the dominance near current zones!
Swallow Academy

Eth RangeMy initial idea was to turn this distribution into a reaccumulation like seen in June. I'm waiting for it to develop, this could take some time.

ETH – Bulls Eyeing the Next Push!ETH has been showing strength after reclaiming the $4,000 psychological level and breaking back above structure. Price is now trading inside a rising channel, keeping the overall outlook bullish in the short term.
At the moment, ETH is hovering around the $4,040–$4,000 support area. This zone aligns with the lower red trendline of the channel, creating a strong confluence for potential bullish continuation.
As long as ETH holds above this zone, I’ll be looking for long opportunities with the next impulse higher in mind. If broken downward, however, we could see a deeper correction before the bulls step back in.
The key level to watch remains $4,000 . Stay above = bullish bias intact. Break below = caution for further downside.
Do you think ETH will maintain its momentum above $4,000, or will the bears step in for another retest lower? 🤔
⚠️ Disclaimer: This is not financial advice. Always do your own research and manage risk properly.
📚 Stick to your trading plan regarding entries, risk, and management.
Good luck! 🍀
All Strategies Are Good; If Managed Properly!
~Richard Nasr

Market idea based on the Harmonious Energy Flow (HEF) conceptAt the current stage, we can observe a clear manifestation of buyers’ strength, even though the market conditions are shifting rapidly without any significant price expansion. This creates a state of consolidation, where energy is being accumulated for the next move.
According to the HEF concept, consolidation represents a transitional phase — the market is searching for balance before moving into a new wave of directional flow. My current expectation is the transition towards the breakout moment, when price finally exits this consolidation zone and reveals the true side of strength.
📌 Key focus: monitoring how buyers sustain their advantage within this tight structure, and waiting for the signal of release from balance.
If you find my charting approach interesting, you are very welcome to connect for further discussion. I am open to dialogue and exchange of views.

A new rally is starting in Ethereum FamETH has perfectly retested the support zone and it' s now ready for the last part of the cycle
