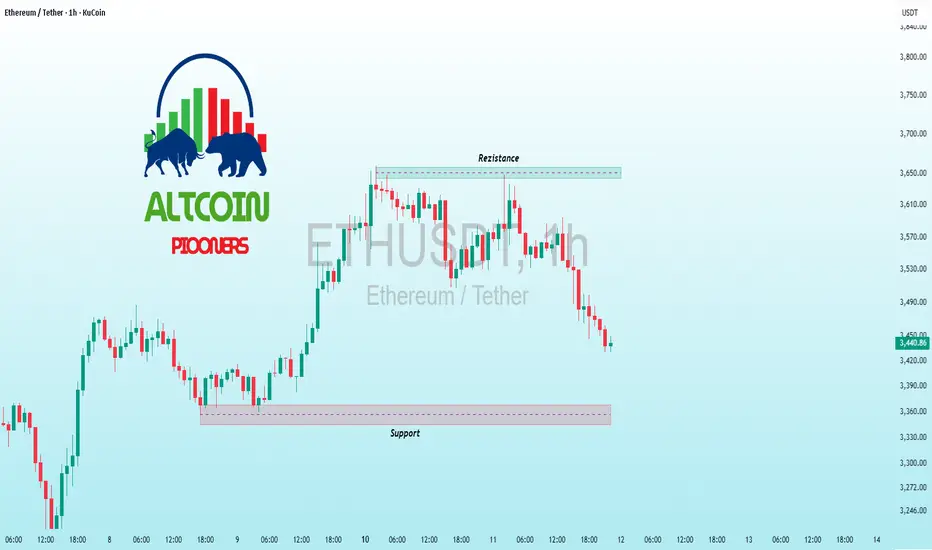
$ETH Pullback to Support – Rebound Chance?KUCOIN:ETHUSDT CRYPTOCAP:ETH Pullback to Support – Rebound Chance?
ETH's 1H chart in correction mode, rejecting resistance at 3.66k and now probing support ~3.32k at 3.45k—strong hold here could spark bounce to 3.50k retest, but breakdown risks deeper to 3.20k on sustained selling.
Bullish bias lingers.
Key indicators: RSI at 45 (neutral, watch oversold), 50MA descending, MACD bearish crossover.📉🔄
#ETH #Ethereum #AltcoinPioneers
Trade ideas
Best Ether price for Hodl , Scalpinghello team
eth can drop more as you see we are in downtrnd , it gonna take some times but still beliave that Strong UPTrend is comming
I would wait for strong reaction for smart money line ( zone )
do your own research
TradeWithMky , Trade Smart
Viva persian 🤩
$ETH Descending Trendline Pressure – Bounce Setup?KUCOIN:ETHUSDT CRYPTOCAP:ETH Descending Trendline Pressure – Bounce Setup?
Current trend: ETH's tracing a sharp downtrend from 4K highs, now slamming the 3,176 support with a wedge-like compression—sellers dominating but volume fading hints at exhaustion 🛡️.
Hold support? Likely yes; prior lows and 200 EMA confluence could spark buyers if wicks hold.
Breakout above resistance? Watch 3,900 flip on close—could reverse to 4,100 if trendline breaks bullishly 🚀.
Dip risk? Sharp to 3,000 on breach, fueled by BTC correlation.
Target: Upside 3,500 on defense; downside 3,050 buffer.
Indicators tracking: RSI (32, oversold snap), Trendline slope, and MACD histogram curl 📉.
#ETHTrading #CryptoWedge #AltcoinPioneers


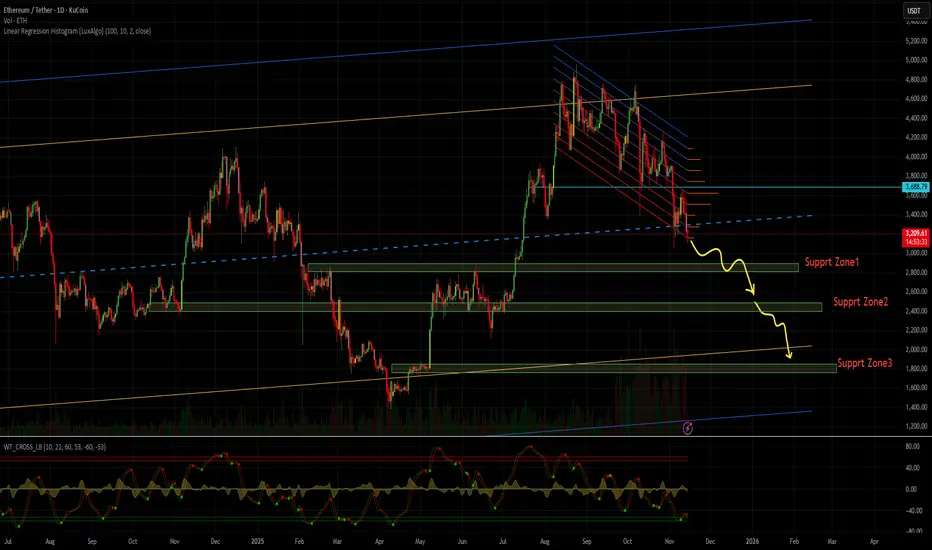
Eth/Usdt analysisI think crypto is in Downtrend mode right now.
but we have 3 support zone for ETH/USDT that shown in chart.
just wait for reverse candle in daily time frame in support zone.
support zone 2 and 3 is more safer.
Note that these support zones are good for short-term purchases and require further analysis to say the market is bullish.
Update ( ETHUSD )After the sweep of LQ we may see a run of those lows before reversing higher , we aren't gonna enter yet , not until higher time frame confirms to us that the state of dilevery has changed.

ETH: Fade the FearTrade Setup
Position: Long (2–3x leverage max)
Entry Zone: 3,741–3,591
Stop Loss: 3,325
Targets:
TP1: 5,190
TP2: 5,561
TP3: 5,836
This setup enters on the completion of Wave 4 and the beginning of a final impulsive Wave 5, with ETH reclaiming prior ATH resistance near 4,868 into a final euphoric Q4.
Macro Context
1. Rate Cuts and End of QT:
The Fed continues to signal a move toward easier policy. As rate cuts proceed and quantitative tightening winds down, risk assets tend to rally. Crypto often lags equities by a few weeks, meaning ETH could soon benefit from these liquidity shifts.
3. Liquidity Flow from Gold:
Crypto will steal liquidity from gold sellers as liquidity rotates.
3. Volatility Positioning:
DVOL data shows implied volatility hovering around 43–44, indicating that institutional players are not aggressively hedging downside. Such volatility compression often precedes a major directional move, typically upward during liquidity expansions
Technical Confluences
1. Wave Structure:
ETH appears to be finalizing Wave 4, setting up for a higher-low structure that leads into Wave 5. The MACD on the 3D timeframe is reversing, supporting bullish continuation.
2. Golden Pocket Retrace:
The current pullback perfectly aligns with the 0.618 Fibonacci retracement zone between 3,741 and 3,591.
4. Bull Market Support Band:
The 20W SMA and 21W EMA continue to hold as dynamic support.
5. Funding Rate Sentiment:
Funding rates across major exchanges remain neutral to slightly negative. This shows that short positions are piling in near support, which is typical during the final stages of a corrective phase before a squeeze higher.
DO NOT BE COMPLACENT.

Ethereum (ETH): Now of Never | Betting on This WeekETH looks good and bad at the same time. While price has broken the bullish trend on which it has been bouncing for quite some time and which again should mark a midterm bearish market, the gut feeling tells us differently.
A strong wipeout happened last week, where the current week started with a strong bullish candle (just as the US exited the shutdown).
It seems like good momentum is building up here so waiting for the price to reach and secure once again that bullish trend, which then would openor us a trading setup.
Swallow Academy

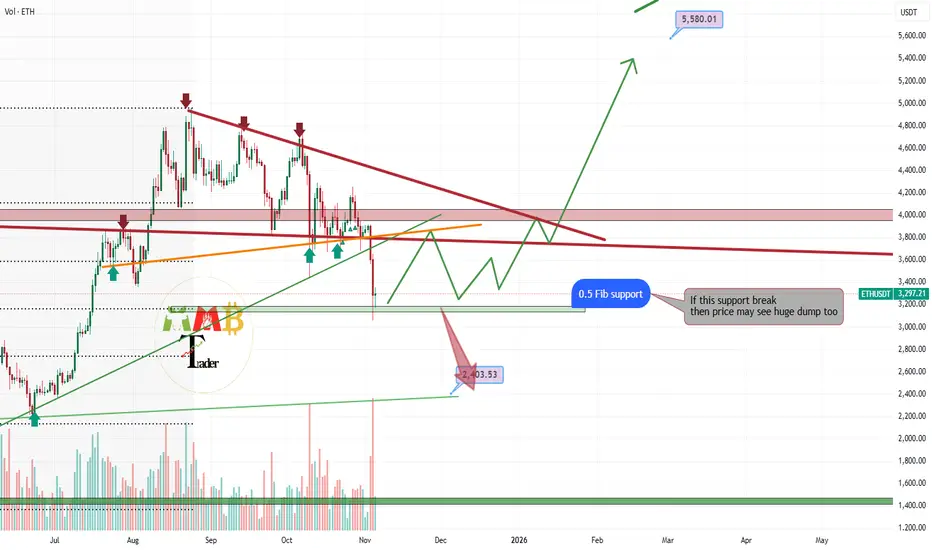
ETHUSDT is testing major Fibonacci support level now As the chart illustrates, ETHUSDT has completed a significant correction and is now testing a crucial technical level: the 50% retracement level of the Fibonacci sequence. This level often acts as a dynamic support zone in a strong trend.
A confirmed bullish rejection at this 0.5 Fibonacci support, evidenced by a strong reversal candlestick pattern, would signal that the correction may be complete. This would establish a high-probability setup for a resumption of the primary bullish trend.
In such a scenario, we would anticipate a strong bullish impulse, with an initial technical target projected toward the $5,500 level. This target is derived from the magnitude of the prior uptrend and represents a key resistance zone on the higher timeframes.
DISCLAIMER: ((trade based on your own decision))
<<press like👍 if you enjoy💚
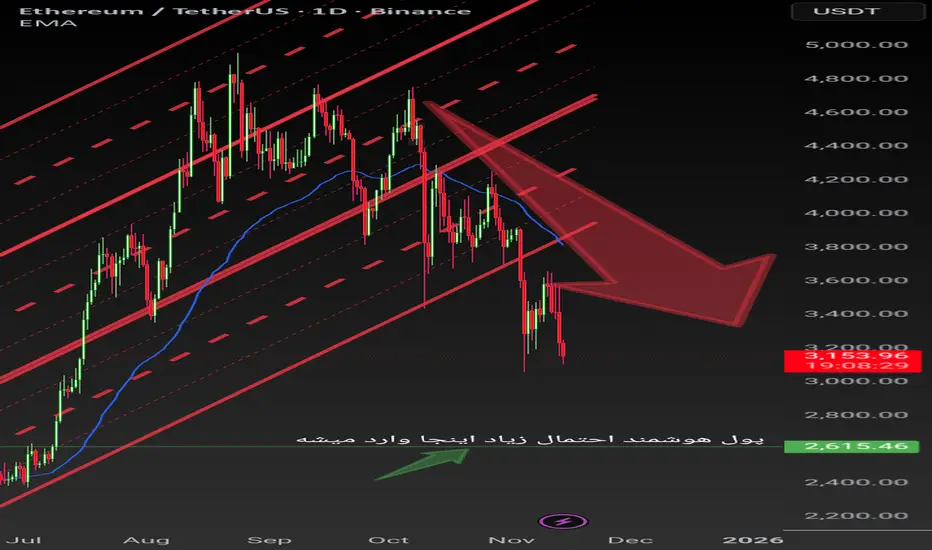
Does this scenario cross your mind? What if…Does this scenario cross your mind? What if…
CRYPTOCAP:ETH drops below $3,000, maybe $2700, and everyone thinks it’s all over. Then, just as everyone is convinced the bears have won, ETH bounces back, shaking out the sceptics while most people stay on the sidelines. Meanwhile, Tether and the Bitcoin dominance index show bullish moves but suddenly start printing negative daily closes.
Altcoins begin pumping again. To mask what's really happening, you'll start seeing a few bullish headlines about some random company that has nothing to do with crypto. Classic.
What’s your take on this?
Do share your views in the comments and hit the like button if you like it.
Thank you
#PEACE
ETHEREUM Roadmap (3D)This is a broader outlook on Ethereum in the higher timeframe.
From the point marked as "Start" on the chart, it seems that Ethereum's correction has begun, forming an ABC pattern. Wave B appears to have completed as a symmetrical structure, and we are likely in wave X of B or wave C.
We expect a price rebound from the green zone.
So, keep a close eye on the chart and monitor it carefully.
For risk management, please don't forget stop loss and capital management
When we reach the first target, save some profit and then change the stop to entry
Comment if you have any questions
Thank You

ETH Capital Sector. Price Slice 15.11.2025 1590.05 K🏷 ETH Capital Sector. Price Slice 15.11.2025
3035,40 — At the time of publication, the price had not yet been reached. ( на момент публикации цена не достигнута )
2872,52 — At the time of publication, the price had not yet been reached. ( на момент публикации цена не достигнута )
2772,62 — At the time of publication, the price had not yet been reached. ( на момент публикации цена не достигнута )
2575,43 — At the time of publication, the price had not yet been reached. ( на момент публикации цена не достигнута )
2332,65 — At the time of publication, the price had not yet been reached. ( на момент публикации цена не достигнута )
1927,44 — At the time of publication, the price had not yet been reached. ( на момент публикации цена не достигнута )
1590.05 — At the time of publication, the price had not yet been reached. ( на момент публикации цена не достигнута )
🏷 At the request of close colleagues, friends, and supporters of my work, I am publishing this analytical material in English—for the international institutional community and conscious retail market participants.
🏷 This slice reflects the logic of institutional capital movement. It is critical to understand: price is formed only when sufficient liquidity from the retail sector and sustained crowd interest are present. Without this condition, institutional interest remains potential, but unrealized.
🏷 Meanwhile, institutional capital operates on entirely different temporal and structural charts than those visible on the screens of most traders.
🏷 Therefore, a superficial view of price is doomed to distortion.
🏷 Methodology: Pre-Factum
🏷 My analytical markings are built on the principle of Pre-Factum—anticipating the fact before it manifests. This is not forecasting in the traditional sense, but identifying capital intent prior to its physical manifestation on the chart.
🏷 The central element of this method is identifying a price sector as an intention—where the instrument is striving to go—regardless of its current price action: no emotions, only cold calculation. Every price has its own timeframe.
🏷 There are three ways to interact with unfulfilled price levels:
🏷 1. Trade from the level—enter upon confirmed structural validation.
🏷 2. Wait for fulfillment—observe price movement toward the level without entering, focusing on instrument behavior.
🏷 3. Trade in the direction of the level—utilizing support/resistance levels with strict risk control.
🏷 If you choose the third path, deep understanding of market mechanics becomes mandatory. Without experience, conscious perception of liquidity behavior, and prior study of relevant materials, entering such positions is premature.
🏷 This applies equally to retail newcomers and professionals whose attention remains scattered by short-term timeframe noise.
🏷 Relevance of Markings
🏷 The levels presented here are current, fresh institutional capital markings. They do not invalidate previously identified unfulfilled prices but complement them within the context of evolving liquidity and shifting market logic.
🏷 A flag placed prior to price touch—with the publication date (level, sector—whichever you prefer)—indicates that the instrument, with high probability and regardless of current price movement, intends to execute a move toward that price.
🏷 Two examples:
🏷 Example #1 — BTC:
On the screenshot from September 26, 2025, I marked the price of 106,110 with a blue flag (color is my personal labeling). Screenshot:
The instrument subsequently deviated from this level by 15%, creating pressure: on October 10, 2025, price declined sharply, collecting all long positions.
Instrument slide:
🏷 Example #2 — ETH:
On October 12, I marked the price of 3,291.60 with a yellow flag:
On November 4, the instrument reached the marked price:
🏷 I have directed your attention to specific prices—and there are many such examples in my feed. If you study my materials, you will see: this is a new methodology, currently not demonstrated by anyone else in the world. The precise slice and price sector I have developed reveal the true mechanics of the market.
🏷 Once price reaches a flagged zone, the marking loses its original function. It must be updated to reflect the new logic of capital movement—otherwise, it becomes a misleading reference or a conventional technical analysis level.
🏷 These markings are not static. They are dynamic markers of intent, requiring constant reassessment. It is precisely these that we uncover through the method of capital anticipation.
🏷 Temporal Context
🏷 I emphasize separately: the flag carries not only a price function, but also a temporal one. The publication date is the fixed point of my observation and identification. It serves as my anchor: where and when I captured institutional intent.
🏷 My entire architecture of price sectors is systematically organized into chronological folders. I have already demonstrated this structure in one of my videos—for those who seek to think structurally, not reactively. Use translators as needed to study my demonstration.
🏷 This is not a forecast. It is a map of intent.
🏷 Read it with respect for liquidity, time, and capital intelligence.
🏷 English is not my native language. With international exposure, time will come—I will provide new reference points as needed, without compromising institutional interests or the balance of many market participants. I do not disclose the entire price sector or the skill of seeing any instrument within its price sector for security reasons. You must determine for yourself how to engage with institutional analysis.
🏷 There are traders, and there are analysts—two distinct classes. The mindset between institutional analysis and trading is fundamentally different.
🏷 As you see, I do not use indicators. This is mathematics, logic, and an intellectual system I created—my proprietary property. I have come only to help you see a different structure.
🏷 The battle of titans is a clash of attention and timing.
🏷 The question is not who is right—but who has the resources and patience to unload positions.
🏷 Who leads whom? The one who sees further and holds institutional leverage.
🏷 You have received a map. Most see an image; few read the message. The difference is not IQ, but the habit of looking toward the future—not at indicator noise.
🏷 Institutional capital meticulously crafts candles, as if scripting the narrative to suit its preferred triggers. I, operating from the shadows, read the plan: where entry points will be set, where liquidations will be scheduled, who will hold positions until the bell.
🏷 I offer possibilities, not commands. But let us acknowledge: a hint is an art—and it transforms curiosity into dependency. Do you remember the echo of these words?
🏷 I have shown you another side of analysis—I have designed what you have been waiting for, and what you have grown weary of. This is new technical analysis: to understand how to control the capital sector—study the materials. The secrets are mine. I give you part of this understanding to help you.
🏷 Not tricks, not guesses—but architecture.
🏷 Let it sound mystical—it must. A map in the hands of one who can read between the candles always appears as prophecy to those accustomed to indicator noise.
— The Architect

ETH Mega long
Ethereum is awaiting the approval of the ETH ETF, which currently cannot happen due to the government shutdown. Once the government shutdown is over and normal practice resumes, as long as the ETH ETF gets approved then we should be Gucci.
My expectation is a revisit to the most recent low or potentially lower. My extended low targets would sit around 2300-2500 but initially I am not expecting much lower than 2900-2950. The 9H RSI has broken out of its support zone and is now retesting the bottom of that trendline, similarly the Daily is doing the same. This is the rejection we are looking for around 3400-3500, which will drive the price down.
If we get a scenario where BTC is not pumping as strongly then its possible people/business could transfer their BTC ETF holdings and swap them to ETH ETF holdings if the opinion is well BTC isnt pumping much or as stongly as ETH.
This idea is powered by the NakedNation community and BareNakedCrypto who you can find on socials and streams on Kick. Low key the goat!
This is not financial advice, I am not a financial advisor. It's just a bit of fun.

Long trade Pair: ETHUSDT
Date: Wed 12th Nov 25
Time: 6.30 pm
Session: Tokyo PM
Direction: Buyside
Timeframe: 15-min Execution
🔹 Trade Details
Field Value
Entry 3410.66
TP 3623.43 (+6.23%)
Stop 3368.96 (–1.23%)
RR 5.1: 1
🔹 Technical Context
Model: FVG → Inducement → BOS → Mitigation Entry
📝Higher-Timeframe Bias
The chart shows ETH sweeping a major HTF discount zone around 3200–3240, which aligns with Base Level 3244.28. This region acted as a Sell climax, Secondary test (Wyckoff Phase B/C), and Liquidity grab beneath all previous London and NY lows. FVG between ~0.62–0.70 retracement zone. It remained untouched, leaving a clear inefficiency target for a mitigation tap.
Before price tapped the FVG, ETH created:
A micro liquidity shelf and consecutive equal lows during Tokyo → London
Narrative:
Price swept the HTF base level around 3240, confirming bullish accumulation. Multiple session lows were engineered then taken (Tokyo → London → NY), creating strong sell-side liquidity. After displacement, ETH left a clean bullish FVG, whose price never fully mitigated. A shallow 0.25 pullback created inducement, ensuring weak hands entered early. Once the BOS printed, the price sharply retraced into the FVG, Discount Fib zone, Breaker block, and Tokyo PM session demand, creating an algorithm-driven entry.
🔹 Sentiment / Narrative Context
Liquidity vacuum above 3500 with clean inefficiencies makes buyside continuation likely.
Broader sentiment remains positive as the market left a re-accumulation range rather than a distribution. Volume aligned with bullish displacement — institutions supporting the move.
No major macro headwinds at this moment; volatility stable and favouring upward expansion.

Long trade 📘 Trade Journal Entry
Pair: ETHUSDT.P
Date: Thu 7 Nov 2025
Session: London → New York AM
Direction: Buy-side Trade
Timeframe: 1 Hour
🔹 Trade Details
Entry: 3202.91
Take Profit (TP): 3803.73 (+18.76 %)
Stop Loss (SL): 3181.80 (–0.64 %)
Risk / Reward (RR): 28.54 R
🔹 Market Context
The structure shows a clear Selling Climax with heavy volume expansion, signalling the potential completion of the markdown leg.
🧾A Secondary Re-test at the 3200 base level confirms buyer absorption and shift in short-term order flow.
🧾The Consolidation Phase and Preliminary Stop above mark prior distribution range now serving as the target zone (premium liquidity pool).
🧾KAMA (MA) flattening suggests a transition from distribution to accumulation.
🧾Price defended the POI (Point of Interest) at ≈ approximately 3244, forming higher lows in the intraday structure — confirmation of buyside intent.
1Hr TF
🔹 Model Type
Accumulation → Re-accumulation → Continuation Model
🧾The setup follows a textbook Wyckoff Accumulation: Selling Climax → Automatic Rally → Secondary Test → Spring → Markup.
🧾The Spring formed via liquidity sweep below 3200, reclaiming structure with strong close and volume support.
🔹 Execution Notes
Entry refined at re-test of the spring low on volume tapering (sign of absorption).
Risk confined below the Selling Climax wick. Target placed at prior consolidation premium zone (≈ 3.8 k) aligning with inefficiency fill. Volume profile and session timing support entry during London–New York overlap, consistent with institutional execution windows.
🔹 Trade Narrative
This ETHUSDT setup captures a phase-transition shift from markdown into early markup.
After the Selling Climax, the market re-tested structural demand at 3200 — confirming buyer presence. The confluence of liquidity sweep, volume divergence, and EMA / KAMA flattening provides a strong foundation for a buyside reversal.
🧩The trade aims to ride the short-term expansion leg toward the higher-timeframe premium zone, capturing displaced liquidity left by prior distribution. A clean break and close above 3.4 k would further confirm continuation toward the 3.8 k objective.

ETH Key Levels and possible wave countsQuick and simple analysis.
We have some key Fibonacci level coming up, if all of them failed, we are likely to go back to the bottom of the channel.
Watch for small bounces between those level. I suspected that we are in Wave A of the ABC corrective structure, the next run up could be a Wave B correction that goes up, then we will come down again. Trade with caution!

Eth go up)Hello everyone.
I've been in the market since 2019. And believe me, Eth has already started to rebound.
Teke one pointed.
A tennis racket will help you send the price up;)
Good luck, your Panda.

$ETH's Fragile Floor: 3.16K Bounce or Liquidation AvalancheKUCOIN:ETHUSDT CRYPTOCAP:ETH 's Fragile Floor: 3.16K Bounce or Liquidation Avalanche to 2.95K? 📉🟣
ETHUSDT 1H flashing red flags—price hugging 3.16K support with 2.73B long liqs looming if it snaps.
Weak volume on rebounds, bearish channel intact; resistance at 3.6K a distant dream.
Deeper dip to 2.95K likely on break, but watch for RSI rebound & MACD histogram flip.
HODL tight or hedge! ⚠️
#ETH #AltcoinDip #TradingView

Liquidity Hunter | Smart Money PlaybookSmart Money Footprint | Market Structure & Liquidity Trader
Hunting liquidity sweeps and smart money footprints across major sessions.
I break down the market the way institutions move it:
SFP • Break of Structure • Premium/Discount • Session Timing • Fakeouts
Daily charts, scalps, and tactical explanations.
Follow if you want to trade with the real flow — not against it.
Drop a comment once at all this information 🤑🔥❤️📉

ETH short term tradeI noticed activity of big whales, according to on-chain data, people are buying ETH, including Bitmine, but looking at the chart we can see that ETH lost a strong support level of $3900, we should wait we upcoming liquidity after seeing new Trump's announcement about giving away $2000 to everyone in the USA. So far I'm waiting for return of the price back to ex support level and after giving reacting from there, Ima going to open a long position.

ETH-USDTIt has reached the support level at 3450 again.
If it can stay above this,
it could rise again up to the top of the range box at 3715 🔼🔼
Keep an eye on the chart 👀💰

ETH / USDT (4H Timeframe)Pattern: Break & Retest + Ascending Trendline (Bullish Continuation Setup)
The chart shows ETH breaking out of a key resistance zone, retesting it as support, and continuing to move inside a rising trendline channel. This structure signals strong bullish momentum with potential continuation toward the next major supply zone.
Key Observations
🔹 Support Flip Zone: $3,500 – $3,540 — previous resistance now acting as clean support after a successful retest.
🔹 Ascending Trendline: ETH is riding a strong upward channel, forming higher lows and maintaining momentum.
🔹 EMA (50): Price has reclaimed the EMA and is now trading above it, adding bullish confirmation.
🔹 Targets Marked: Chart highlights $3,700 as the first resistance/target and $3,800 as the secondary upside level.
🔹 Structure: As long as ETH holds above the green support zone + trendline, buyers remain in control.
Potential Move
If ETH continues to respect the support zone and trendline:
🎯 Target 1: $3,700
🎯 Target 2: $3,800
A clean break above $3,800 opens a path toward the major resistance zone at $3,820–$3,900.
A breakdown below the trendline or $3,500 zone would weaken the bullish structure and delay the move.
Summary:
ETH is showing a strong bullish continuation pattern after a successful break and retest of key resistance.
Holding above the $3,500–$3,540 support keeps momentum intact, with upside targets at $3,700 and $3,800.
Structure remains bullish unless price loses the rising trendline and dips back into the previous range.
#coinpediamarkets #ETH #ETHUSDT #CryptoAnalysis #TechnicalAnalysis #Altcoins #SupportZone #ResistanceZone #BullishTrend

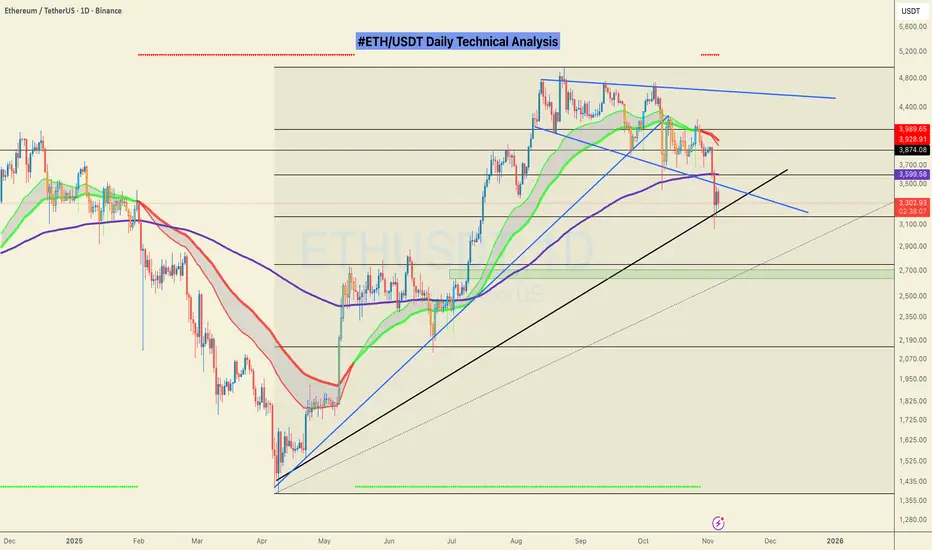
ETHEREUM ETHUSDTTHE structure is giving a weekly rejection on the descending trendline ,if we break and close above 4007.4 look for buy position and target 5000 or more
key demand floor 2573.37-24490 zone
key demand floor 2145-21440
key demand floor 930-10000.
fundamentals of Ethereum
Ethereum is a leading blockchain platform known for its smart contract functionality, enabling developers to build decentralized applications (dApps) across various sectors such as finance, gaming, and digital identity.
Key Features:
Smart Contracts: Self-executing contracts with the terms directly written into code.
Ethereum Virtual Machine (EVM): The runtime environment for executing smart contracts.
Decentralized Finance (DeFi): Ethereum hosts the majority of DeFi applications like lending, borrowing, and stablecoins.
Non-Fungible Tokens (NFTs): Ethereum is the primary platform for NFTs, enabling unique digital assets like art and collectibles.
Layer 2 Solutions: These enhance scalability by processing transactions off-chain before settling on Ethereum’s mainnet.
Proof of Stake (PoS): Ethereum transitioned from Proof of Work to PoS with Ethereum 2.0 (The Merge), improving energy efficiency.
Fundamental Outlook:
Strong institutional adoption with ETFs and large-scale integrations.
Continuous upgrades and scaling solutions aim to reduce gas fees and improve throughput.
Growing ecosystem with thousands of dApps, developers, and users.
Current Price and Market Position
Ethereum (ETH) remains the second-largest cryptocurrency by market capitalization after Bitcoin.
Price movements are influenced by technological upgrades, market sentiment, regulatory developments, and macroeconomic conditions.
Ethereum continues to be a foundational platform for blockchain innovation, powering a broad ecosystem of applications and services
#ethereum
