Ethereum (ETH/USD) Technical Analysis - Key Levels and TrendsThis chart analyzes Ethereum's price action on the timeframe using TradingView. Key support levels are identified at , with resistance at . The chart highlights showing signals. Potential breakout or reversal zones are marked, with volume trends indicating momentum. Watch for for confirmation of the next move. Always manage risk and stay updated with market news.
Trade ideas

ETH Game Plan – DLRMD ModelETH Game Plan – DLRMD Model
📊 Market Sentiment
The FED has resumed its rate-cutting cycle with a 0.25% cut in September and two more expected in the coming months. Institutional liquidity inflows are accelerating as the U.S. officially adopts crypto as part of its reserves. While inflation remains elevated, a weakening labor market is pushing the FED to ease, channeling more capital into risk-on assets such as crypto.
📈 Technical Analysis
ETH ran the weekly swing low and closed above, signaling a shift in structure. A strong daily structure break followed, forming a fresh daily demand zone. The first tap into this demand zone resulted in a solid rejection — confirming its validity.
Afterward, price briefly deviated above the lower time frame bearish trendline, then retraced back, showing potential accumulation before the next leg up.
📘 Model to be used – HTF Demand w/ Liquidity Run & Max Discount Zone (DLRMD Model)
1-Identify the HTF trend and take setups only in that direction.
2-Mark the active HTF demand zone.
3-Confirm liquidity sweep within that zone.
4-Use Fibonacci retracement to locate the 0.75 max discount area.
5-Wait for LTF confirmation before entering.
📌 Game Plan
I’ll be waiting for price to return and retest the daily demand zone, ideally running the 12H swing liquidity at $4,090 and tapping the 0.75 max discount zone around $4,050 before considering entry.
🎯 Setup Trigger
4H structure break confirmation after price taps the $4,050 level.
📋 Trade Management
Entry: $4,050 (expected zone)
Stoploss: Below the 4H swing low that breaks structure
Targets:
TP1: Bearish trendline retest (≈$4,445)
TP2: All-time high (≈$4,965)
Once TP1 is reached, I’ll move stoploss to breakeven and manage partials actively.
💬 Like, follow, and comment if this breakdown supports your trading! More setups and market insights coming soon — stay connected!
⚠️ Disclaimer: This content is for informational and educational purposes only and does not constitute financial, investment, or trading advice. Always DYOR before making any financial decisions.

ETH BOTTOMETH BOTTOM 97% confidence is in. no need to go lower.
It has my blessings and permissions to run higher from here.

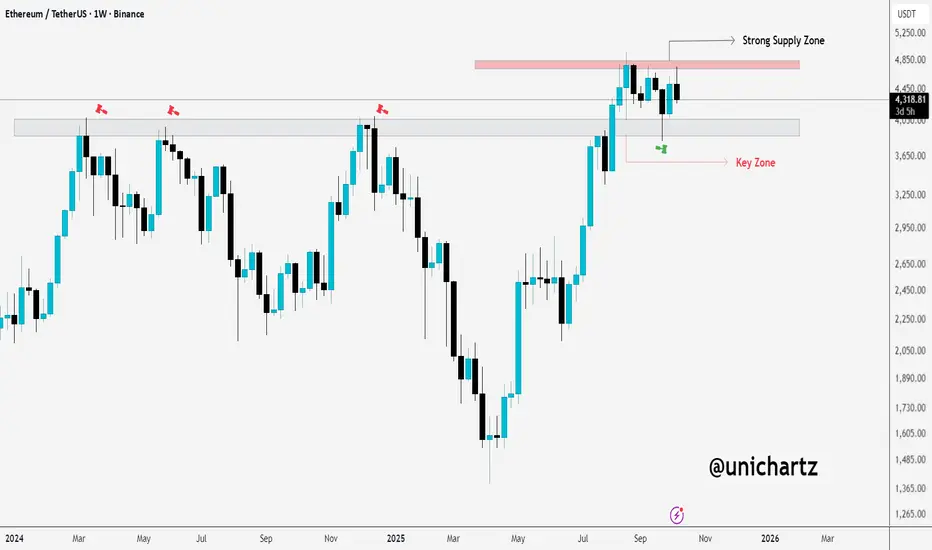
ETH: Critical Levels to Watch Now!The chart shows Ethereum ( CRYPTOCAP:ETH ) on the weekly timeframe, and we're currently at a crucial point. Ethereum is approaching a strong supply zone around $4,800, which has acted as a resistance level in the past. This suggests that the price could face selling pressure in this range. If Ethereum fails to break through this level, it might experience a pullback or sideways movement.
On the other hand, the key zone around $4,100 is providing current support. As long as this level holds, there is potential for Ethereum to attempt another move upwards toward the supply zone at $4,800. However, if the price breaks below this key support zone, we could see a deeper pullback, possibly targeting lower support levels.
#PEACE
Stay tuned for more update
Eth finally So the thing is if you're trading only use what you can afford to lose
I posted this earlier about chart not clear but also looking like a break and retest
If you check my earlier post
So I entered on the break and retest using what I can afford to lose as usuall
And we did it
If you took the trade congratulations 💯

ETH - Updated ChartHere is an update to our two previous posts:
ETH perfectly bounced from our "First Key Test" to our original green trendline we pointed out would act as a new level of selling pressure.
Price did respect this green trendline as a new resistance level for many days until having a false breakout above to test the "Supply Zone".
Upon getting rejected at the Supply Zone (Red Box), price broke back below our green trendline, reclaimed it as resistance, and has fallen more.
What's next? Will have another post following this update.

Hunting a eth bounceLooking for eth bounce... Eth got its first support bounce. Waiting for the retest. before entering long.
Buy On Dippers Beware: The Identify TrapNOTE – This is a post on mindset and emotion. It is not a trade idea or system designed to make you money. My aim here is to help you preserve your capital, energy, and focus so you can execute your own trading system with calm and confidence.
“Buy the dip” has become part of trading folklore.
But for many, it’s not just a strategy, it's a statement of self.
You’ve been rewarded for it before.
You’ve built confidence on seeing value where others saw panic.
Each time it worked, it reinforced a powerful story:
“This is what I do. This is who I am.”
So when price drops, that instinct fires fast.
You tell yourself you’re being disciplined - waiting for the next opportunity.
But often, something deeper is happening.
THE IDENTITY BEHIND THE DIP BUYER
Surface story:
“I’m the one who spots opportunity when others panic.”
“I’m disciplined. I buy when others are afraid.”
It sounds like confidence. But beneath that surface sits a hidden driver…
“I am only good when I’m right.”
“I am valuable because I can see what others can’t.”
“If this doesn’t work, what does that say about me?”
What's going on here is ego preservation .
WHAT’S REALLY DRIVING IT
Emotion: Defiance a need to prove that you know what you’re doing, and that you’re right.
Impulse: Reclaim certainty through action.
Underlying belief: “I know how this game works. I’ve done this before.”
It feels like conviction, but it’s really an attempt to confirm that as a trader you are generally always right. Remember though, markets broadly trend only 30% of the time so the chances of being wrong may be higher.
THE RISK
When markets shift regime, identity-based trading becomes dangerous.
You stop trading what’s in front of you and start defending the idea of you
Overconfidence, stubbornness, refusal to adapt can all be disguised as “discipline.”
The more attached you are to the identity , the harder it becomes to see the reality of what is.
THE REFRAME
Next time you feel the pull to “buy the dip,” pause and ask:
“Am I trading what I see or am I trading what I want to happen?
REFLECTION
If this feels familiar, take a moment to notice what being right means to you.
For some, it’s safety.
For others, it’s significance.
Either way awareness is where change begins.
By the way - since Non Farm is still scheduled to be released tomorrow (10th October) here's a link to the most recent post on preparing your mindset for NFP for anyone that's curious.
I also just noticed after posting this that the there's a great post on buy the dip from TradingView itself - for anyone wanting to get into the technicals a bit more

ETH long to 4506The Bearish Candlestick and Volume aren't strongdecline cannot continue cannot continue
so Long now to 4506

ETH/USDT: Two shortsHi guys!
Overall Market Structure
The price has been moving within a rising parallel channel, making higher highs and higher lows, which forms a bullish structure.
Recently, however, the price broke below the lower boundary of the ascending channel, signaling a potential bearish reversal or a correction phase.
The recent bounce toward the previous channel support (now resistance) forms a potential short entry zone.
📉 Short Position 1 (Aggressive Entry)
Entry: Around $4,485–$4,500
Reasoning: Price retested the broken channel support line (now acting as resistance).
Stop-Loss: Above $4,575, just beyond recent swing high/structure break.
Take-Profit: Around $4,345.
Risk–Reward: Approx. 1:2
📉 Short Position 2 (Conservative Entry / Continuation Setup)
Entry: After a confirmed lower high and bearish candle close below $4,450.
Reasoning: Confirms momentum shift toward the downside.
A break and retest of $4,345 support could open the way to $4,090, the next demand zone.
Stop-Loss: Above $4,510 (recent minor resistance).
Take-Profit: Around $4,090 (bottom of marked green area).
Risk–Reward: Approx. 1:3 or higher

$ETH Ethereum is currently in a corrective phase after failing to hold above the 4,480 USDT resistance zone. Market structure has shifted from bullish momentum to short-term distribution, indicating that sellers are gaining control. The supply area between 4,450–4,500 remains the key resistance that must be reclaimed to restore a bullish bias.
As long as the price trades below this zone, the downside potential toward the 4,170–4,100 demand area remains likely. This level is expected to attract buyers for a possible short-term rebound before a new trend develops.

ETH 4H Trade ideaHere is an idea on how you can plan your trade in advance.
CRYPTOCAP:ETH key buying level with SL & TPs are given. RR is excellent of 2.2.
NFA DYOR.

ETH/USD Short Trade Idea on S/R FlipIt looks like ETH has done a S/R Flip and is now trying to come down.
If it breaks the level of 4395, we can take a 1:1 Short Trade here. Let's see how it goes.

ETH-USDTThere was a pullback to the $226 level 🔽
If the trend line is broken, the correction could continue to the two green supports
The main and important support is around $200

ETHEREUM will holdEthereum has 2 supports in 4H timeframe with bullish divergence on RSI, and I think it will bounce from those areas

The U.S.–China Trade WarIntroduction
The U.S.–China trade war, one of the most significant economic confrontations in modern history, represents far more than a dispute over tariffs and trade imbalances. It is a geopolitical and economic conflict between the two largest economies in the world—one an established superpower, the United States, and the other, China, an emerging global powerhouse. At its core, the trade war reflects deeper struggles over technology, global influence, intellectual property rights, and the future architecture of the global economy.
Beginning officially in 2018 under the administration of U.S. President Donald Trump, the trade war disrupted global supply chains, affected billions of consumers, and redefined international trade relations. The tariffs imposed by both sides reshaped business decisions, investment patterns, and economic strategies across the globe. Although several rounds of negotiations and partial deals have attempted to ease tensions, the rivalry persists, influencing trade policy, economic planning, and diplomacy even into the mid-2020s.
This essay explores the origins, dynamics, and far-reaching consequences of the U.S.–China trade war. It examines the historical background, economic and political motivations, key developments, global reactions, and long-term implications for international trade and economic order.
1. Background: U.S.–China Economic Relations Before the Trade War
1.1 The Rise of China as a Global Economic Power
Over the past four decades, China’s economic transformation has been nothing short of remarkable. Following economic reforms initiated by Deng Xiaoping in 1978, China transitioned from a centrally planned system to a market-oriented economy. The nation’s entry into the World Trade Organization (WTO) in 2001 marked a turning point, integrating China into the global trading system and allowing it to become the “world’s factory.”
China’s GDP grew at an average of 9–10% annually for decades, lifting hundreds of millions out of poverty. Its exports—ranging from low-cost manufactured goods to high-tech products—flooded global markets. By 2010, China surpassed Japan to become the world’s second-largest economy.
1.2 The U.S.–China Trade Relationship
For decades, the U.S. and China maintained a mutually beneficial, though increasingly unbalanced, trade relationship. The United States became China’s largest export market, while American companies gained access to cheap Chinese manufacturing and labor. However, this relationship created large trade imbalances. By 2017, the U.S. trade deficit with China exceeded $375 billion, the largest bilateral trade deficit in the world.
While American consumers benefited from lower prices, U.S. policymakers and industries grew concerned about lost manufacturing jobs, intellectual property theft, and China’s alleged unfair trade practices. These issues planted the seeds of economic confrontation that would later erupt into a full-scale trade war.
2. Causes of the U.S.–China Trade War
2.1 The Trade Imbalance
A central grievance of the U.S. was the massive trade deficit with China. The Trump administration viewed this imbalance as evidence that trade relations were unfair and that China was manipulating the system to its advantage. While economists argue that trade deficits are not inherently harmful, politically, the deficit symbolized lost jobs and weakened American industries.
2.2 Intellectual Property and Technology Theft
Another major factor was the alleged theft of intellectual property (IP). The U.S. accused China of forcing American companies operating in China to transfer technology as a condition of market access. Reports suggested that Chinese firms benefited from stolen U.S. trade secrets, patents, and software, particularly in advanced sectors like aerospace, semiconductors, and biotechnology.
2.3 “Made in China 2025” Strategy
China’s “Made in China 2025” initiative, launched in 2015, aimed to transform the country into a global leader in advanced manufacturing and high-tech industries such as robotics, AI, and renewable energy. The U.S. perceived this policy as a direct challenge to American technological dominance and economic leadership. Washington feared that China’s state-led industrial policies would tilt global competition unfairly.
2.4 Currency Manipulation Accusations
The U.S. also accused China of artificially devaluing the yuan to make Chinese exports cheaper and imports more expensive, thereby maintaining its export competitiveness. Although this accusation has been debated, it contributed to the perception that China was manipulating market dynamics to gain an advantage.
2.5 Political and Strategic Rivalry
Beyond economics, the trade war was deeply rooted in strategic competition. The U.S. viewed China’s growing influence in Asia, its Belt and Road Initiative, and its military modernization as a challenge to American global dominance. Thus, the trade conflict became a proxy for broader geopolitical rivalry.
3. Timeline of Key Events
3.1 2018: The War Begins
March 2018: The U.S. imposed tariffs on steel (25%) and aluminum (10%) imports, targeting China among other nations.
April 2018: China retaliated with tariffs on $3 billion worth of U.S. goods, including agricultural products.
July 2018: The U.S. imposed 25% tariffs on $34 billion worth of Chinese goods. China responded in kind.
September 2018: The U.S. levied tariffs on $200 billion worth of Chinese imports, prompting further Chinese retaliation.
3.2 2019: Escalation and Negotiations
May 2019: Trade talks broke down, and the U.S. increased tariffs on $200 billion of Chinese goods from 10% to 25%.
August 2019: The U.S. labeled China a “currency manipulator.”
December 2019: Both nations agreed on a “Phase One” trade deal, easing tensions.
3.3 2020: The Phase One Deal
The Phase One Agreement, signed in January 2020, required China to purchase an additional $200 billion in U.S. goods over two years and improve intellectual property protections. However, the COVID-19 pandemic disrupted trade flows, and China failed to meet its purchase commitments.
3.4 2021–2024: Lingering Tensions
Even after President Joe Biden took office, most tariffs remained in place. The administration maintained a tough stance on China, focusing on strategic decoupling, technology restrictions, and alliances with other democratic nations to counter China’s rise. The U.S. CHIPS and Science Act (2022) and export controls on semiconductors further intensified competition.
4. Economic Impact of the Trade War
4.1 Impact on the U.S. Economy
The trade war had mixed effects on the American economy.
Manufacturing and Agriculture: U.S. manufacturers faced higher input costs due to tariffs on Chinese components, while farmers suffered from China’s retaliatory tariffs on soybeans, pork, and corn. The U.S. government provided billions in subsidies to affected farmers.
Consumers: American consumers paid higher prices for goods such as electronics, clothing, and furniture. Studies by the Federal Reserve and academic institutions found that most tariff costs were passed on to U.S. consumers.
Employment: While some domestic industries benefited from tariff protections, others faced uncertainty, layoffs, and reduced investment.
4.2 Impact on the Chinese Economy
China also faced significant challenges:
Export Decline: Chinese exports to the U.S. fell, forcing many manufacturers to seek alternative markets.
Economic Slowdown: China’s GDP growth slowed from over 6% in 2018 to around 5% in 2020.
Currency Fluctuations: The yuan depreciated during the height of the trade war, cushioning export losses but signaling instability.
Policy Response: China implemented fiscal stimulus measures and accelerated domestic innovation to reduce reliance on U.S. technologies.
4.3 Global Impact
The trade war had global ripple effects:
Supply Chains: Many multinational companies diversified production away from China to countries like Vietnam, India, and Mexico.
Commodity Markets: Global demand fluctuations affected prices for oil, metals, and agricultural goods.
Stock Markets: Trade tensions fueled market volatility and investor uncertainty.
Global Growth: The International Monetary Fund (IMF) estimated that the trade war shaved 0.8% off global GDP by 2020.
5. Technological Competition and Decoupling
5.1 The Technology Frontline
Technology became the heart of the trade war. The U.S. targeted Chinese tech giants like Huawei and ZTE, citing national security concerns. Restrictions were imposed on the export of American semiconductors, software, and equipment to Chinese firms. The U.S. also pressured allies to exclude Huawei from 5G networks.
5.2 Semiconductor and AI Race
Semiconductors emerged as the most critical battleground. The U.S. sought to limit China’s access to advanced chips used in artificial intelligence and defense systems. In response, China invested heavily in building its domestic semiconductor capabilities, aiming for technological self-sufficiency.
5.3 Digital Decoupling
The concept of “decoupling”—separating U.S. and Chinese technological ecosystems—gained traction. This shift included restrictions on data sharing, investment screening, and the creation of alternative technology supply chains. While full decoupling remains unlikely, the trend has reshaped the global tech landscape.
6. Political and Strategic Dimensions
6.1 Nationalism and Domestic Politics
In both countries, nationalism played a major role. In the U.S., the trade war was framed as a battle to protect American jobs and sovereignty. In China, the government used the conflict to rally domestic support and promote economic self-reliance under slogans like “dual circulation” and “national rejuvenation.”
6.2 Global Alliances and Power Shifts
The trade war pushed countries to reassess alliances and trade policies. The European Union, Japan, India, and ASEAN nations found themselves balancing relations between the U.S. and China. Many nations benefited from supply chain diversification, attracting new investments as companies sought alternatives to China.
6.3 The New Cold War Narrative
Many analysts have described the trade war as part of a broader “New Cold War”—an ideological, technological, and strategic struggle between democratic capitalism and authoritarian state capitalism. Unlike the U.S.–Soviet Cold War, however, the U.S. and China remain economically intertwined, creating a complex interdependence.
7. Lessons Learned and the Future of Global Trade
7.1 The Limits of Tariffs
The trade war demonstrated that tariffs alone cannot resolve complex structural issues. While they exerted pressure, they also harmed domestic stakeholders and disrupted global commerce. Both economies remained resilient but not without cost.
7.2 The Shift Toward Protectionism
The conflict accelerated a broader global shift toward economic nationalism and protectionism. Countries began to prioritize domestic production, strategic autonomy, and resilience over globalization. The COVID-19 pandemic further reinforced this trend.
7.3 The Redefinition of Global Supply Chains
Multinational corporations began adopting a “China + 1” strategy—maintaining operations in China while expanding production elsewhere. This diversification has benefited emerging economies like Vietnam, India, and Indonesia.
7.4 The Rise of Technological Sovereignty
Both nations are pursuing technological sovereignty—control over critical technologies like semiconductors, 5G, and AI. This race will define future power dynamics more than traditional trade measures.
8. The Way Forward
8.1 Diplomatic Engagement and Cooperation
Despite tensions, cooperation remains essential on global issues like climate change, cybersecurity, and pandemic response. Constructive dialogue and adherence to multilateral institutions such as the WTO can prevent further escalation.
8.2 Economic Rebalancing
Both nations must address the structural causes of imbalance. The U.S. should invest in innovation, education, and industrial competitiveness, while China should open markets, reform state enterprises, and enhance transparency.
8.3 The Role of Multilateralism
Global trade institutions need reform to reflect modern economic realities. A rules-based system that ensures fair competition and technological collaboration is crucial for global stability.
Conclusion
The U.S.–China trade war is more than a dispute over tariffs or trade deficits—it is a defining conflict of the 21st century that encapsulates the struggle for global leadership in economics, technology, and ideology. While both nations suffered short-term losses, the deeper consequence has been a reconfiguration of the global economic order.
The trade war accelerated shifts toward protectionism, technological nationalism, and supply chain diversification. It exposed vulnerabilities in global interdependence and highlighted the need for a balanced approach between competition and cooperation. As both the U.S. and China continue to shape the post-globalization era, the rest of the world watches closely, adapting to the new reality of multipolar economic power.
Ultimately, the future of global prosperity depends not on economic warfare but on how effectively the two giants can coexist—balancing competition with collaboration, and rivalry with responsibility. Only through a stable and fair trade environment can sustainable global growth be achieved in the decades ahead.

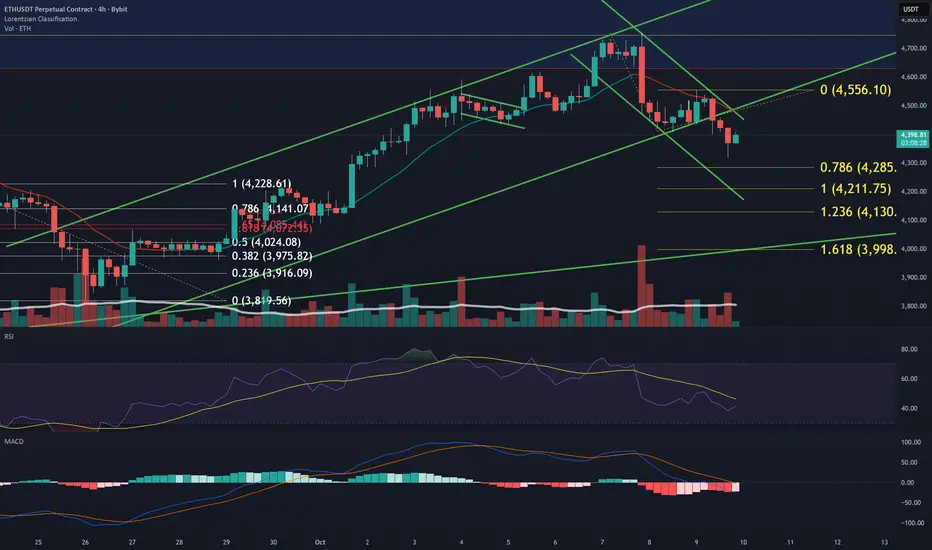
Ethereum Corrects Toward Fibonacci Support Ethereum rejected the 0.786 Fibonacci level near $4,779, triggering a short-term correction, yet market structure remains bullish across higher time frames.
After reclaiming the $4,588 range, ETH is now consolidating below resistance. If VWAP support fails, price could extend its correction into the 0.618 Fibonacci region, clearing liquidity before resuming higher.
The broader uptrend remains intact, marked by consistent higher lows and strong momentum across major time frames. Current movement appears corrective, allowing for potential accumulation before the next rally phase.
What to Expect:
If ETH holds above the 0.618 level, a bullish rotation toward $4,779 and eventually $5,000 remains probable. Losing that support could delay recovery but would not invalidate the larger bullish bias.
ETH LONG - Bullish reversal anticipation
On the H1 timeframe, a Market Structure Shift (MSS) has been observed, indicating a potential change in trend direction and establishing a bullish bias following a sweep of the previous day’s low (PDL).
We are currently anticipating a retracement towards a potential buy zone, specifically around the 0.6182 Fibonacci retracement level.
This level is further supported by confluence from a visible imbalance, an unfilled Fair Value Gap (FVG) on the M5 chart within the same price region.
Additionally, on the M15 timeframe, the closure of a series of bearish (down-close) candles during the retracement phase suggests a possible bullish reversal setup.
Moreover, there is a clear draw on liquidity (DOL) on the buyside, supported by an unfilled imbalance on the H1 chart (Sell-side Imbalance Buy-side Inefficiency – SIBI) in alignment with a cluster of equal highs (EQ highs). This strengthens the bullish case, as price may seek to target this liquidity resting above.
I am expecting price to be manipulated towards our POI during NY session open.
Our strategy will be to monitor price action closely as it approaches the point of interest (POI), the M5 unfilled FVG for signs of a favorable reaction before considering any entries. 🧑💻 🎯
Will keep you updated on this trade , talk to you soon !

ETH Second retest completed soon above 5.5KThe major resistance which was red trendline broke successfully and now price did complete retest there and soon we can expect more gain and rise here to the 5500$ at least and even 7000$.
DISCLAIMER: ((trade based on your own decision))
<<press like👍 if you enjoy💚

ETHUSDTPersonally I don't see a clear trade on this
Although I short from top but I'm out cuz I think we might still see a move upward
Let's see how BTC moves
Note: don't force a trade if you don't see a clear entry
Stay out

#ETHUSDT 4H ChartPrice is currently sitting on the EMAs and consolidating on lower timeframes after getting rejected off our 6h supply zone and leaving another 4h supply at $4,650. MACD is showing bearish weakness, RSI is sold and EMAs are bullish. Price should tap into the 4h supply zone before potentially retracing again.

ETH - UPDATECRYPTOCAP:ETH - price update: 5000$+ next? 👀📈
Let's keep it simple and not change the plan.
🟩Weekly candle close above 5000$ could confirm price discovery mode 📈
🟨Double top resistance under 4950$ & rejection possible.
Bullish momentum building above 3800$, exactly as predicted (50% fib test) (correction) to grab liquidities & confirm potential new uptrend + ATH breakout.
The best to do for me is to keep an eye on the consolidation area: 4800$ - 3800$ to track the next big wave!
Without breakout confirmation, price could move on both side for now.
Overall, as long as the monthly and weekly candle remain above 3780$, bulls are in control.
Key levels:
4950 - 4840 - 4750 - 4400 - 4350 - 4230 - 4090 - 3850 -3800 - 3560 - 3200

ETH - UPDATE - MASTERCLASSCRYPTOCAP:ETH - 22/09 vs today: Update - MASTERCLASS 🔥
"Still bullish medium/long term, but a further correction is very possible before liftoff!
Bulls need to hold $3780. Below = trouble…Above = game still on for ATH attempts later. 📉"
Insane setup shared if you followed! 3800$ liquidities grab ✅
Prices is up 23%+ from this zone mentionned! 🔥
Are we ready to fly toward 5000$ now??
I'll let you discover on the next analysis Im working on!
Life if you want to see it! 👍
