ETH HTF Butterfly HarmonicAs we can see, the Elliott Wave count for wave (V) is still incomplete. Combined with the Butterfly harmonic pattern, this suggests a target price in the range of $5,900–$6,400. The invalidation level is if wave (4) overlaps with the top of wave (1).
Trade ideas

Be careful with ETHEREUM !!!Currently, our only dynamic support is the bottom of the channel. If the price respects this level, it could move upward. However, if this support is lost, the next support for Ethereum would be the PRZ (Potential Reversal Zone) area.

eth big short Carry trading, where investors borrow in a low-interest currency to invest in high-yield assets like Ethereum, has sparked concerns about potential price declines in the cryptocurrency. With the Federal Reserve announcing that interest rates will remain fixed until March 2026, how does this affect Ethereum’s outlook?Fixed interest rates typically stabilize borrowing costs, encouraging carry trades to persist. Investors may continue leveraging low-cost loans to buy Ethereum, potentially supporting its price in the short term. However, if market volatility spikes—due to geopolitical events or crypto-specific factors—carry trades could unwind rapidly. This would lead investors to sell Ethereum to cover loans, creating downward price pressure.Ethereum’s high liquidity makes it a prime target for such strategies, amplifying its vulnerability. Recent data shows Ethereum’s price dipped 3% last week amid broader market uncertainty, hinting at sensitivity to carry trade dynamics. While fixed Fed rates may delay aggressive unwinding, any sudden shift in sentiment could still trigger sales.On the other hand, Ethereum’s strong fundamentals—its role in DeFi, NFTs, and upcoming upgrades—may mitigate some risks. Nonetheless, investors should remain cautious, as carry trade liquidations could still impact prices before March 2026, especially if volatility rises.In conclusion, fixed Fed rates until March 2026 may provide temporary stability for Ethereum, but carry trading risks persist. Monitoring market sentiment and volatility is crucial for investors.

#ETHUSDT 4H ChartPrice is currently ranging inside the 6h supply zone after getting rejected from the 100MA. MACD is showing bullish weakness, RSI is bought and EMAs are neutral. Price needs to break and close above this supply zone in order to expect further bullish movements towards the 6h supply at $4,450.

Ethereum Price Bounces Off 7-Week Low—Future Still Promising?Ethereum trades at $4,187, just under the $4,222 resistance level after rebounding from a $3,872 low. This recovery highlights buyer interest at support levels. However, the broader market remains cautious, waiting to see whether Ethereum can sustain momentum and reclaim critical price barriers.
If Ethereum breaches $4,222, it could flip this level into support, potentially extending gains. Still, breaking above $4,500 will be difficult without fresh inflows. Limited liquidity and investor hesitation could keep Ethereum rangebound, consolidating until stronger catalysts emerge in the market.
On the downside, failure to maintain support could reignite bearish sentiment. If selling intensifies, Ethereum might slip through $4,074 and retest $3,872. Such a decline would invalidate the bullish outlook.

ETHUSDT.PThe setup has been marked. Personally waiting for the retesting with strong volume before getting in the trade.
Keep supporting guys keep following please.

ETH : Accumulation Before Next Big Rally??Ethereum continues to show strength on the weekly timeframe.
Weekly structure remains firmly bullish, IMO. Pullbacks are natural, but the weekly structure favors continuation.
Weekly closing about 4.2-4.3K could trigger massive rally on weekly TF.
Chart is self explanatory. This is purely my interpretation of the chart and it could go wrong.
Note: This post reflects my personal views for educational purposes. It is not financial advice. Always DYOR before making any and every decision.

Eth/usdt Technical Outlook📊 ETH/USDT Technical Outlook
Current Price: $4,157
Resistance Zones:
• $4,400 – first major test, aligned with short-term supply and 20/50-day MAs
• $4,550 – $4,600 – stronger resistance, breakout level for bullish continuation
Support Zones:
• $4,000 – psychological level & local structure support
• $3,900 – critical floor; a break here could accelerate downside to $3,600
Trend & Moving Averages: ETH is trading below its 20- and 50-day moving averages, showing short-term selling pressure. Trend remains bullish on higher timeframes but under consolidation.
Momentum (RSI): Neutral-to-slightly bearish, not oversold, meaning ETH has room to either break down further or rebound.
Scenarios:
🔻 Bearish: If ETH loses $4,000–$3,900 support, expect selling pressure toward $3,600.
🔺 Bullish: A strong daily close above $4,400 would shift momentum, with the next target at $4,550–$4,600. Sustained breakout could open path toward $4,800.

ETH market snapshotETH has so far failed to break and hold above the key resistance at 4200. We remain within the local downtrend, and the chances of testing 3500 are increasing

We're setting up for the greatest Q4 for Ethereum $ETH so farMy CRYPTOCAP:ETH thesis is slowly playing out
Waiting for one more confirmation (reclaiming 4250 resistance), and we're setting up for the greatest Q4 so far for Ethereum
I'll be buying the dips with SL below the current HTF deviation low at ~3830
A bit more patience here, let it play out, don't rush it

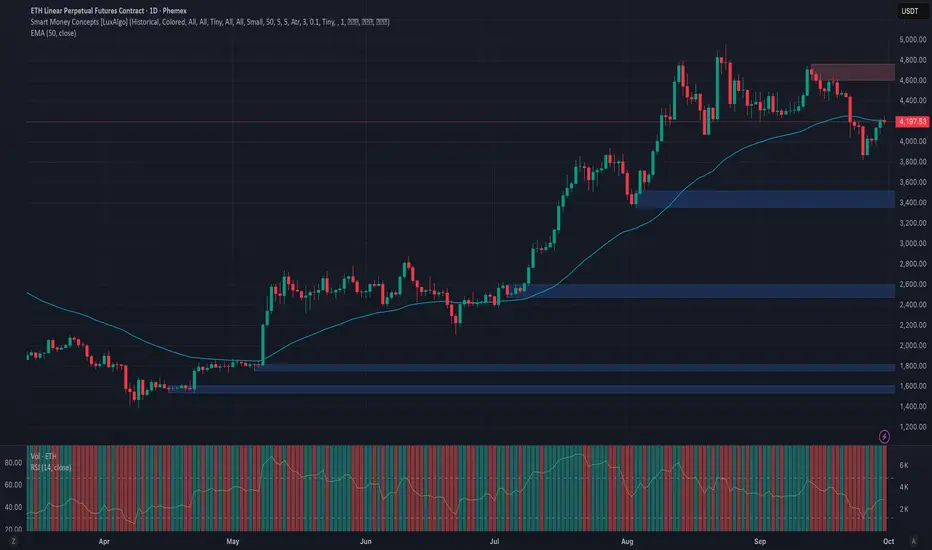
Phemex Analysis #107: Pro Tips for Trading Ethereum (ETH)Ethereum (ETH) has pushed back into the spotlight after shaking off early‑summer weakness and reclaiming the psychological $4,000 handle. With price now hovering near $4,200, buyers have stepped back in and the daily chart shows a clean sequence of higher lows—story beats that often precede a decisive move. The question on every trader’s mind: does ETH press higher from here, or does it need one more reset before the next leg?
Possible Scenarios
1) Bullish Breakout — momentum carries above nearby supply
If ETH can extend above the immediate supply zone (watch the $4,300–$4,350 band) on rising volume, a trend continuation opens toward $4,500 and a stretch into $4,800.
Pro Tips:
Entry: Look for a strong daily close through $4,350 or a break‑and‑retest that holds as support.
Risk: Initial stop below the breakout zone (~$4,000), then trail under higher lows.
Profit‑taking: Scale out into $4,500 and $4,800 while leaving a runner if momentum expands.
2) Range & Accumulation — base building above $4,000
ETH may continue to coil between $4,000 support and $4,350 resistance while the market digests macro cues and liquidity rotates across majors.
Pro Tips:
Plan the box: Accumulate near $4,000, lighten up into $4,300–$4,350.
Avoid the middle: Wait for edges; don’t chase mid‑range noise.
Watch volume: Expansion at range edges often telegraphs the break direction.
3) Bearish Pullback — liquidity sweep into deeper supports
Failure to hold $4,000 on heavy sell volume invites a deeper flush toward $3,750 and, in a heavier risk‑off tape, $3,500.
Pro Tips:
Defense first: Cut risk on a decisive daily close below $4,000.
DCA with discipline: Long‑term bulls can consider staggered bids only after stabilization (shrinking candles, waning sell volume, higher‑low attempts) near $3,750 / $3,500.
Re‑entry tells: Look for momentum divergences or a strong reclaim of $4,000 to re‑engage.
Conclusion
ETH sits at a pivotal zone with a clear if/then map:
If $4,350 breaks and holds → ride the trend toward $4,500–$4,800.
If the range persists → harvest the $4,000–$4,350 box with tight risk.
If $4,000 fails → wait for stabilization at $3,750 / $3,500 before redeploying.
Anchored by deep liquidity, relentless builder activity, and a maturing staking and L2 ecosystem, Ethereum remains the market’s bellwether. Trade the levels, respect the tape, and let structure—not emotion—drive your decisions.
🔥 Tips:
Armed Your Trading Arsenal with advanced tools like multiple watchlists, basket orders, and real-time strategy adjustments at Phemex. Our USDT-based scaled orders give you precise control over your risk, while iceberg orders provide stealthy execution.
Disclaimer: This is NOT financial or investment advice. Please conduct your own research (DYOR). Phemex is not responsible, directly or indirectly, for any damage or loss incurred or claimed to be caused by or in association with the use of or reliance on any content, goods, or services mentioned in this article.
Ethereum (ETH): Bounced Strong & Re-Testing EMAs | BullishETH bounced strongly from the oversold zone, and the recovery candle looks like a reaction to a liquidity grab rather than an actual dump. Price is now pushing back above EMAs, similar to the previous setups we saw in August (althought this time is is a little different)
The key now is a successful re-test of this reclaimed zone. As long as buyers hold structure and manage to break the zone of EMAs, the next step is continuation toward the $5,555 target.
Swallow Academy

ETH climbs toward key resistance in rising channelThe ETH/USDT 4‑hour chart shows a recovery rally unfolding within a broader downtrend. After a sharp decline earlier in September, prices have been climbing in a rising channel, while still respecting the boundaries of a larger descending channel. Short‑term momentum has shifted bullishly as higher highs and higher lows form inside this smaller channel, and trend indicators suggest strengthening buyers.
Upcoming U.S. economic releases—non‑farm payrolls, the Consumer Price Index, and the Federal Reserve’s October meeting—could inject volatility into the crypto market. These events often alter investor expectations for interest rates and risk assets, so traders should be prepared for sudden swings.
Trade view: A bullish setup would involve waiting for a decisive break and retest above recent highs in the rising channel, with targets at the next major resistance area. A bearish setup would trigger if the asset falls below the rising channel’s base, aiming for the previous swing low and then the broader channel floor. In both cases, stops should be placed just beyond the invalidation level, and risk‑to‑reward ratios should be kept favorable.
Overall, ETH remains in a corrective rebound within a longer‑term downtrend. A confirmed breakout from this pattern could signal a larger upside move, while failure to hold the current support zone might send prices back toward prior lows.

[SeoVereign] ETHEREUM BEARISH Outlook – September 30, 2025Hello everyone,
As of September 30, I would like to share my perspective on an Ethereum short position.
At present, I believe that Bitcoin, among others, still has one more downward wave remaining. Therefore, I am closely monitoring Bitcoin’s movement to capture the timing of its bearish reversal. Given that Bitcoin is likely to enter a declining phase, I am presenting a bearish scenario for Ethereum as well.
The basis of this idea is relatively clear: the entire structure is formed according to the classical ratio relationships of Elliott Wave Theory. All detailed ratios and projections have been drawn on the chart for your reference.
-Ratio Relationships
1. WAVE.C = WAVE.A * 1.618
2. WAVE.C = WAVE.A * 0.786
3. WAVE.C = WAVE.A * 1.272
The average target price for this decline is set around 4030 USDT.
As always, I will continue to share updates on position management based on this idea as the chart develops.
Thank you for reading.

Ethereum (ETH) – Bounce From $3,800 Reclaims Daily SupportEthereum has bounced strongly from $3,800, a level backed by the 0.618 Fibonacci and VWAP
ETH’s correction into $3,800 found immediate buyer interest, marked by an engulfing candle that confirmed market strength. Despite a lack of immediate follow-through, the setup has reinforced confidence in the bullish trend.
Key Technical Points:
- Bounce from $3,800 confluence zone (Fibonacci + VWAP).
- Bullish engulfing candle reinforced strength at support.
- Daily support reclaimed, opening path toward $4,950.
The $3,800 region served as a critical pivot for Ethereum. Price respected this zone and rebounded with strong momentum, confirmed by a bullish engulfing close. The reclaim of daily support marks a structural improvement, creating conditions for continuation.
Volume and follow-through remain key. Sustained buying pressure above current levels would confirm the bullish bias and open the door to higher targets. Failure to hold daily support would weaken sentiment and expose ETH to another corrective move.
What to Expect in the Coming Price Action:
As long as ETH trades above daily support, a rally toward $4,950 is the likely scenario. Losing this level would reduce bullish confidence and reopen downside risk.

Double Tops = LIES. Market Structure is a ScamRetail traders call it resistance.
Smart money calls it liquidity.
This is why price comes back to the highs
Not for confirmation. But for your stop loss.

ETH/USDT Buy-Stop on 1H, Bullish Trend + Bullish DivergenceEther is showing a Bullish Trend on 1H Timeframe. Recently, it also showed a Bullish Divergence on same timeframe. However, there is a slight resistance ahead as well.
So, we can take the risk of taking a 1:1 risk-to-reward "Buy" trade here. Let's see how it goes.
29-09-25
Monday

Ethereum Recovery: Watching 4,229 for Bullish ConfirmationAt the moment, Ethereum is also showing recovery, but at a slower pace compared to Bitcoin. This week’s pivot point is at 4,137 , and the price is currently trading above it.
A local correction would be reasonable, with support expected in the 4,050 – 4,000 range. There’s also an ascending trendline acting as support. The risk level is 3,966 — if it breaks and the price fails to reclaim it, the likelihood of continued downside increases.
A breakout above 4,229 and consolidation would bring back a bullish outlook.

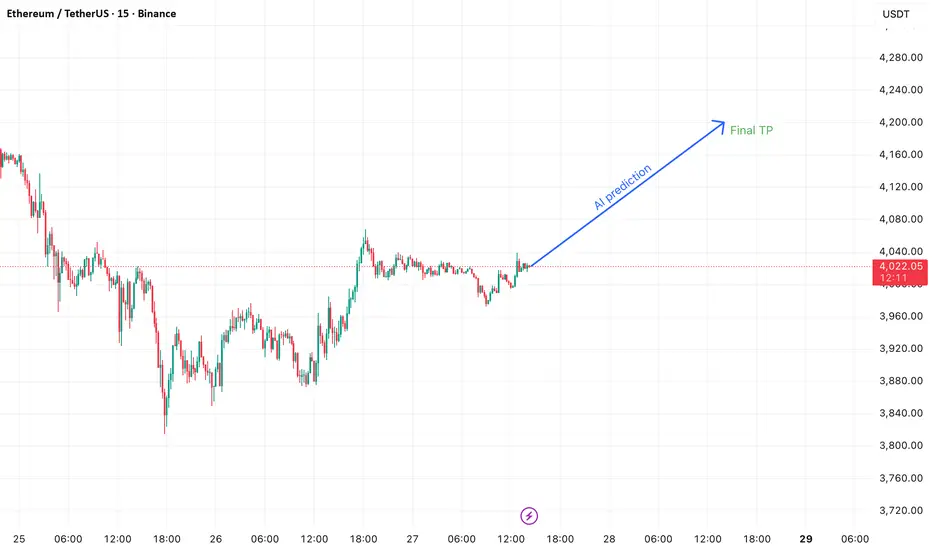
Deep Learning Model for 24-Hour ETH Price PredictionHi everyone,
I’ve developed a deep learning AI model designed to predict ETH’s price movement over the next 24 hours on the 15-minute timeframe.
It’s important to note that this model does not directly provide exact entry points for trades. Instead, it indicates the likely direction of the market, meaning you’ll still need basic trading knowledge to apply it effectively.
After testing it over the course of one month, I achieved a success rate of around 90% in my trades when using the model as part of my strategy.
The model was trained using the following features:
Time-related: Hour, DayOfWeek
Price & volume lags: Close_lag_1, Close_lag_2, Close_lag_4, Close_lag_8, Close_lag_12, Volume_lag_1, Volume_lag_2, Volume_lag_4, Volume_lag_8, Volume_lag_12
Moving averages & statistics: MA_4, Std_4, Dist_MA_4, MA_16, Std_16, Dist_MA_16, MA_48, Std_48, Dist_MA_48, MA_96, Std_96, Dist_MA_96
Technical indicators: Return_log, MACD, RSI
Hourly Forecast for the Next 24 Hours
2025-09-27 13:00:00+00:00 4026.482613
2025-09-27 14:00:00+00:00 4028.550190
2025-09-27 15:00:00+00:00 4036.481202
2025-09-27 16:00:00+00:00 4044.217143
2025-09-27 17:00:00+00:00 4051.725418
2025-09-27 18:00:00+00:00 4059.018598
2025-09-27 19:00:00+00:00 4066.029393
2025-09-27 20:00:00+00:00 4072.871648
2025-09-27 21:00:00+00:00 4079.563074
2025-09-27 22:00:00+00:00 4086.117364
2025-09-27 23:00:00+00:00 4092.561460
2025-09-28 00:00:00+00:00 4098.897422
2025-09-28 01:00:00+00:00 4107.330284
2025-09-28 02:00:00+00:00 4116.884113
2025-09-28 03:00:00+00:00 4126.399899
2025-09-28 04:00:00+00:00 4135.863390
2025-09-28 05:00:00+00:00 4145.268831
2025-09-28 06:00:00+00:00 4154.576873
2025-09-28 07:00:00+00:00 4163.768272
2025-09-28 08:00:00+00:00 4172.835229
2025-09-28 09:00:00+00:00 4181.770921
2025-09-28 10:00:00+00:00 4190.570690
2025-09-28 11:00:00+00:00 4199.232384
2025-09-28 12:00:00+00:00 4207.754681
2025-09-28 13:00:00+00:00 4216.138168
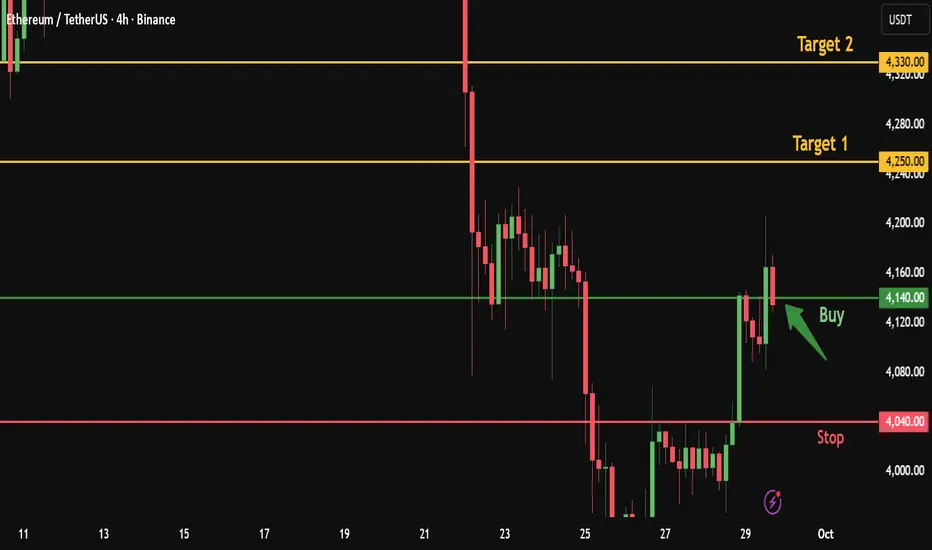
Ethereum Quick Buy from Broken Resistance – Targeting 4330After Ethereum broke the 4140 resistance with a bullish 4H candle and reached 4205, the price has now retested the broken resistance at 4140.
This level acts as a strong entry point for a long position, aiming for higher targets.
Here’s my personal trade plan:
✅ Entry : Buy from current price 4140
🎯 Target 1: 4250
🎯 Target 2: 4330
Stop-loss: 4040
👍 Don’t forget to boost this trading idea if you found it helpful,
and follow me for more daily crypto insights and trade signals.
Please note:
This is not financial advice – I’m only sharing my personal trades.
Always do your own research before taking action.
Best of luck 🌹
#ETHUSDT 6H ChartPrice moved up from the 4h demand zone at $3,850 and it is currently getting rejected off a 6h supply zone. MACD is bullish, RSI is bought and EMAs are bearish. Price needs to break and close above this 6h supply to expect further upward movements towards the next 6h supply at $4,450.

ETH 4H trade Idea Here is an idea to trade Ethereum on 4 hour TF. Entry and Exit points are given. NFA DYOR

ETHUSDT BUY AND HOLD ITI think it is a good time to buy Ethereum and hold it until higher targets. Ethereum has entered the weekly demand zone and has started its uptrend on the 1-hour and 4-hour time frames.
