$ETH Weekly Analysis – ATH soon?ETH is testing the upper boundary of the green zone (~4340–4350), which is acting as key resistance, very close to its ATH.
Scenarios for this trading week:
Bullish : a confirmed breakout and close above 4350 opens the door to the 4,600–4650 target zone, with strong resistance ahead at 4860 (previous all time high zone). If buyers show strength, we can see new All-time High (~4900-5000).
Sideways/Correction : price could move in the 4000–4200 range for consolidation.
Bearish : а drop below 4000 could push ETH down to 3500–3650, even toward the key support around 3300 if the selling pressure grows.
Daily RSI is at 74, that means it's deeply overbought, so be cautious about your long positions.
Disclaimer: The author’s opinion may not align with yours.
BYBIT:ETHUSDT
ETHUST trade ideas

Weekly trading plan for EthereumLast week, BINANCE:ETHUSDT reached all the planned targets, moving according to the bullish scenario
Locally, we can see a support zone — as long as the price stays above it, there’s a strong chance to see a new ATH this week
If the local support breaks, there’s a higher probability of breaking the weekly pivot point and reaching 3,933 , after which we could see a new ATH
If the price fails to climb back above the weekly reversal level, a drop toward the 3,700–3,500 area becomes possible
More details are in the idea video.

Ethereum ETH price analysis📉 Three possible scenarios for #Ethereum CRYPTOCAP:ETH :
🟢 Bullish:
Minor correction to $3950–$4000, followed by a breakout to new all-time highs (ATH).
🟡 Neutral:
Drop to $3400, bounce to $3950 — and then the decision point: breakout or breakdown?
🔴 Bearish:
Deeper correction to $2650 — possibly the last great buying opportunity before the next major rally.
👉 Which scenario for OKX:ETHUSDT resonates most with you?
Let us know in the comments!

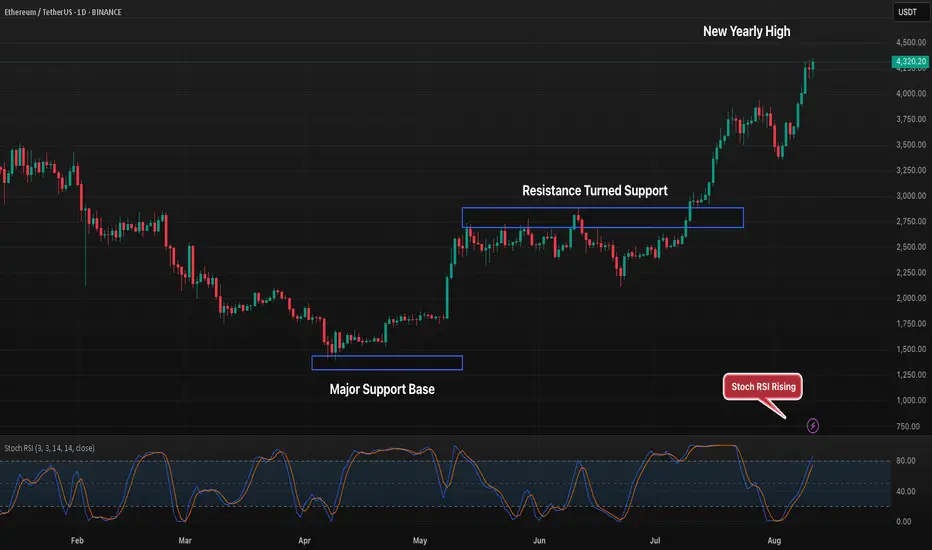
ETH 1D Breakout to New Highs, Can Bulls Sustain Momentum?Ethereum has rallied sharply after flipping the $2.8K resistance into support, pushing to fresh yearly highs above $4.3K. The breakout was fueled by strong momentum after holding a major base around $1.4K earlier in the year. Stoch RSI is trending upward, showing continued buying strength, but overextended conditions could lead to a pullback toward the breakout zone. Sustaining above $4K would keep the bullish structure intact, while a failure to hold could trigger a retest of lower supports
Ethereum bullish expectations?Ethereum has been consolidating above $4,000 for a few days. There is no sign of a pullback in the 8-hour timeframe. If Bitcoin does not fall, it is likely to move towards $5,000. Of course, the Fed rate at the upcoming meeting is very crucial.

Can Ethereum Give Us Profit Before the Next Run to 4400?It feels safe to bid for BINANCE:ETHUSDT at 4100 right now and ride it up to 4400.
I will place my SL at 3.8k
Ignore this trade update if you don't know about position sizing and order scaling.
Let's see if this will cook.
What are your thoughts about this analysis? Let me know in the comments section.
If you like the analysis, like it and follow me for more trade updates.
Ethereum (ETH) Price Hits 3.5 Year High; Nears ATH Of $4,891BINANCE:ETHUSDT is approaching a significant milestone in August, trading at $4,182, a 3.5-year high . The altcoin breached the $4,000 mark over the weekend, setting its sights on the next target of $4,891. This strong upward momentum suggests Ethereum could make history if it sustains its growth.
At $4,303, BINANCE:ETHUSDT is 17% away from its all-time high (ATH) of $4,891 . To reach this ATH, ETH must first secure $4,500 as a stable support level. A successful consolidation above this threshold could set the stage for ETH to continue its bullish ascent towards the ATH.
However, if investor sentiment shifts and selling pressure increases, BINANCE:ETHUSDT could struggle to maintain its position above $4,000 . A decline below this level would invalidate the bullish outlook, potentially reversing the recent gains and sending ETH lower.

ETH NEXT BULLISH MOVE.🟢 ETHUSDT | 1H Bullish Setup
✅ Price broke structure and is in bullish order flow.
✅ Clear POI (Point of Interest) zone at 4,060 – 4,080.
🔍 Price is retracing from highs, yet to tap into POI.
📌 Trade Idea: Wait for price to retrace into POI zone and look for bullish confirmation before entry.
🎯 Potential bounce toward 4,350+ after liquidity sweep and POI mitigation.

$ETH at Major ResistanceEthereum is testing a confluence zone — horizontal resistance + channel top 📏
Last few touches here led to strong rejections
A breakout could be explosive, but caution is key!

[SeoVereign] ETHEREUM Outlook – August 12, 2025I will present a short position perspective on Ethereum for August 12.
This idea is based on the premise that the direction is downward, derived from a strict counting of Bitcoin, and the specific entry point was set based on the Shark pattern.
Accordingly, the average take-profit target was set at around 4,126 USDT.
I plan to continue updating this idea as the movement unfolds.
Thank you.

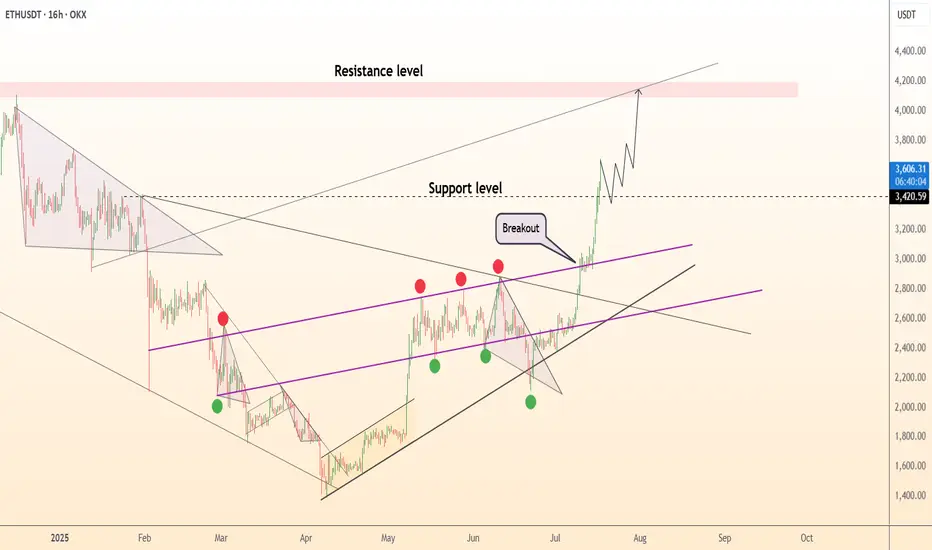
DeGRAM | ETHUSD retest of the support level📊 Technical Analysis
● ETH exploded out of the purple median channel, invalidating March-July lower-highs; retest of 3 210 held as a fresh higher-low, confirming trend acceleration.
● Price is now travelling the channel’s outer parallel; flag pole projected from the 2 430→3 210 thrust aligns with the 4 150-4 250 supply zone shown in pink.
💡 Fundamental Analysis
● CME ether futures OI hit a 14-month high on 17 Jul while exchange balances dropped to a five-year low, signalling strong institutional demand and tight float ahead of expected spot-ETF approvals.
✨ Summary
Long 3 210-3 300; hold above 3 210 targets 3 600 → 4 200. Bull view void on a 16 h close below 3 020.
-------------------
Share your opinion in the comments and support the idea with like. Thanks for your support!
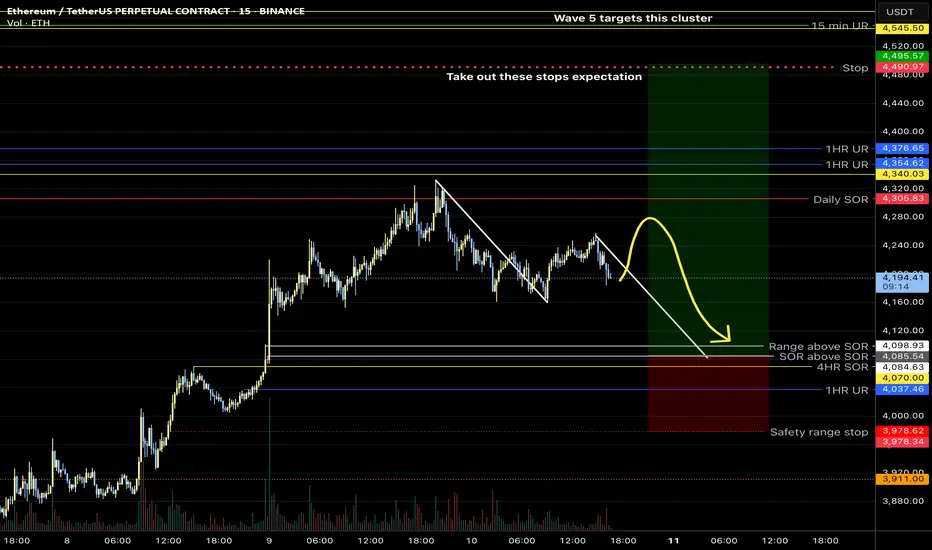
ETH - 1H Elliott Wave Analysis - 08.08.25Welcome to our Elliott Wave Analysis for Ethereum! :D
We assume that we bottomed on the 3rd of August and started an impulsive move up from there displayed as the white 5 wave move up. We assume that the white Wave 1 and 2 are finished and we are working on the 3rd Wave. We added a smaller degree count for this white Wave 3 displayed in green of which we finished Wave 1,2 and probably 3 too and could have started the green Wave 4. The support area for the green Wave 4 is between the 0.236 FIB at 3892 USD and the 0.5 FIB at 3870 USD. Technically we touched the 0.236 FIB already which means the green Wave 4 could be in.
We added the 1.382 FIB target at 4069 USD and the 1.618 FIB target at 4159 USD for the white Wave 3 where the green Wave 5 should take us to in this impulsive count.
In case we break the green Wave 4 support area and invalide the green 5 wave move up the alternative is a diagonal which means the white Wave 3 would be an ABC displayed in red instead which would allow us for a deeper retracement. For the red B Wave we added a support area between the 0.382 FIB a 3806 USD and the 0.886 FIB at 3591. There is also the white trendline which goes directly through the golden picket which could function as further support. The golden pocket is also slightly below the white Wave 1 high which could spark some buying interest if we get a deeper retracement.
We hope you enjoyed the analysis and you're now well prepared for coming price action!
Thanks for reading.
NO FINANCIAL ADVICE.

ETH | NEW ATH or DUMP ?Ethereum recently peaked at $3900. And allthough this is not a new ATH (close by a few hundred dollars), it is a local high for the year.
My last update was on an inverse Head and Shoulders pattern on ETH, which has since increased over 50%:
(The original idea here:)
The question now, is what's next for ETH - further increase, or are the increases over for the near term and is a correction more likely?
I'm going to say that the increases for ETH are over for now. This is because we correction is most definitely due after such a large increase in a fairly short timeframe. I'm not saying we're heading into a full out bearish cycle, but a 20-25% correction would be most normal at this point.
Additionally, XRP has also made it's peak and lost the high, now trading just under $3. This is a strong sign that the alts have likely already rallied, since XRP used to be the last to increase (if it increased at all, historically. (Thanks Jedd).
I was very lucky to call that top here:
Either way, buyers may use this correction to scoop up on smaller alts over the next few weeks. This ultimately depends on whether the market has ONE MORE pump, and if the correction will bounce back from a 20-25% pullback.
_________________
BINANCE:ETHUSDT

ETHUSDT analysis - 1H FVG and OB SetupsETH has recently rejected from the 4,370 area, showing signs of short-term exhaustion.
On the 1H chart, a clear FVG is located around 4,100, which could act as a liquidity target if selling pressure continues.
Below that, we have a strong Bullish OB around 3,900, aligning with previous demand and potential reversal interest.
If price retraces into the FVG zone (4,100) and shows bullish reaction in lower timeframes, short-term buys could be considered targeting 4,300 – 4,370.
A deeper move into the OB at 3,900 would be a high-probability long setup for swing traders, with upside potential toward 4,500.
For now, structure remains bullish on higher timeframes, but short-term correction is possible before continuation.
📊 ProfitaminFX | Gold, BTC & EUR/USD & Crypto
📚 Daily setups & educational trades

ETHUSDT 4H Breakout: Symmetrical Triangle Targets AheadMEXC:ETHUSDT
Key Elements:
Pattern: The chart shows a symmetrical triangle pattern formed by two converging trendlines connecting the highs (resistance) and lows (support). The breakout appears to have occurred upward from point D, with a measured move of 1.683 times the height of the triangle (from 0.619 to 4.49).
Price Levels:
Entry/Breakout Point (D): Approximately 4.49.
Stop Loss: Set at 4,333.59, just below the upper trendline and recent high.
Targets:Target 1: 4,047.34.
Target 2: 3,963.67.
Target 3: 3,651.82.
The price range spans from around 3,250 to 4,500 USDT.
Indicators:The triangle's height (0.619) and the breakout move (4.49) suggest a calculated target projection.
Green and red candlesticks indicate bullish and bearish periods, respectively.
Analysis:The upward breakout from the triangle suggests bullish momentum, with the price potentially aiming for the listed targets.
The stop loss at 4,333.59 is strategically placed to limit downside risk if the breakout fails.
The targets decrease incrementally, indicating a possible profit-taking strategy as the price progresses.

ETHUSDT - SOLANAThe digital currencies Ethereum and Solana have not grown much due to the increase in the prices of other major currencies. Since both currencies include strong networks and are considered the leading cryptocurrency, long-term price increases can be expected for these two currencies and they are considered good investment options.
Sasha Charkhchian

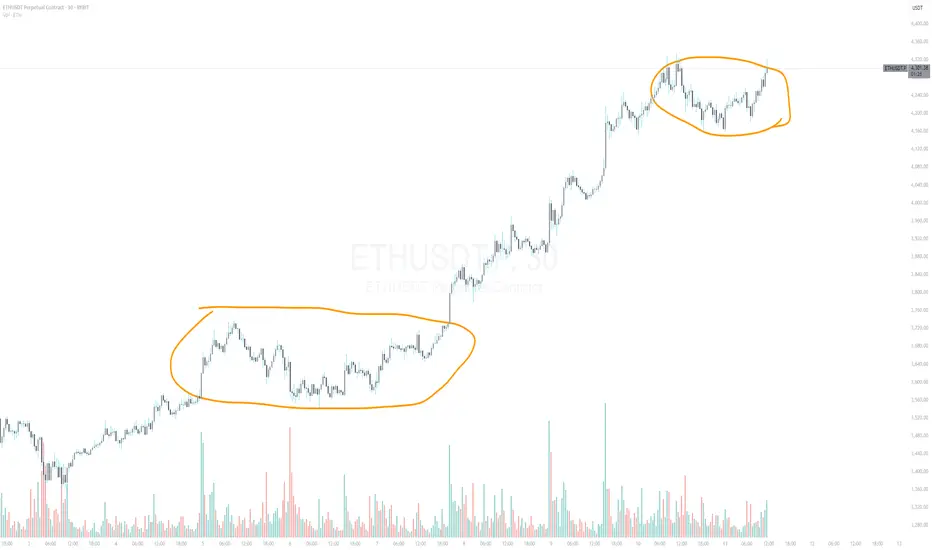
ETH well over extended but almost identical patternsETH well over extended but almost identical patterns before marking up hard.
question is whether the ETH narrative is strong enough to get through the profit takers..
We have a big BTC CME gap below which means we will likely get a close sometime soon back down to fill it in the NY session or soon after.
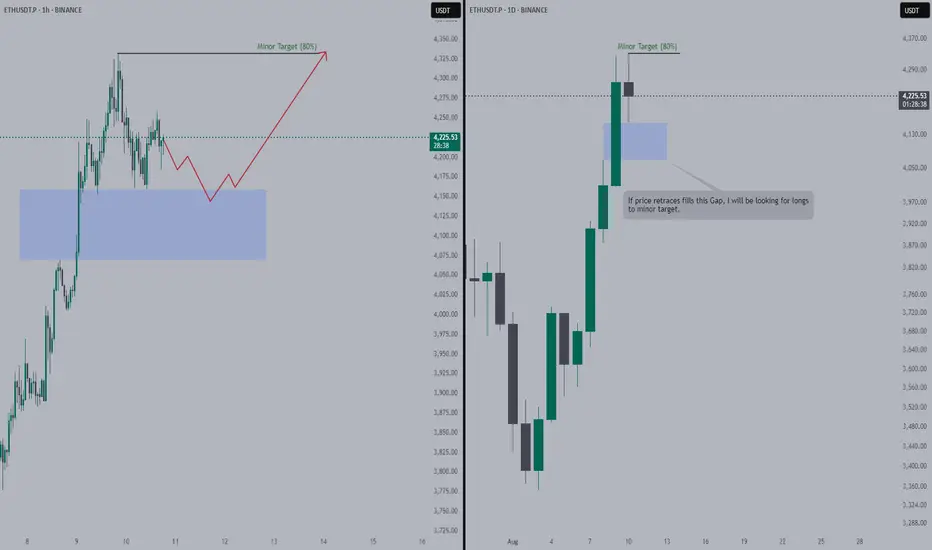
Ethereum Will Retrace to Fill the Daily GapConfirmation: Once price fills the imbalance/gap
Opportunity: I will be looking for longs between the Gap and the Target.
3.8 RRThe target for this trade is somewhat ambitious. Therefore, if the entry is filled, at either of the white lines, please protect profits once entered. One could exit sooner for a safer trade.
ETH | Swing Long IdeaETH | Swing Long Idea
📊 Market Sentiment
Overall sentiment remains bullish, supported by expectations of a 0.25% rate cut in the upcoming FOMC meeting. A weakening USD and increased risk appetite across global markets are creating favorable conditions for further upside in crypto assets.
📈 Technical Analysis
Price has run the HTF liquidity level at $4100.
While the breakout above $4100 was aggressive, it appears price may require additional liquidity before pushing higher.
This idea focuses on a possible ETH retracement and continuation pattern over the coming days to weeks.
📌 Game Plan
If a deep retracement occurs, I’ll be watching the 0.5 Fibonacci discount zone and the 0.75 retracement level for optimal entries.
Key focus: daily demand zone at $3750 — ideally aligned with the 0.75 retracement.
I won’t wait for an exact touch of the 0.75 level; instead, I’ll watch for strength and a clear break of structure to trigger entries.
🎯 Setup Trigger
Look for a 12H–4H break of structure shift after the daily demand zone at $3750 is hit.
📋 Trade Management
Stoploss: 12H–4H swing low that caused the break of structure
Targets:
TP1: $4088
TP2: $4330
TP3: $5000 (possible swing point)
Will trail stops aggressively to secure profits as price moves in my favor.
💬 Like & follow if you found this breakdown helpful — more setups coming soon!

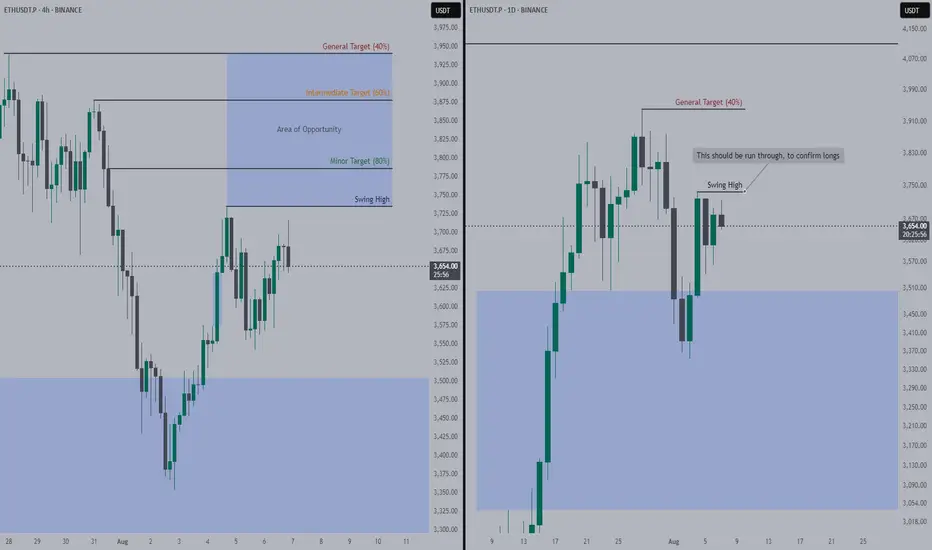
Ethereum Needs to RUN Swing High (Latest)To confirm longs and look for entries, we need price to run through Swing High.
If price closes above Swing High in 4H price action, I will be looking for longs within Area of Opportunity (AoO).
Altcoins and Altseason:How to Understand and Use Them in Trading
The cryptocurrency market has long moved beyond Bitcoin’s monopoly. Today, it consists of thousands of digital assets, each with its own technology, goals, and economic model. Among traders, two terms are frequently used — “altcoin” and “altseason,” and understanding them is essential for anyone aiming to earn consistently in crypto.
An altcoin is any cryptocurrency other than Bitcoin. The first alternative coins appeared in 2011, when developers sought to improve BTC by offering faster transactions, new algorithms, or additional features. Today, some of the most well-known altcoins include:
Ethereum (ETH) — the leader in smart contracts and decentralized applications.
Ripple (XRP) — focused on fast international transfers.
Cardano (ADA) — known for its scientific approach and energy efficiency.
Solana (SOL) — prioritizes ultra-fast transaction speeds.
Polygon (MATIC) — tackles blockchain scalability issues.
Altseason refers to a period when altcoins become the main growth drivers of the market, outperforming Bitcoin in both speed and volume of price gains. During this time, investors often take profits from BTC and move capital into other projects. As Bitcoin’s dominance declines, space opens up for alternative coins to rally. In such phases, traders shift their attention to promising technologies and big news stories, with many altcoin charts showing growth that far exceeds that of Bitcoin.
For a trader, altseason is not just a flashy market phase — it’s a period of maximum opportunity. With the right analysis, it can deliver returns that are hard to achieve during normal market conditions. However, the potential for high profit also comes with high risk. The altcoin market is known for sharp volatility, and choosing the wrong asset can result in losses just as significant as potential gains.
That’s why it’s crucial not only to understand what altcoins and altseason are but also to recognize them in time. This requires a combination of fundamental and technical analysis, tracking Bitcoin dominance trends, and using reliable trading tools that can spot shifts in market cycles. With a thoughtful approach, altseason can become the window of opportunity that opens the door to new results in trading.
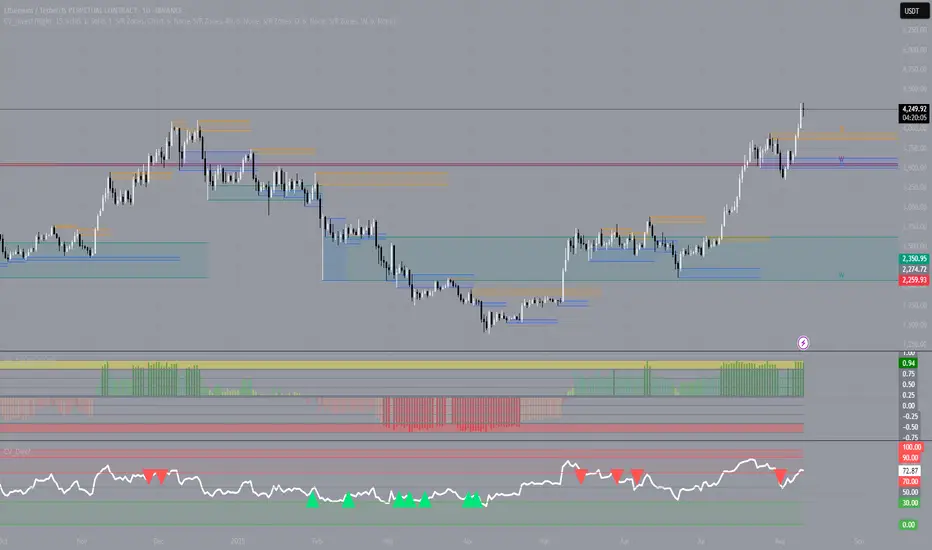
ETH update 9.06.2025Hello everyone, many of you asked me to publish my vision for ETH.
Here you go!
I believe that the previous impulse movement was only the first upward movement, and now we are in a sideways correction movement — call it what you will, but the fact is that the exit from this flat will be upward.
1. End of the year
2. ETH is accumulating on the Onchain
3. Liquidity overflow from BTC can be seen on the ETHBTC chart, and the overflow began at the very bottom
4. What else can large conservative players accumulate?
5. We are going after liquidity from above and should break 4100 by September
Best Regards EXCAVO
