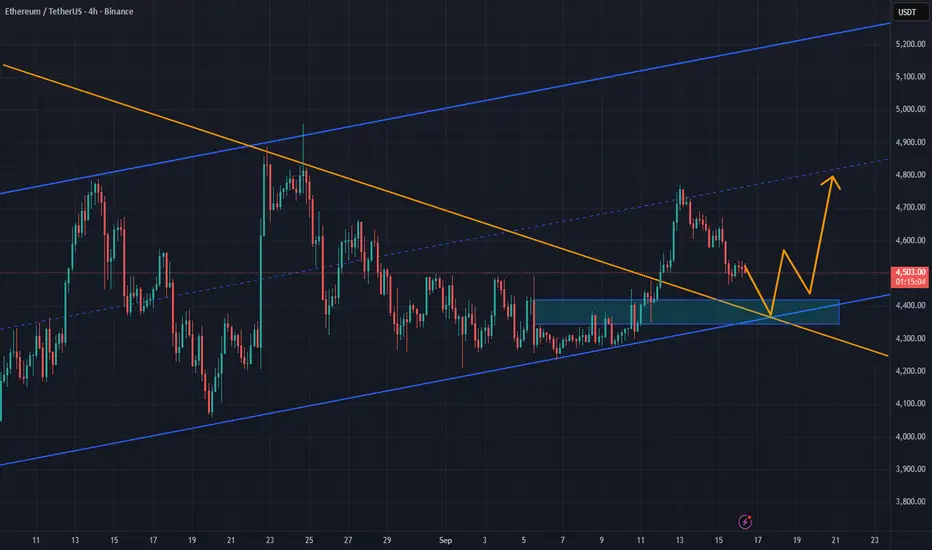
ETH/USDT: Bullish Structure Intact Above Key Support ZoneETH/USDT is trading above the 4,400 support level after rebounding from the upward trendline, showing resilience despite recent pullbacks. The market has broken out of a falling wedge pattern and is forming higher lows, indicating accumulation and potential for further upside.
If buyers defend the 4,390 area, momentum could carry the price toward the 4,750 level, with a possible retest of the broader 5,000 resistance zone. As long as Ethereum stays above trendline support, the bullish outlook remains in play.
Trade ideas
#ETHUSDT 4H ChartPrice had tapped into our POI and bounced as predicted however it is currently consolidating. MACD is showing bearish weakness, RSI is sold and EMAs are slightly bullish. Price might trade deeper into the 4h demand zone at $4,400 before potentially continuing its bullish movements.

Ethereum $ETH daily demand playing out well. Breakout happenedEthereum CRYPTOCAP:ETH daily demand at $4,336 is playing out well. Breakout happened as expected and mentioned in the last update. Long positions should be managed on this major cruptocurrency.

Lingrid | ETHUSDT Pullback Entry Continuation SetupBINANCE:ETHUSDT is trading above its key support at 4,400 after a rebound from the upward trendline, showing resilience despite recent pullbacks. The structure highlights a breakout from the falling wedge and the formation of higher lows, signaling accumulation before continuation. If buyers defend 4,390, momentum could lift price toward 4,750 and potentially retest the broader resistance zone near 5,000. The overall outlook remains bullish as long as Ethereum holds above its trendline support.
💡 Risks:
A breakdown below 4,390 would weaken bullish momentum and expose downside toward 4,000.
Sharp volatility in Bitcoin could spill over into Ethereum, limiting upside potential.
Negative regulatory or macroeconomic news may trigger selling pressure across crypto markets.
If this idea resonates with you or you have your own opinion, traders, hit the comments. I’m excited to read your thoughts!

Sovereign Debt & Global Government Bond Trading1. The Concept of Sovereign Debt
1.1 Definition
Sovereign debt refers to the financial obligations of a national government, typically in the form of bonds, notes, or bills, issued to domestic and international investors. Unlike corporate or household debt, sovereign debt is backed by the state’s ability to tax, print currency (for monetary sovereigns), or pledge future revenues.
1.2 Purpose of Sovereign Borrowing
Fiscal Deficit Financing – Covering gaps between government expenditure and revenues.
Infrastructure Projects – Financing long-term development like roads, power plants, and education.
Counter-Cyclical Spending – Stimulating economies during recessions.
Debt Refinancing – Rolling over old debt with new issuance.
Foreign Exchange & Reserve Building – Issuing foreign currency debt to strengthen reserves.
1.3 Types of Sovereign Debt
Domestic Debt – Issued in local currency, bought mostly by domestic investors.
External Debt – Issued in foreign currencies (USD, EUR, JPY, etc.), attracting global investors.
Short-term vs. Long-term Debt – Ranging from treasury bills (maturing in months) to bonds with maturities of 30 years or more.
2. Evolution of Sovereign Debt
Sovereign borrowing dates back centuries.
Medieval Europe – Monarchs borrowed from bankers to finance wars (e.g., Italian city-states lending to monarchs).
17th Century England – Creation of the “consols” (perpetual bonds) and the Bank of England institutionalized sovereign debt markets.
19th Century – Global trade expansion saw countries like Argentina, Russia, and Ottoman Empire issuing debt in London and Paris.
20th Century – Post-WWII Bretton Woods system made U.S. Treasuries the global benchmark.
21st Century – Sovereign bonds now dominate global capital markets, with increasing cross-border integration, ETFs, and derivatives.
3. Structure of Global Government Bond Markets
3.1 Major Bond Issuers
United States – Largest market, U.S. Treasuries are the global risk-free benchmark.
Eurozone Sovereigns – Germany, France, Italy, Spain, etc., forming the largest block of bonds.
Japan – Japanese Government Bonds (JGBs), held mostly by domestic institutions.
Emerging Markets – Brazil, India, China, South Africa, etc., increasingly significant.
3.2 Investor Base
Central Banks – Hold bonds as reserves and for monetary policy.
Institutional Investors – Pension funds, insurance companies, mutual funds.
Foreign Governments & Sovereign Wealth Funds – For diversification and trade balance management.
Retail Investors – Via savings bonds, ETFs, and mutual funds.
3.3 Market Segments
Primary Market – Governments issue debt through auctions and syndications.
Secondary Market – Investors trade bonds in over-the-counter (OTC) markets or exchanges.
Derivatives Market – Futures, options, and swaps linked to sovereign bonds.
4. Mechanics of Government Bond Trading
4.1 Issuance Process
Auctions: Competitive and non-competitive bids (e.g., U.S. Treasury auctions).
Syndication: Banks underwrite large bond deals for global distribution.
Private Placements: Direct sales to select investors.
4.2 Bond Pricing & Yields
Bond prices are inversely related to yields. Key concepts:
Coupon Rate – Fixed interest payments.
Yield to Maturity (YTM) – Return if held to maturity.
Yield Curve – Plot of yields across different maturities, signaling market expectations.
4.3 Trading Platforms
OTC Networks – Banks, dealers, and institutional investors.
Electronic Platforms – Bloomberg, Tradeweb, MarketAxess.
Futures & Options Markets – CME, Eurex, SGX for hedging and speculation.
5. Role in Global Finance
5.1 Benchmark for Risk-Free Rate
U.S. Treasuries, German Bunds, and JGBs are benchmarks for pricing corporate bonds, loans, and derivatives.
5.2 Safe Haven Asset
In crises, investors flock to sovereign bonds of stable countries (U.S., Switzerland, Japan), causing yields to fall.
5.3 Monetary Policy Transmission
Central banks buy or sell government bonds (open market operations) to influence liquidity and interest rates.
5.4 Reserve Asset
Foreign exchange reserves of central banks are largely invested in government bonds of major economies.
5.5 Capital Flows & Exchange Rates
Sovereign bond yields attract global capital. For example, higher U.S. yields attract inflows, strengthening the dollar.
6. Risks in Sovereign Debt
6.1 Credit Risk
Risk of default—Argentina (2001), Greece (2010), Sri Lanka (2022).
6.2 Currency Risk
Foreign investors in local currency bonds face FX volatility.
6.3 Interest Rate Risk
Bond prices fall when interest rates rise.
6.4 Liquidity Risk
Some emerging market bonds lack active secondary markets.
6.5 Political & Geopolitical Risk
Political instability, sanctions, or wars disrupt repayment.
Challenges & Controversies
Debt Sustainability – Rising debt-to-GDP ratios in U.S., Japan, Italy spark long-term concerns.
Monetary Financing – Central banks buying government debt blurs fiscal-monetary boundaries.
Market Concentration – Dominance of few large investors (e.g., BlackRock, Vanguard).
Geopolitics – Sanctions on Russia’s bonds, China-U.S. tensions, weaponization of reserves.
Conclusion
Sovereign debt and global government bond trading are central pillars of the modern financial system. They provide safety for investors, benchmarks for pricing, liquidity for monetary policy, and capital for governments. However, sovereign debt markets are not without risks—ranging from defaults and political upheavals to interest rate shocks and currency crises.
As the world enters an era of high debt, climate imperatives, digital finance, and geopolitical fragmentation, sovereign debt will continue to shape the future of international finance. Global government bond trading, once limited to elite institutions, is now a truly worldwide marketplace reflecting the interconnectedness of economies.
Ultimately, sovereign debt is not just about borrowing; it is about trust—the trust of citizens in their governments, and of global investors in the financial system.

Ethereum Holds $4,500 as Key Support in Market Structure TestEthereum has corrected back to $4,500, a level that once acted as resistance and now flipped into strong support. Holding this zone is crucial for the bullish case.
Following its recent correction, Ethereum is trading at a pivotal level that will determine its next decisive move. Market structure suggests a potential rebound, though risks of deeper correction remain.
Key Technical Points:
$4,500 reclaimed as high-timeframe support.
VWAP sits just below as added confluence.
Point of control lies beneath as fallback support.
Ethereum’s current positioning highlights the importance of historical resistance-turned-support levels. The $4,500 zone, which capped price earlier this year, has now flipped into support and is being tested again. Confluence with VWAP reinforces this as a critical level.
Failure to hold $4,500 would open the door for a move toward the point of control, another high-timeframe support where buyers may step in. Until then, ETH is expected to trade around these technical markers as traders wait for confirmation of direction.
What to Expect in the Coming Price Action:
If Ethereum successfully holds $4,500, continuation toward higher resistance becomes the probable scenario. A breakdown, however, sets the stage for testing the POC before any renewed push higher.
ETH: The Power of Structure On September 8, I opened a long on the 4-hour chart at $4371, using 10x leverage. The move turned out strong: price reached $4767, and along the way four profit-taking levels were secured. Nearly $400 difference per coin — that was the maximum the trade offered, and the result was fully captured.
The key here was not prediction but a systematic approach. Levels were outlined in advance, and the trade unfolded step by step according to plan. This removed chaos and allowed me to hold the position calmly, without emotional pressure.
When the structure is clear, decisions come easier: where to take partial profit, where to hold, where to keep composure. Even when trading with leverage, risk remains manageable, and actions are driven by logic rather than reaction.
The market will always remain unpredictable. But discipline and structure turn every move into part of a strategy, where results are defined by consistency rather than chance.

ETH Go to the $5050 SOONHello,
Are you ready to ETH $5050
As soon as possible this price.
If price touch $4706 again $5050 is availble.
Thank you

Key support at 4500Ethereum also dropped as the Forex market opened and managed to break out of the range. It has now reached a key support level, and there’s a possibility that it could bounce from this support and return back into the range. ✅

#ETH: Weekly AI Market Breakdown. 2025/15/09What's up, crypto fam! 🚀 NeuralTraderingPro here. Mondays are tough, but not for us. While everyone else is shaking off the weekend, we're diving into the new trading week with a clear head and a calculated approach. Last week proved the market doesn't forgive complacency, and our correction scenario played out even deeper than expected. This isn't a reason to panic—it's a reason to analyze. Let's break down where we are and where we're headed!
Last 24 Hours: A Look Back
My previous forecast was 60% long, based on the strength of the
4650−4600 support zone. I warned that a break below it would open the door to $4500, and the market chose exactly that, more bearish path. Fueled by news of the upcoming ETH unlock, sellers managed to push the price below the key 4-hour SMA 50, and we saw a perfect tap of our second downside target at $4500. This wasn't a failure; it was the alternative scenario playing out. The price is now at the bulls' last line of defense, and what happens here will likely determine the trend for the coming weeks.
Market Sentiment & News 📰
The news cycle is heating up, and the market is torn between fear and greed:
⚔️ The Staking Showdown: The key theme this week is the upcoming unlock of 1.6M ETH by the Kiln platform. This is creating potential sell-side pressure and market jitters. However, long-term investors aren't fazed: the staking queue is once again longer than the withdrawal queue, signaling long-term confidence in the asset.
🐂 Bulls Aren't Backing Down: Despite the dip, on-chain analysts continue to talk about ETH's potential to hit the landmark $5,000 level. Whale wallets used this downturn as an accumulation opportunity, not a reason for panic selling.
📈 Altseason in Full Swing: The Altcoin Dominance Index is at its highs, which has historically been a tailwind for Ethereum as the leader of the altcoin pack. Capital is chasing higher yields, and ETH remains a top contender for those flows.
🌍 The Big Picture: The crypto market doesn't exist in a vacuum. Bitcoin remains the primary bellwether, with its monetary policy and ecosystem setting the tone for the entire space. News related to BTC, especially around demand and ETFs, will indirectly impact Ethereum as well.
Technical Analysis 📊
🔹 1D Chart (Daily): The price has hit a critical level—the fast-moving average SMA 20 (blue line). This has served as dynamic support for the entire uptrend since August. Holding this level is priority number one for the bulls. The RSI has cooled off, dropping to 55 and exiting the overbought zone, which creates room for another leg up. The MACD is still positive, but the histogram is rapidly shrinking, warning of a potential bearish crossover.
🔹 4H Chart (4-Hour): The picture here is bearish. The price is below both moving averages (SMA 20 and SMA 50), which are now acting as strong resistance in the
4600−4660 range. The RSI is below 50, indicating that sellers are in control. The MACD is deep in negative territory. However, the price is building a base around $4500, and the volume on the way down has started to decline—a potential sign of seller exhaustion.
🔹 30M Chart (30-Minute): We can see a clear downtrend. After the sharp drop, the price has entered a consolidation phase. The RSI has moved out of the oversold zone, hinting at a possible local bounce. Any attempt to rally will immediately face resistance from the SMAs overhead.
Order Book Analysis (DOM) ⚖️
Current Price ~4512.51 USDT. The order book is practically screaming about the battle for the $4500 level:
🔴 Sell Walls (Resistance): Right above the current price, up to $4516, there are orders holding the price down. But the main barrier is at $4515.74—a massive wall of 200 ETH worth nearly $1 million! Breaking through that will be extremely difficult without a major buyer stepping in.
🟢 Buy Walls (Support): Below the price lies a real fortress. The
4510−4512 range is packed with numerous large buy orders totaling over $1.5 million. This is a powerful safety cushion catching the price and preventing it from falling further. Such dense bids suggest that big players find the current prices very attractive for buying.
Conclusion: The order book shows a standoff at a critical level. Bears have built a wall just above, while bulls have an impenetrable bastion right below. The outcome of this fight will determine the short-term direction.
Key Patterns & Formations 🔎
The "bull flag" pattern we were watching has been invalidated. The key formation now is the test of the $4500 level. This isn't just a round number; it's a "mirror level" or a classic S/R (support/resistance) flip. It previously acted as strong resistance, and per technical analysis rules, it should now act as strong support. We are witnessing a classic re-test of this level. A successful bounce from here would confirm the strength of the bull trend. A failure would open the door to a much deeper correction.
Updated Targets for the WEEK
Upside Targets 🚀 (if $4500 support holds):
$4600 (Psychological level, former support).
$4680 (4H SMA 50 zone, a major technical resistance).
$4800 (A return to the recent highs).
Downside Targets 📉 (if $4500 support breaks):
$4420 (Local low from Sept 9).
$4350 (Daily SMA 50 zone, the bulls' last stand).
$4200 (Strong structural and psychological support level).
Short-Term Forecast:
Long: 50% 🐂
Short: 50% 🐻
Reasoning: The situation is a true 50/50. On one hand, we're sitting on a massive support level with huge limit buy orders, making a bounce highly probable. On the other hand, the technical picture on lower timeframes is broken, and the news (ETH unlock) is weighing on the market. The price is caught between a rock and a hard place. Predicting the direction right now is a coin toss. It's smarter to act on a confirmed break in either direction.
Trade Ideas
For Buyers (Long):
Idea 1 (Aggressive): Buy in the current
4500−4515 zone, betting on the support to hold for a bounce. Target: $4600, then $4680. Stop-loss: very tight, just below $4470.
Idea 2 (Conservative): Wait for the price to reclaim and hold ABOVE the $4600 level on the 4H chart. This would be a sign the correction is over. Target: $4800. Stop-loss: below $4550.
For Sellers (Short):
Idea 1 (Aggressive): Sell on a bounce to the
4580 − 4600 resistance zone. Target: a re-test of $4500. Stop-loss: above $4620.
Idea 2 (Conservative): Only open short positions after a confirmed break and close on the 4H chart BELOW the strong support zone of $4480. Target: $4350.
Final Recommendations for Traders
This is not the time for impulsive decisions. The market is at a point of maximum uncertainty. The key level to watch is $4500. Aggressive traders can try playing the bounce from this zone with a tight stop. Conservative traders might be better off staying on the sidelines and waiting for a clearer signal—either a confirmed bounce or a decisive breakdown. Manage your risk, and don't over-leverage.
Trade with your head, not your heart, and may this week bring you profits! ✨
Liked this fresh analysis? Show some love with a thumbs up 👍 and subscribe to stay on top of every market move! 🚀

ETHUSDT.PHello friends
Given the good growth we had, the price has made a 14% correction. If the specified support is maintained, the price can see the specified targets. If the support is broken, the price can fall by another step. We have identified important support points for you.
*Trade safely with us*

ETH *UPDATE*Hello friends
Given the channel breakdown and the entry of buyers, it now seems that the price is in a pullback. In this case, the price pivots of the channel, which are now becoming supported, are expected to be good support and cause the price to grow and move with it to the specified targets.
*Trade safely with us*

Ethereum price pullback before Fed rate cutsWith the FED rate cuts just around the corner. The market is screaming bullish and euphoric. I do see this $4,200-$4,300 level being tested before moving higher during or after the cuts are announced.
Could we see a buy the rumour and sell the news event?

Long ETHUSDTHello traders!
After a succesful break above resistance, I'm looking for this scalp long.
Don’t forget to like and share your thoughts in the comments! ❤️

Ethereum (ETH): Looking For That Break of Structure | Bullish AFETH is still waiting for that break of structure, and once it happens we are going to be looking for a push into new ATH levels. Monday came with a bloody move, but for now it looks nothing more than a shakeout before buyers step back in and take control.
Swallow Academy
ETH/USDTI think wave B is in the form of a completed triangle for wave C, so I will open a short position with this setup.

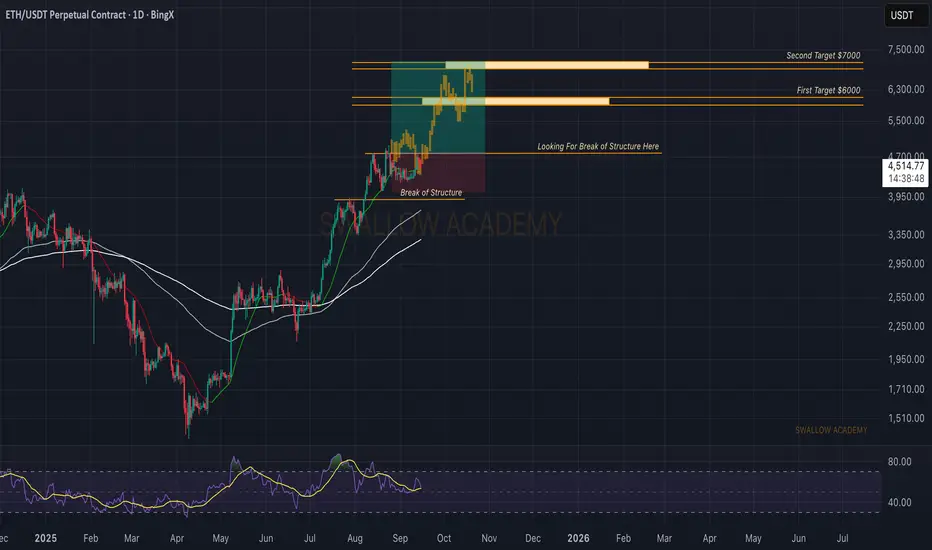
Ethereum (ETH): About To Explode | Very BullishGameplan remains the same, we wait for a break of the local high. Buyers keep the momentum, and once that breakout happens, we look for a strong move to the upside. First target sits at $7K, with $9K as the major one.
Swallow Academy

#ETHUSDT 4H ChartPrice previously reached the 4h supply zone where it got rejected perfectly as predicted. MACD is currently showing bearish indications, RSI is neutral and EMAs are bullish. Mix indications overall, but price is currently expected to tap into the 4h demand zone at around $4,450 before potentially continuing its bullish movements.

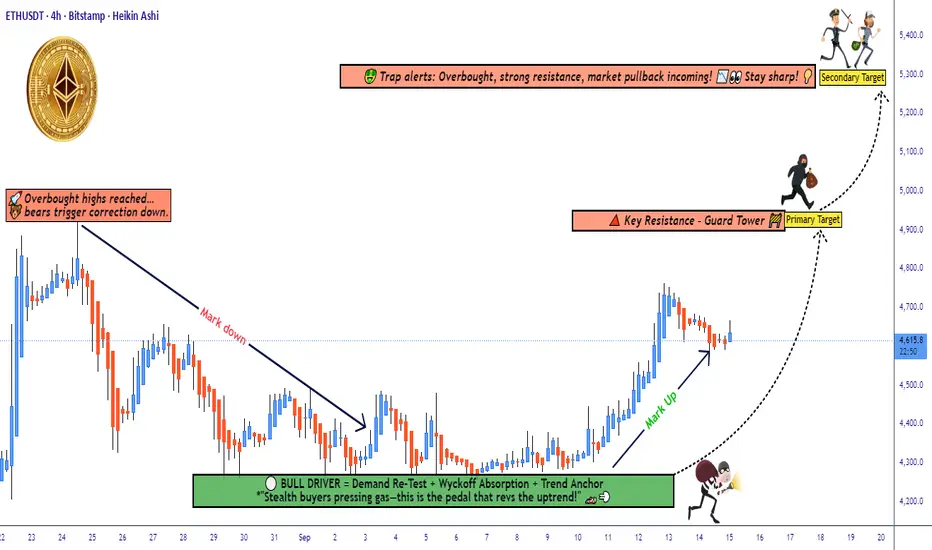
ETH/USDT Technical Outlook: Demand Layer Entries vs Trap Risk🚀 ETH/USDT | Ethereum vs Tether 💎
Crypto Market Money Looting Plan (Swing/Day Trade)
📌 Trade Plan (Bullish Outlook)
Setup: Demand Re-Test ✅ + Wyckoff Absorption 🔑 + Trend Anchor ⚓ (buyers confirmed presence)
Entry Style (Thief Layers 🪙): Using layered limit entries — examples: 4500, 4550, 4600, 4650 (you can add more layers as per your own method).
Stop-Loss (Protect the Vault 🔒): Example zone near 4400 after breakout. Adjust SL to fit your own risk appetite & personal strategy.
Target 🎯:
🎯 Primary: 4900 (local resistance)
🎯 Secondary: 5300 (major resistance / overbought zone)
🧾 Notes for Thief OG’s
This plan is not financial advice, only an idea. Always manage your own entries, SL, and TP.
Think of it as a vault strategy: take money, then protect money.
🔗 Related Pairs to Watch
BINANCE:BTCUSDT → ETH often follows BTC’s momentum. A BTC breakout/false move can affect ETH.
BINANCE:ETHBTC → Good pair to confirm ETH’s relative strength vs BTC.
BINANCE:SOLUSDT & BINANCE:BNBUSDT → Correlated majors; watch for rotation of capital in altcoins.
✨ “If you find value in my analysis, a 👍 and 🚀 boost is much appreciated — it helps me share more setups with the community!”
#ETH #Ethereum #Crypto #USDT #Altcoins #SwingTrade #DayTrading #LayerStrategy #Wyckoff #ThiefPlan #TradingView #CryptoTrading
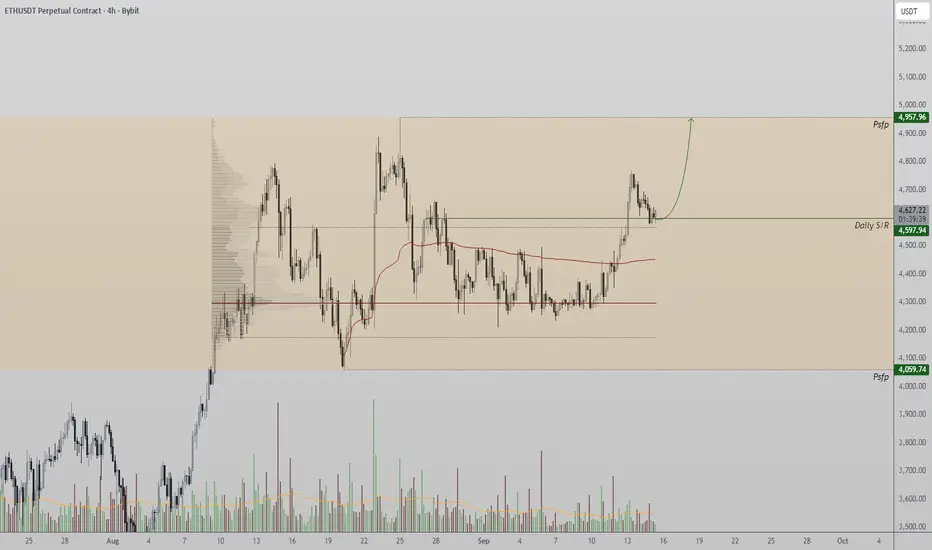
Ethereum - follow the plan Ethereum - follow the plan
new long after a local range
1st target 4957
full TP - 5393

Ethereum Retests Support and Eyes Higher ObjectivesETH price action has recently pivoted from key daily support, maintaining the broader uptrend. With structure intact and value area high reclaimed, buyers continue to show dominance.
Key Technical Points:
- Daily support at $4,600 has held.
- Value area high reclaimed as support.
- Potential upside target sits at $4,950.
The $4,600 level has proven to be a crucial foundation for Ethereum. After multiple tests, this region continues to hold as buyers defend it, creating conditions for a push higher. The bounce coincided with a reclaim of the value area high of the current range, a technical signal that suggests acceptance above prior supply.
Price structure remains bullish, with ETH printing consecutive higher highs and higher lows. This reflects healthy market dynamics and increasing demand. Importantly, each consolidation has been absorbed efficiently, leaving ETH primed for continuation.
If momentum persists, the $4,950 level is the next logical target. This region represents not just a technical objective but also an area where previous sellers might attempt to defend.
What to Expect in the Coming Price Action:
As long as ETH trades above $4,600, buyers retain control. Continuation toward $4,950 remains probable, with invalidation only if $4,600 breaks on strong volume.
Volatility Period: Around September 7th (September 6th-10th)
Hello, traders!
Follow us to get the latest information quickly.
Have a great day!
-------------------------------------
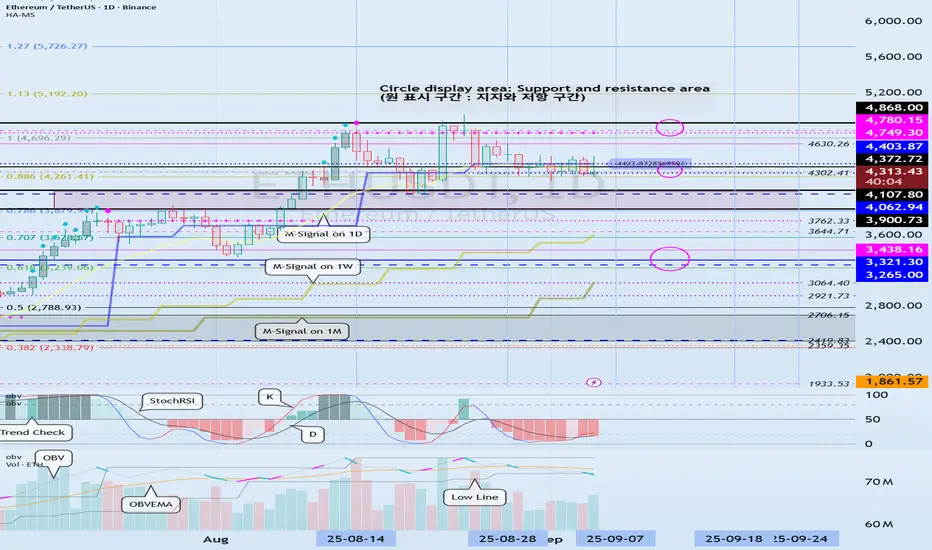
(ETHUSDT 1D Chart)
This volatility period is around September 7th (September 6th-10th).
After this period of volatility, the key question is whether the price can find support and rise above the 4403.87-4749.30 level.
-
To continue the cascading upward trend, the price must rise above 4749.30.
Therefore, we need to monitor whether the price maintains above the 4749.30-4868.0 level.
-
If resistance is encountered at 4403.87 and the price declines, it is likely to decline until it meets the HA-Low indicator.
Therefore, we need to check for support around 4302.41-4403.87.
However, there is a possibility of a rise after touching the previous all-time high (ATH) range of 3900.73-4107.80, so we need to consider a response plan.
If the price falls below 4107.80, it is expected to touch the M-Signal indicator on the 1W chart and resume the trend.
-------------------------------
The On-By-Signal (OBV) indicator is falling below the Low Line.
The TC (Trend Check) indicator is below 0.
The K value of the StochRSI indicator is showing signs of rising from the oversold zone.
If the High Line of the OBV indicator falls and forms a downward channel, it is highly likely that selling pressure will continue to dominate, so caution is advised when trading.
Therefore, the key issue this time is whether support is found around 4302.41-4403.87.
The TC (Trend Check) indicator is a comprehensive evaluation of the StochRSI, On-By-Signal (OBV), and PVT-MACD Oscillator indicators.
Therefore, if the TC indicator is below 0, selling pressure is dominant, and the price is likely to decline.
If the K value of the StochRSI indicator continues to rise, the price is likely to rise after this period of volatility.
However, for the uptrend to continue, the OBV and TC indicators must show upward trends.
-
Thank you for reading to the end.
We wish you successful trading.
--------------------------------------------------
- Here's an explanation of the big picture.
(3-year bull market, 1-year bear market pattern)
I'll explain more in detail when the bear market begins.
------------------------------------------------------