ETH/USDT 1D Chart📊 Current situation
• Price: approx. USDT 3,402
• Main trend: downwards - there is a clear downtrend line (black line) which acts as strong resistance.
• Key zones:
• Resistance: 3490-3990 USDT (green zones)
• Support: 3185 and 2700 USDT (red zones)
⸻
🧠 Market structure
• ETH moves below the trendline, confirming the dominance of sellers.
• After the recent decline, there was a rebound from the support at USDT 3185, but buyers' power is limited - daily candles have long upper wicks → supply pressure.
• If the price does not break through USDT 3,490–3,500, there is a risk of a retest of the USDT 3,185 support, and if it is broken, a possible decline to around USDT 2,700.
⸻
⚙️ Stochastic RSI (bottom of chart)
• Stochastic RSI is in the oversold zone (approx. 30), but the lines have not moved significantly upwards yet - i.e. there is no confirmed buy signal.
• If the indicator starts to curve upwards and crosses above 20, it could indicate a short-term rebound (upside potential to USDT 3,490).
⸻
🧭 Scenarios
🔺 Growth scenario (less likely)
• Breaking the trendline and staying above 3490 USDT will open the way to 3990 USDT.
• Requires increased buying volume (volume looks rather neutral for now).
🔻 Downside scenario (more likely)
• Rejection from 3490 USDT or from the trendline → drop to 3185 USDT.
• Breakout of 3185 = move to 2700 USDT (strong support from previous consolidations).
⸻
📈 Summary
• Trend: downward
• Short term: possible rebound to 3490, but the risk of further decline remains high.
• Key level to watch: 3,490 USDT (if it does not break, it is better to avoid longs).
• Potential long signal: only after breaking the trendline and retesting with confirmation of RSI > 50.
Trade ideas

Ethereum | Long | 3 hrs | Target: 4220This technical analysis is for informational and educational purposes only. It does not constitute financial advice. Remember to always research and consult with a professional before making investment decisions. Good luck! 📈💼🚀

ETH - BearishETHUSDT is in a bearish trend and currently retraced to 0.618 Fib level. Shorting at current levels.

See if it finds support near 3321.30 and can rise
Hello, fellow traders!
Follow us for quick updates.
Have a great day.
-------------------------------------
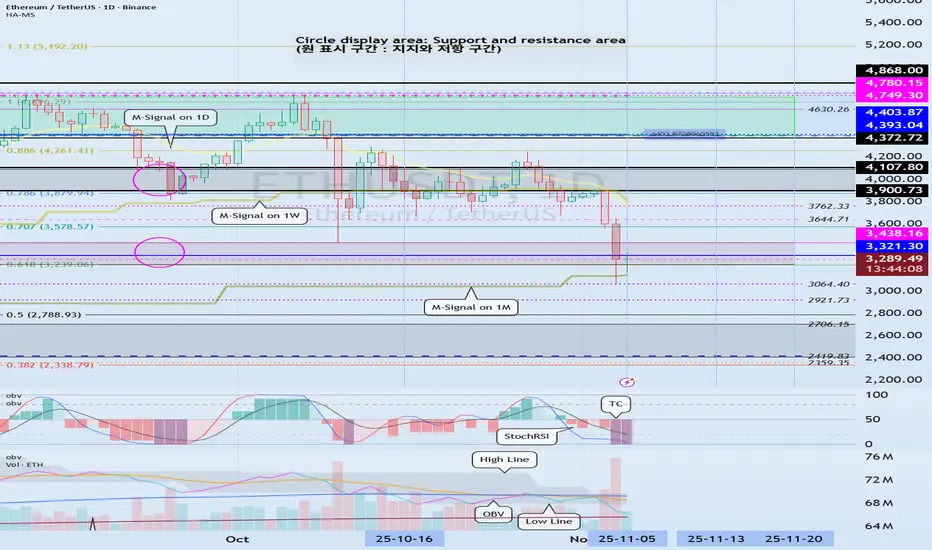
(ETHUSDT 1D chart)
There's no change from what I mentioned in my previous idea.
The M-Signal indicator on the 1M chart has been touched, so the trend will be re-determined.
At this point, it's crucial to check for support near the Fibonacci 0.618 (3239.06) - 3438.16 range.
If support fails and the price falls below the M-Signal indicator on the 1M chart, support should be checked around the 2419.83-2706.15 range.
-
Since the TC (Trend Check) indicator has touched its lowest point, a rebound is highly likely.
Therefore, determining support near the critical Fibonacci 0.618 (3239.06) - 3438.16 range is more important than ever.
Currently, ETH is in a period of volatility.
Therefore, we need to monitor the movement until November 6th.
The next period of volatility is around November 13th.
-
Thank you for reading.
We wish you successful trading.
--------------------------------------------------
ETH-USDTEthereum is still stuck below the level that was previously support and has now turned into resistance.
So it can start rising towards the trend line 💎📊
only when it overcomes the resistance above it.
The short-term support for Ethereum is $3,200 and $3,000.

ETHUSDT → Breakdown of the global trend. Distribution to 3360BINANCE:ETHUSDT is entering a distribution phase after breakdown of a consolidation formed against the backdrop of a bearish trend (correction). Sentiment, like the fundamental background, is changing...
Bitcoin is falling, which is putting pressure on the market. The reasons are weak fundamentals, index correction, and the rise of the dollar (outflow of funds from the market). On the daily ETH timeframe, we see a break in the uptrend. Monday's candle closed below the trend line, and since the opening of the session, the price has rallied (panic???)
Ethereum is coming out of consolidation (breakthrough of 3671). A distribution phase is forming, directed towards 3366 (liquidity pool). Technically, a false breakdown of support could trigger a pullback to 3600 (retest of the previously broken upward support line).
Support levels: 3366, 3150, 3000
Resistance levels: 3600, 3670, 3916
Despite the breakdown of the trend structure, we have strong support ahead. If the bulls hold 3366, the market may form a wider trading range. But if the overall background does not change, the decline may continue after the correction...
Best regards, R. Linda!

ETH-USDTIt is still stuck at the same level as yesterday that I mentioned. If the resistance level at 3400 is broken, it could start its upward leg.

AB=CD (5 WAVES)Hello traders — hope you’re all gathering some pips!
Quick ETH update on the 1D chart: we’ve just completed a clean AB=CD (1:1) after a five-wave drop into the PCZ, and price rejected the zone with a bounce from D ≈ 3,057. Bias turns bullish while we hold above the PCZ.
Symbol: ETHUSDT (1D)
Key Levels
A–B–C–D: A ≈ 4,756 → B ≈ 3,392 → C ≈ 4,254 → D ≈ 3,057
PCZ: 3,182 – 2,889 (D printed inside, strong reaction)
TP1: 3,735 – 3,919
TP2: 4,154 – 4,452
TP3: 5,016 – 5,314
Invalidation: daily close < 2,889
Plan
Long on a retest/hold of 3,18x–3,05x or on continuation above last bounce high.
Scale out 30% / 40% / 30% at TP1/TP2/TP3; trail under rising swing lows.
Risk
Risk ≤1%. Initial SL just below 2,889 (beyond PCZ). Move to BE after ~1R.
Notes
Structure respects Equal Length (AB=CD) and fib confluence; staying above the PCZ keeps the path open toward TP1 → TP2 → TP3.

ETH Mega long
Ethereum is awaiting the approval of the ETH ETF, which currently cannot happen due to the government shutdown. Once the government shutdown is over and normal practice resumes, as long as the ETH ETF gets approved then we should be Gucci.
My expectation is a revisit to the most recent low or potentially lower. My extended low targets would sit around 2300-2500 but initially I am not expecting much lower than 2900-2950. The 9H RSI has broken out of its support zone and is now retesting the bottom of that trendline, similarly the Daily is doing the same. This is the rejection we are looking for around 3400-3500, which will drive the price down.
If we get a scenario where BTC is not pumping as strongly then its possible people/business could transfer their BTC ETF holdings and swap them to ETH ETF holdings if the opinion is well BTC isnt pumping much or as stongly as ETH.
This idea is powered by the NakedNation community and BareNakedCrypto who you can find on socials and streams on Kick. Low key the goat!
This is not financial advice, I am not a financial advisor. It's just a bit of fun.

ETHUSDT: Short-Term Pullback Toward Trendline Before PotentialHi guys!
On the current 1h chart, Ethereum shows a clear structure of recovery following a liquidity sweep marked as “Hunting happened.” This move indicates that liquidity below the previous lows has already been collected, creating a potential base for a short-term bullish correction.
Price is currently consolidating above a minor support zone (highlighted in pink), showing a possible accumulation phase. The projected path suggests a potential bullish move toward the major supply zone around $4,080–$4,180, which aligns with the descending trendline acting as dynamic resistance.
However, given the overall bearish market structure and the dominance of the descending trendline, the area around $4,100 could serve as a strong reaction zone. A rejection from this level would likely confirm continuation of the broader downtrend, with a possible retracement toward the $3,700–$3,750 area.

ETH$9k target for CRYPTOCAP:ETH is becoming more realistic than ever as price structure continues to strengthen. Momentum is building fast, and both targets are aligning perfectly on the chart. I believe these setups will play out in the very near future, with potential for even higher levels ahead.

DeGRAM | ETHUSD held the $3000 level📊 Technical Analysis
● ETH/USD broke out of a consolidation range and is now testing the dynamic resistance line, indicating a potential retest of the $3,500 resistance level. The market recently rebounded from $3,000 support, showing signs of upward momentum.
● The price action respects a rising channel, which could suggest further bullish continuation if the dynamic support holds.
💡 Fundamental Analysis
● The broader crypto market sentiment remains positive, with growing institutional adoption and decreasing selling pressure.
✨ Summary
● Watch for resistance around $3,500 and support at $3,000. A breakout above $3,500 could target $3,800.
-------------------
Share your opinion in the comments and support the idea with a like. Thanks for your support!

ETHUSDT.P - November 7, 2025ETHUSDT.P is showing continued signs of short-term bearish momentum after rejecting from the $3,370 resistance zone. A short position is positioned around $3,280, targeting a move toward the $3,179 profit level for a quick scalp.

Bearish on ETHETH is likely to see a short-term rebound before declining below $3,000 to test the Monthly Demand zone.
I anticipate strong performance in January and February, with the potential for ETH to reach the $6,000 level.
We may have roughly one more month of bearish movement before the next upward phase begins.

Ethereum Analysis It's Just a bullback to broken resistance line.
Don't rush for buying.
The crypto market has entered a correction phase for now.
It will probably move up to around 3700–3900 before dropping again.
Stay alert and look for selling opportunities.
Eth Long Ok. So this might be one of the boldest trades one can take in such market conditions. Honestly, i panicked in sweat during this dip which usually means Fear in the market at its extreme.
Now imagine BTC ended oct in red, which usually means (based on history) that there is a 40% drop in BTC price incoming. This will usually nuke the crypto and altcoins matket. However, i came home and checked the monthly chart for ETH, which honsetly showing nothing but bullish vibes.
All analysis is based on the monthly timeframe (TF).
ETH shows a clear V-shape recovery (CSID structure) on the monthly chart.
Price currently sits around the 0.5 Fibonacci retracement level.
ETH is trading within a Monthly Fair Value Gap (FVG).
The structure is resting on a strong support zone (yellow box).
These combined elements indicate a bullish bias, not bearish.
From a liquidity perspective, the $4,500–$4,950 USDT zone forms a major liquidity pool likely to attract price.
On a higher zoom-out, price has already taken liquidity above the November 15 2021 high.
Therefore, from a liquidity-analysis standpoint, there remains potential for ETH to climb above $4,900 in the future.
i have set a one SL. Lets hope for the best in such market conditions.

ETHUSDTHi friends.
in eth charts, we can see the price succesfully fixed upside of 3900. when you check entire candles, you will see the price is in good situation for a good long position.
i think nowadays this is very low risk that we enter a long position from here.
good luck

ETH - Ranges overviewLet's have a look at ETH and its current trading range.
Similarly to BTC, ETH is currently trading towards its quarterly (3 months) sellside liquidity.
Pretty simple plan on ETH.
IF we fail to hold the current sellside liquidity expect us to trade lower towards the 2.8K-2.5K range.
IF we reclaim the current lows expect us to trade back towards 4K.
No need to frontrun the market. Let it come to you and trade with it.
Stay safe and never risk more than 1-5% of your capital per trade. The following analysis is merely a price action based analysis and does not constitute financial advice in any form.

Short trade
Day TF overview
📘 Trade Journal Entry
Pair: ETHUSDT.P
Direction: Sell-Side Trade
Date: Tue 4 Nov 25
Time: 12:40 pm
Session: NY Session PM
Timeframe: 1 Day
🔹 Trade Details
Metric Value
Entry 3,983.39
Profit Level (TP) 3,000.44 (+11.71 %)
Stop Level (SL) 4,141.42 (–4.7 %)
Risk–Reward (RR) 1:8.68
Projected Target
(Extended) 2,577.25 (–34.14 %)
🔸 Technical Context
Market Structure:
ETHUSDT has completed a Preliminary Supply → Buying Climax → UTAD sequence indicative of Wyckoff Distribution Phase C–D. Price has broken below the Change of Character (CHOCH) level at 3,900, confirming a bearish bias. The Breaker Block formed near 4,050 was retested and rejected — validating institutional sell-side control.
15min ~ TF overview
Fair Value Gaps (FVGs):
Multiple downside FVGs remain unmitigated between 3,800 → 3,000, offering magnet zones for draw-on-liquidity targets.
Daily inefficiencies suggest further markdown toward the 3,000 handle.
Confluence Factors:
Adaptive KAMA turning downward (bearish momentum confirmation).
High-volume rejection wicks at the 4,100–4,150 zone (supply confirmation).
A daily displacement candle formed after the retest (institutional order flow shift).
🔹 Narrative & Bias
ETH is transitioning into a markdown leg after completing a multi-month accumulation rally.
The rejection at 4,100 aligns with the broader crypto sector rotation into BTC dominance and short-term USD strength.
Phase Alignment:
Wyckoff Distribution → Phase D to Phase E progression.
Characterised by lower highs and successive liquidity sweeps.
Macro Sentiment:
BTC outperforming ETH across cross-pairs (ETHBTC ratio declining).
The market is reacting to tightening liquidity and lower risk appetite post-Fed communications.
Projection:
Primary target: 3,000 zone (daily FVG mitigation + PD array).
Extended target: 2,577 (institutional discount zone aligning with prior accumulation base).
Continuation bias is valid while below 4,050 resistance and until FVGs below 3,200 are filled.

ETHUSDT | Short Setup | VWAP Mean-Reversion | Nov 5, 2025ETHUSDT | Short Setup | Distribution → VWAP Mean-Reversion | Nov 5, 2025
🔹 Thesis Summary
ETH is bouncing inside a corrective leg after clear distribution. A retest of ~3,756 into prior value and VWAP resistance offers asymmetric short exposure toward 3.3k → 3.0k, with deeper paths to 2.5k–2.0k if risk-off accelerates.
🔹 Trade Setup
Bias: Short
Entry Zone: 3,720–3,780 (primary), optional add on overshoot into 3,860–3,900
Stop Loss (hard invalidation): 4,150 (daily close back above prior distribution high)
Take-Profits:
TP1: 3,300 (first VWAP/mid-range reaction)
TP2: 3,000 (range low / liquidity shelf)
TP3: 2,500 (capitulation pocket)
Max Target: 2,000 (cycle mean-reversion)
Indicative R:R (from 3,750 vs 4,150): TP1 ≈ 1.1R, TP2 ≈ 1.9R, TP3 ≈ 3.1R, Max ≈ 4.4R
🔹 Narrative & Context
Structure: Left-side distribution is clear; subsequent liquidation aligned with the classic cycle (distribution → correction → accumulation). Current rally is corrective into a prior value area/high-volume node around 3,750–3,900, where supply previously dominated.
VWAP & Means: Price is orbiting multi-week VWAP bands; first touch/retest of the upper band into that A-setup line near 3,765 is where sellers have edge with defined risk.
Sector & Rotations: SPX remains semiconductor-heavy; the Aug 25–Sep 20 window showed distribution/exit flows, consistent with a broad risk-off tone spilling into crypto. Alt breadth is weakening first (early panic tells).
Leverage & Flow (pro watch-items): Into the short zone, watch for positive perp funding + rising OI (late longs), ETH/BTC underperformance, and basis cooling—all consistent with a re-short after a squeeze.
🔹 Valuation & Context (Pro Metrics, Framed Simply)
Perp Funding Rate: Positive/expanding into resistance → indicates long-side crowding → increases squeeze-then-fade probability at 3.75–3.90k → supports short timing.
Open Interest vs. Price: OI rising on up-ticks → leverage adding into supply → raises liquidation risk on pullback → improves short R:R.
ETH/BTC Ratio: Weak/flat vs BTC → capital prefers base-layer beta over ETH beta → less support on bounces → aligns with lower targets on rejection.
🔹 Contrarian Angle (Your Edge)
Consensus is leaning toward “buy-the-dip into year-end flows.” Our read: acceptance back into prior value is failing, VWAP is capping, and leverage is rebuilding into supply. That combination often precedes a second-leg lower toward 3.0k with room to 2.5k if macro tightens.
🔹 Risks
Sudden risk-on impulse (index squeeze, dovish macro headline) pushing ETH through 4,150.
Catalyst risk (unexpected ETH-specific positive news/flows) that invalidates distribution.
Liquidity pockets: thin books amplify wicks; poor fills if size isn’t laddered.
🔹 Macro Considerations
DXY firming and VIX pressing higher favor risk-off follow-through; a DXY fade or vol crush would reduce downside velocity.
Gold stretched and due to cool → typically aligns with a broader cross-asset balance; a hard gold bid with rising VIX would strengthen risk-off.
Track NQ/semis: continued weakness supports the ETH short; a decisive semiconductor rebound would argue for patience or reduced size.
🔹 Bottom Line
Defined-risk short into 3,720–3,780 with invalidation 4,150. First objective 3,300, core target 3,000; extended bear paths 2,500–2,000 if macro stays risk-off. Trade the structure, hedge, and keep sizing disciplined.
🔹 Forward Path
If this post gains traction (10+ likes), I’ll publish:
A weekly-frame update on the distribution range and VWAP bands
Breakout/invalidations above 3.90k–4.15k and how that flips bias
Comments thread Q&A on execution (laddering, partials, hedge overlays)
Like & Follow for structured ideas, not signals. I post high-conviction setups here before broader narratives play out.
⚠️ Disclaimer: This is not financial advice. Do your own research. Charts may include AI-assisted enhancements.
🔹 Footnote
Forward P/E: Price divided by expected earnings over the next 12 months. Lower = cheaper relative to profits.
P/FCF (Price-to-Free-Cash-Flow): Price vs. the cash left after investments. A measure of efficiency.
FCF Yield: Free cash flow per share ÷ price per share. Higher = more cash returned for each dollar invested.
ROE (Return on Equity): Net income ÷ shareholder equity. Shows management efficiency with investor capital.
ROIC (Return on Invested Capital): Net income ÷ all invested capital (equity + debt). A purer profitability gauge.
Debt/Equity: Debt divided by equity. <1 usually means balance sheet is conservative.
R:R (Risk-to-Reward): Ratio of expected upside vs. downside. 3:1 = you risk $1 to make $3.

Ethereum Analysis – November 03, 2025Welcome to DIBA PRISM Daily Analysis 💫
Ethereum is currently in a bullish phase 📈 — compared to its previous market cycles and Bitcoin’s recent performance, ETH still shows room for further upside 🚀
Right now, Ethereum is in a corrective phase, and if it forms a higher low relative to the previous one, we can start looking for potential entry points 🎯
At the moment, price has reached a key zone, so it’s best to wait and observe Ethereum’s reaction before making any move 👀
Patience and timing will be the keys to catching the next big move ⚡
Disclaimer:
This content is for informational purposes only and does not constitute financial or investment advice. © DIBAPRISM
Larry D.Kohn

ETH....hanging by a threadIf ETH closes below the support box, we can expect to go down to the below rectangle.
It also has a tight (close) resistance above...

ETHUSDT SPOT BUY CYCLE ETHUSDT
Spot
Buy cycle midterm
TP 4654
% bubble ratio
Currently in a negative bubble with fair value at 4654
Spot trading plan:
Entry from (-30% bubble ratio level) and below…
Exit at TP 4654…
