ETHUSDT Imminent BUYWell, looks like the BUY should happen any moment from now. Hopefully, no devastating setback occurs😂📈
Trade ideas

The Levels on ETH That You're MissingYo, what's up. New chart, same story. ETH/USDT, let's look at the August playbook on the 1H chart.
The Setup
We kicked off August in the gutter, bottoming out at 3355. Then came the two-week joyride. Pure euphoria. We blasted past all-time highs to 4800 in mid-August, hitting that old November '21 resistance like a brick wall.
And then, as expected, we got our reality check. One ugly week where we dumped to 4070. That's a clean hit on the March/December '24 support and a perfect 0.5 Fibo retrace from that run. Don't let anyone tell you Fibo doesn't work in crypto.
A little nudge from the Fed got us back on our feet and we managed to break that last resistance. But now, we're back to some sideways movement with a slight downtrend on the 1H and 4H charts. The party's over for now.
What's Happening Now
Over the past week, we've been in a bearish trend on the 1H and 4H charts. What's interesting is that it's forming a beautiful descending wedge within the larger bullish trend. This is a textbook pattern that tells us volatility is condensing and a big move is likely coming soon. Inside this wedge, a smaller triangle has been coiling up since the 4070 bottom. Everything now hinges on the breakout of that orange triangle. (same pattern mid august)
The market has been bouncing between the pattern's boundaries, specifically at 4480 (resistance) and 4260 (support). The next direction depends entirely on which of these two levels gives way. Could this be signaling a new bullish trend?
The Levels That Matter Now
- To go higher: A strong breakout above 4480 is what we need to see. The price already corrected to the 0.786 Fibo, which often suggests that the selling pressure might be exhausted. If we clear this level, the path is open.
- To go lower: A breakdown below 4260 is the decisive point. It’s also a key 0.786 Fibo level from the recent pullback. Worst case, it's back down to the dumpster at 4070
Personally, I'm betting we run it back to a new ATH one more time for a final hoorah before the real bear season kicks off. But hey, that's just me.
Let's see who's right. As always, don't get rekt.

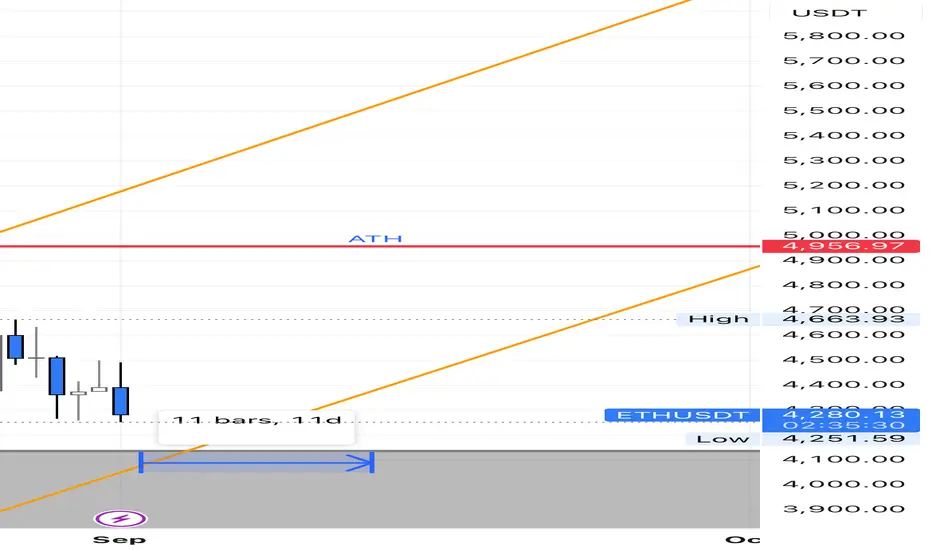
Ethereum Holds Above Key Support, Eyes Rotation Toward $7,200Ethereum is consolidating above $4,090, retesting a critical support zone. Market structure remains bullish, with the next upside target situated at $7,200, a key Fibonacci resistance level.
Ethereum’s price action is showing resilience as it consolidates above its previous all-time high, retesting the $4,090 support level. This zone represents a crucial pivot point for continuation higher, supported by strong technical confluence. With the weekly market structure still intact, Ethereum is preparing for a potential rotation toward higher resistance levels.
Ethereum (ETH) Key Technical Points
- Support at $4,090: Critical zone reinforced by bullish order block and value area low below.
- Market Structure: Weekly trend remains bullish with consecutive higher highs and higher lows.
- Upside Target at $7,200: Fibonacci resistance and major level in focus for continuation.
Ethereum is currently defending the $4,090 region, which has become a vital support following its breakout above previous all-time highs. This level not only represents horizontal structure but also aligns with a bullish order block just below. The presence of the value area low further strengthens the confluence, allowing for potential wicks into the zone before a bullish continuation.
Price action suggests that Ethereum’s bullish structure on higher timeframes remains valid. The weekly chart continues to print higher highs and higher lows, signaling a trend that is well intact. As long as $4,090 holds, the probability of continuation toward higher objectives outweighs the risk of a breakdown.
The next major resistance lies at $7,200, which represents a Fibonacci extension level. This region is significant because it marks not just a technical resistance but also a psychological milestone. A test of this level could attract renewed demand and potentially fuel an even higher rotation if breached with conviction.
Volume behavior will be crucial in confirming the move. Sustained bullish influxes are needed to validate momentum toward $7,200. Without increased participation, Ethereum risks extended consolidation around current levels. However, given the alignment of technical support zones and preserved market structure, conditions remain favorable for continuation.
What to Expect in the Coming Price Action
As long as Ethereum maintains the $4,090 support level, traders can expect continuation higher. A clean defense of this region opens the path toward $7,200, with the broader bullish structure intact. A breakout above this Fibonacci level would further extend Ethereum’s uptrend, while failure to defend $4,090 may trigger a wick into the value area low before continuation resumes.

Sep 2, 2025 - ETHUSDT 1H Chart Analysis-02Yesterday, Ethereum printed another bearish leg, but after reacting to the daily support, it managed to reverse that move and form a " V-shaped ” pattern — a positive signal for those of us looking for long opportunities.
Our entry trigger for ETH remains at 4,485.5 , and with this recent V-shaped recovery, our confidence in that trigger has increased.
Currently, if the trigger activates, the only logical stop-loss would be around 4,220 , which isn’t ideal. It would be better if ETH could form a higher low on the 1H timeframe later today, giving us the chance to enter with a tighter stop-loss.

ETH 1H Analysis – Key Triggers Ahead | Day 9💀 Hey , how's it going ? Come over here — Satoshi got something for you !
⏰ We’re analyzing ETH on the 1-hour timeframe timeframe .
🔭 On the 1-hour timeframe of Ethereum, we can see that after being rejected from the \$4500 alert zone, Ethereum moved downward and formed short-term support at the \$4371 area. If this level is broken, Ethereum could experience a deeper correction in the multi-timeframe view.
⛏ The key RSI levels are at 58 and 39. Once the oscillator crosses these levels, Ethereum can start its move.
💰 The size and number of Ethereum’s red candles are significantly greater than the green ones, and if this support is lost, Ethereum could move further downward into selling pressure.
🪙 On the 1-hour ETHBTC timeframe, we can see that after activating the short alert zone and receiving confirmation for a sell trade, Ethereum is moving downward. It has support at the 0.03996 level, which coincides with the 30 RSI zone or the OverSell boundary.
🔔 The alert zones considered for Ethereum are the \$4371 area and the \$4500 area. Based on price action in these zones, we can find the best trade opportunities. With further decline of ETH against Bitcoin, reduced volatility, and price leaning toward selling, we may see a deeper correction.
❤️ Disclaimer : This analysis is purely based on my personal opinion and I only trade if the stated triggers are activated .

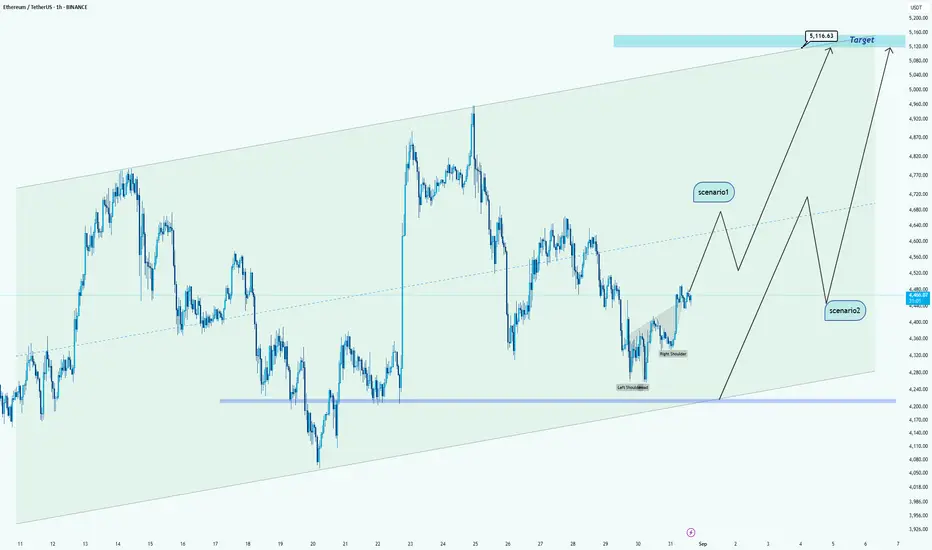
ETH/USDT Analysis -> towards upper levelsHello guys!
Currently, Ethereum is trading inside a clear ascending channel and has just formed a potential inverse head & shoulders pattern near the channel’s support. This setup gives us two possible scenarios:
🔹 Scenario 1:
If ETH continues its bullish momentum and breaks above the mid-line of the channel, we could see a strong push toward $5,116, which is also aligned with the channel’s upper boundary.
🔹 Scenario 2:
If ETH fails to hold above the current levels, we may first see a retracement back toward the $4,200 – $4,250 support zone (channel bottom). From there, the price can gather momentum and still aim for the $5,116 target in the bigger picture.
Conclusion:
Both scenarios point toward a bullish bias in the mid-term. The difference lies in whether we get a direct rally (Scenario 1) or a deeper correction before continuation (Scenario 2).
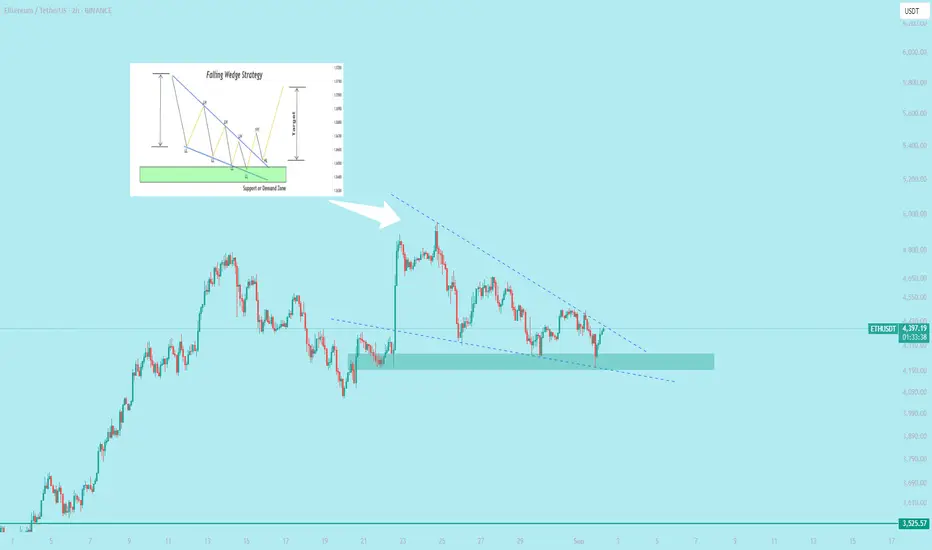
$ETH Performing falling wedge patternA **falling wedge pattern** is a bullish chart pattern in technical analysis. It forms when the price makes lower highs and lower lows, but the range narrows as the lines converge, creating a wedge shape sloping downward.
**Key Points:**
- **Bullish Signal**: Indicates a potential price reversal or breakout to the upside.
- **Structure**: Two converging trendlines—support (lower) and resistance (upper)—sloping downward.
- **Breakout**: Typically, the price breaks above the upper resistance line, signaling a bullish move.
- **Volume**: Often decreases as the wedge forms, then spikes on breakout.
- **Confirmation**: Wait for a breakout above resistance with strong volume for confirmation.
**Trading Tip**: Enter a long position after the breakout, with a stop-loss below the lower trendline. Target price is often the height of the wedge added to the breakout point.
Example: If Sahara stock shows a falling wedge, watch for a breakout above the upper trendline with high volume for a potential buy signal.
ETH at a Crossroads: Bounce or Breakdown?ETH at a Crossroads: Bounce or Breakdown?
ETH hit our first target at 4335 and bounced back over the weekend.
Right now, it's testing a strong resistance zone—the same area that caused a drop before. If this zone holds, ETH could start another bearish wave (as shown in the black scenario), but the setup still needs more time to develop.
If ETH pushes a bit higher, it might reach 4650, where another resistance zone could trigger a reversal.
BTC also looks weak, and if it drops, ETH might follow—even though it’s holding up better for now.
Overall, it’s still a risky setup, especially with the USD lacking clear direction.
I lean toward the bearish scenario in black, but we’ll need to watch how things unfold.
You may find more details in the chart!
Thank you and Good Luck!
PS: Please support with a like or comment if you find this analysis useful for your trading day

ETHEREUM LONG POSSIBLE 13RRThe entry is between 0.382% fibonacci retracement level from april 2025 lows to august highs with the value area high from april lows as well and anchored vwap from june 22th, 0.618% and 0.651% fibonacci retracement levels from july 12th to aug highs in confluence with daily level and daily/weekly naked point of control alongside with the point of control from july 18th to august highs.
Entry: $3,660.76
Stop Loss: $3,526
Take Profit: $5,415

Possible BUY on ETHUSDTWe finally gotten our 3rd Touch on the Main Bullish Trendline.
We await the hopeful breakout of the Bearish Counter Trendline.

Eth short updateEth moved nicely you can take partial profit here and move your sl to secure your trade 😉
Enjoy gains

Is ETH on its way to a new ATH? ETH not long ago made a new ATH right at the top of the rising channel before stating to head back down again. Price is now getting close to hitting a horizontal weakly resistance level, and also the support level in the rising channel. I think in around the next week or so price of ETH will go down to where the horizontal resistance level and the support of the channel both intersect before making a new ATH.
Possible support level: $4,150-$4,050
Possible ATH amount: $5,500-$5,600 or more
ETH/USDT (4H) 1. Trend
• The price is in the downward channel (designated orange lines).
• The last candle tests the lower restriction of the channel → Possible reflections or breaking down.
2. Horizers of support and resistance
• resistance (green lines):
• 4,440 USDT
• 4,382 USDT
• Support (red lines):
• 4,268 USDT (currently tested)
• 4,247 USDT
• 4,176 USDT
• 4 090 USDT (stronger support)
If 4,268 is pierced and maintained below, a further exit can be around 4 176–4 090.
3. RSI (Relative Strength Index)
• Currently RSI oscillates below 50 → Bear advantage.
• There is still a strong sale signal (<30), so theoretically there is still a space to decline.
4. Chop (Choppiness Index)
• The indicator shows a fairly "jagged" market → no strong trend, but from the current context of more bear pressure.
⸻
📊 Scenarios:
• Bull (reflection): If the price stays above 4 268 and reflects from the bottom line of the channel → possible traffic towards 4 382 and 4 440.
• Bear (continuation of declines): closing the candle 4h below 4,268 → a signal for further drop to 4 176 and even 4 090.

How to Read Japanese Candles ProperlyWhen traders first look at a chart, they often see what looks like a chaotic mix of red and green bars with shadows. These are Japanese candlesticks — the main language of financial markets. But for many, they remain a mystery: what does a long wick mean? Why does one candle look strong while another looks weak? How can you find structure in this chaos?
In reality, candles are not just colored shapes. Each one represents a small battle between buyers and sellers. The body shows where price opened and closed, while the wicks mark the extremes of that session. A green candle reflects bullish control, a red one shows bearish dominance.
The details matter most. A long upper wick signals that buyers tried to push higher but sellers pushed back. A long lower wick means the opposite — heavy selling pressure was absorbed, and buyers regained control. A doji with small body and long wicks highlights indecision and often warns of a possible shift.
Single candles rarely tell the whole story; combinations and context are far more valuable. A “hammer” at support after a downtrend hints at reversal. A “bullish engulfing” pattern after a series of red candles shows momentum shifting to buyers. On the flip side, a “hanging man” near resistance often warns of correction.
Timeframe also changes the narrative. A candle on the 1-minute chart tells a completely different story than a candle on the daily chart. Aligning short-term candles with higher timeframes helps distinguish noise from meaningful moves.
Experienced traders never rely on candles alone — they integrate them into a system. Candles are confirmed with support and resistance, volume dynamics, divergences, and overall trend structure. Only then does a clear picture of the market emerge.
The key, however, is eliminating emotions. Traders who focus only on candles often act chaotically — exiting too early, holding losing trades too long, or entering impulsively. But when combined with algorithmic analysis and structured trade management, candles become a clear language: they show where the market weakens, where momentum builds, and where it makes sense to take profits.
Japanese candlesticks mirror crowd psychology. Yet only a systematic approach allows traders to truly read their signals. When the market looks chaotic, structure and automation bring control back to the trader, turning emotions into cold calculation.
Possible ETHUSDT Insane BUYThe 3rd Touch on the Bearish Counter Trendline has happened. Now, we wait for the 3rd Touch on the Bullish Main Trendline.

ETH Market Update📊 ETH Market Update
ETH has formed a trading pattern and is now testing the blue support zone 🔵
👉 This is a critical level — a breakout is coming soon, but the question is: up or down?
⚠️ If CRYPTOCAP:ETH breaks below the blue support, sellers could take control and push price lower.
⚡ If CRYPTOCAP:ETH holds support and buyers step in, we could see a bounce and bullish continuation.
👉 Key takeaway: Wait for clear confirmation before entering — the next breakout will define the trend direction.
