ETH....hanging by a threadIf ETH closes below the support box, we can expect to go down to the below rectangle.
It also has a tight (close) resistance above...
Trade ideas

ETH/USD Technical OutlookETH/USD Technical Outlook: Price remains within a long-term ascending channel. Current correction could form an ABC pattern, with key Fibonacci retracement levels at $3,832 (38.2%) and $2,715 (61.8%). If bullish momentum resumes, extension targets point to $4,570 and $5,300

ETHUSDT | Short Setup | VWAP Mean-Reversion | Nov 5, 2025ETHUSDT | Short Setup | Distribution → VWAP Mean-Reversion | Nov 5, 2025
🔹 Thesis Summary
ETH is bouncing inside a corrective leg after clear distribution. A retest of ~3,756 into prior value and VWAP resistance offers asymmetric short exposure toward 3.3k → 3.0k, with deeper paths to 2.5k–2.0k if risk-off accelerates.
🔹 Trade Setup
Bias: Short
Entry Zone: 3,720–3,780 (primary), optional add on overshoot into 3,860–3,900
Stop Loss (hard invalidation): 4,150 (daily close back above prior distribution high)
Take-Profits:
TP1: 3,300 (first VWAP/mid-range reaction)
TP2: 3,000 (range low / liquidity shelf)
TP3: 2,500 (capitulation pocket)
Max Target: 2,000 (cycle mean-reversion)
Indicative R:R (from 3,750 vs 4,150): TP1 ≈ 1.1R, TP2 ≈ 1.9R, TP3 ≈ 3.1R, Max ≈ 4.4R
🔹 Narrative & Context
Structure: Left-side distribution is clear; subsequent liquidation aligned with the classic cycle (distribution → correction → accumulation). Current rally is corrective into a prior value area/high-volume node around 3,750–3,900, where supply previously dominated.
VWAP & Means: Price is orbiting multi-week VWAP bands; first touch/retest of the upper band into that A-setup line near 3,765 is where sellers have edge with defined risk.
Sector & Rotations: SPX remains semiconductor-heavy; the Aug 25–Sep 20 window showed distribution/exit flows, consistent with a broad risk-off tone spilling into crypto. Alt breadth is weakening first (early panic tells).
Leverage & Flow (pro watch-items): Into the short zone, watch for positive perp funding + rising OI (late longs), ETH/BTC underperformance, and basis cooling—all consistent with a re-short after a squeeze.
🔹 Valuation & Context (Pro Metrics, Framed Simply)
Perp Funding Rate: Positive/expanding into resistance → indicates long-side crowding → increases squeeze-then-fade probability at 3.75–3.90k → supports short timing.
Open Interest vs. Price: OI rising on up-ticks → leverage adding into supply → raises liquidation risk on pullback → improves short R:R.
ETH/BTC Ratio: Weak/flat vs BTC → capital prefers base-layer beta over ETH beta → less support on bounces → aligns with lower targets on rejection.
🔹 Contrarian Angle (Your Edge)
Consensus is leaning toward “buy-the-dip into year-end flows.” Our read: acceptance back into prior value is failing, VWAP is capping, and leverage is rebuilding into supply. That combination often precedes a second-leg lower toward 3.0k with room to 2.5k if macro tightens.
🔹 Risks
Sudden risk-on impulse (index squeeze, dovish macro headline) pushing ETH through 4,150.
Catalyst risk (unexpected ETH-specific positive news/flows) that invalidates distribution.
Liquidity pockets: thin books amplify wicks; poor fills if size isn’t laddered.
🔹 Macro Considerations
DXY firming and VIX pressing higher favor risk-off follow-through; a DXY fade or vol crush would reduce downside velocity.
Gold stretched and due to cool → typically aligns with a broader cross-asset balance; a hard gold bid with rising VIX would strengthen risk-off.
Track NQ/semis: continued weakness supports the ETH short; a decisive semiconductor rebound would argue for patience or reduced size.
🔹 Bottom Line
Defined-risk short into 3,720–3,780 with invalidation 4,150. First objective 3,300, core target 3,000; extended bear paths 2,500–2,000 if macro stays risk-off. Trade the structure, hedge, and keep sizing disciplined.
🔹 Forward Path
If this post gains traction (10+ likes), I’ll publish:
A weekly-frame update on the distribution range and VWAP bands
Breakout/invalidations above 3.90k–4.15k and how that flips bias
Comments thread Q&A on execution (laddering, partials, hedge overlays)
Like & Follow for structured ideas, not signals. I post high-conviction setups here before broader narratives play out.
⚠️ Disclaimer: This is not financial advice. Do your own research. Charts may include AI-assisted enhancements.
🔹 Footnote
Forward P/E: Price divided by expected earnings over the next 12 months. Lower = cheaper relative to profits.
P/FCF (Price-to-Free-Cash-Flow): Price vs. the cash left after investments. A measure of efficiency.
FCF Yield: Free cash flow per share ÷ price per share. Higher = more cash returned for each dollar invested.
ROE (Return on Equity): Net income ÷ shareholder equity. Shows management efficiency with investor capital.
ROIC (Return on Invested Capital): Net income ÷ all invested capital (equity + debt). A purer profitability gauge.
Debt/Equity: Debt divided by equity. <1 usually means balance sheet is conservative.
R:R (Risk-to-Reward): Ratio of expected upside vs. downside. 3:1 = you risk $1 to make $3.

$ETH $3,800 is the Critical Catalyst for the Next Major Move!CRYPTOCAP:ETH $3,800 is the Critical Catalyst for the Next Major Move 🚨
The recent #Ethereum (#ETH) washout brings us to a massive decision point. The $3,800 level isn't just a number it's where the current relief rally meets the heavy overhead resistance (downtrend line + key volume zone).
Watch $3.8k Closely:
Rejection: If we get a clear rejection (a lower high), expect the bear trend to continue, targeting the recent lows.
Breakout: A sustained close above $3.8k and the downtrend line flips the script, igniting optimism and potentially giving us a free road back to the $4.4k - $5k highs. 🚀
What's your bet?
#CryptoMarket

Ethereum Testing Major Resistance ZoneEthereum continues to respect the long-term ascending trendline, maintaining a healthy market structure.
However, the price has once again approached the critical resistance zone between $3,500–$3,800, where sellers historically dominated.
This area remains a key decision point for ETH:
🔹 A confirmed breakout above $3,800 could open the way to $4,500–$4,800, continuing the macro uptrend.
🔹 A rejection here, however, might trigger a deeper pullback toward $2,550–$1,950, aligning with the ascending trendline and liquidity zones below.
The weekly trend still favors buyers, but momentum shows signs of exhaustion.
In my view, ETH needs a period of consolidation before any sustainable breakout.
Long-term structure intact but short-term patience is key.

ETH - Ranges overviewLet's have a look at ETH and its current trading range.
Similarly to BTC, ETH is currently trading towards its quarterly (3 months) sellside liquidity.
Pretty simple plan on ETH.
IF we fail to hold the current sellside liquidity expect us to trade lower towards the 2.8K-2.5K range.
IF we reclaim the current lows expect us to trade back towards 4K.
No need to frontrun the market. Let it come to you and trade with it.
Stay safe and never risk more than 1-5% of your capital per trade. The following analysis is merely a price action based analysis and does not constitute financial advice in any form.

ETH Monthly Masterplan – From Frogs to the Moon 🐸 1. Miracle’s Take – The Legendary Leap Begins!
“Yo yo yo! Miracle here – and ETH just jumped outta the swamps straight into the order block jungle! 🐸💥”
We kissed the Order Block Buy zone like it’s the holy ground of memes 📿
3 Buy Levels hit – frogs were loading while normies were panicking 🤡
Price now chilling near the FOMO Zone – and trust me, most are buying now that it's too late
First target: 4,100 💸
Second target: 5,700+ – That’s where meme dreams start getting real!
Ultimate dream: 6,100+ – That’s a 250% leap... Frogs do fly 😤
💣 But yo, don’t ignore that massive Sell Order Block between 4.1K and 5K.
"Miracle Rule: You don't chase green candles – you trap 'em in green nets." 🎣
🟥 If we fall? Warning zone at 1.9K and hell no below 1.3K – STOP LOSS city 🚨
🐸 “ETH isn’t just a coin. It’s the ticket to meme kingdom.”
🔍 2. Clean Technical Breakdown – Analyst Mode
ETHUSD Monthly shows a textbook rebound from a long-term demand zone (“Order Block Buy”)
Three strong entry levels respected:
$2,142
$2,269
$2,394
Current price is retesting FOMO zone, last seen as local resistance
First Take Profit: $4,100
Second Take Profit: $5,718
Final fib extension target: $6,116 (254% from lows)
“Price must break and close above $2,750 with volume for confirmation.”
A monthly close below $1,942 is a strong warning
Final invalidation at $1,331, where structure is broken
“Respect the order blocks. Trade the levels.”
🎭 Which side are YOU on this time?
📈 Logical Analysis OR 🐸 Meme Mastery?
💬 Type #TeamMiracle or #TeamAnalyst and let the ETH prophecy unfold!
🎬 @TradeWithMky – where altcoins speak louder than Bitcoin!
#ETHtoMoon #EthereumMonthly #TradeWithMky #AltcoinSeason #MemeAnalysis

ETHUSDT – Short-Term Bounce Before Another DropEthereum is currently showing signs of a mild recovery after the sharp selloff seen earlier this week. Despite the ongoing bearish sentiment in the crypto market, a short-term rebound is forming as price finds support around the $3,300 zone.
Recent news highlights large outflows from Ethereum ETFs, signaling cautious investor sentiment. However, on-chain data also points to short-term accumulation, suggesting that some traders are taking advantage of lower prices to re-enter the market. This has helped ETH recover slightly toward the $3,700 region — a key resistance area aligned with the descending trendline and previous supply zone.
Still, the $3,700 area remains a potential turning point. If buyers fail to sustain momentum here, sellers may regain control, pushing ETH back down to $3,300 or lower in the next sessions.

ETHUSDT.P - November 7, 2025ETHUSDT.P is showing continued signs of short-term bearish momentum after rejecting from the $3,370 resistance zone. A short position is positioned around $3,280, targeting a move toward the $3,179 profit level for a quick scalp.

Short trade
Day TF overview
📘 Trade Journal Entry
Pair: ETHUSDT.P
Direction: Sell-Side Trade
Date: Tue 4 Nov 25
Time: 12:40 pm
Session: NY Session PM
Timeframe: 1 Day
🔹 Trade Details
Metric Value
Entry 3,983.39
Profit Level (TP) 3,000.44 (+11.71 %)
Stop Level (SL) 4,141.42 (–4.7 %)
Risk–Reward (RR) 1:8.68
Projected Target
(Extended) 2,577.25 (–34.14 %)
🔸 Technical Context
Market Structure:
ETHUSDT has completed a Preliminary Supply → Buying Climax → UTAD sequence indicative of Wyckoff Distribution Phase C–D. Price has broken below the Change of Character (CHOCH) level at 3,900, confirming a bearish bias. The Breaker Block formed near 4,050 was retested and rejected — validating institutional sell-side control.
15min ~ TF overview
Fair Value Gaps (FVGs):
Multiple downside FVGs remain unmitigated between 3,800 → 3,000, offering magnet zones for draw-on-liquidity targets.
Daily inefficiencies suggest further markdown toward the 3,000 handle.
Confluence Factors:
Adaptive KAMA turning downward (bearish momentum confirmation).
High-volume rejection wicks at the 4,100–4,150 zone (supply confirmation).
A daily displacement candle formed after the retest (institutional order flow shift).
🔹 Narrative & Bias
ETH is transitioning into a markdown leg after completing a multi-month accumulation rally.
The rejection at 4,100 aligns with the broader crypto sector rotation into BTC dominance and short-term USD strength.
Phase Alignment:
Wyckoff Distribution → Phase D to Phase E progression.
Characterised by lower highs and successive liquidity sweeps.
Macro Sentiment:
BTC outperforming ETH across cross-pairs (ETHBTC ratio declining).
The market is reacting to tightening liquidity and lower risk appetite post-Fed communications.
Projection:
Primary target: 3,000 zone (daily FVG mitigation + PD array).
Extended target: 2,577 (institutional discount zone aligning with prior accumulation base).
Continuation bias is valid while below 4,050 resistance and until FVGs below 3,200 are filled.

ETHUSDT.P - November 6, 2025ETHUSDT has broken below its ascending trendline, signaling potential bearish momentum. The setup suggests a short bias with a profit target near $3,275 and a stop level around $3,485, aligning with a risk-reward structure favoring downside continuation.

Ethereum Technical Analysis – November 6, 2025Ethereum Technical Analysis – November 6, 2025
Ethereum (ETH) is currently trading below the descending trendline and sitting right on the key support zone at $3,340.
As long as this trendline remains intact, the bearish scenario is still in play.
The first resistance levels are found between $3,379 and $3,391.
If Ethereum fails to break above this zone and drops below $3,340, the next support targets are around $3,291 and $3,211.
However, if strong bullish candles appear above the trendline, we may see a short-term recovery move toward higher resistance zones.

Eth Long Ok. So this might be one of the boldest trades one can take in such market conditions. Honestly, i panicked in sweat during this dip which usually means Fear in the market at its extreme.
Now imagine BTC ended oct in red, which usually means (based on history) that there is a 40% drop in BTC price incoming. This will usually nuke the crypto and altcoins matket. However, i came home and checked the monthly chart for ETH, which honsetly showing nothing but bullish vibes.
All analysis is based on the monthly timeframe (TF).
ETH shows a clear V-shape recovery (CSID structure) on the monthly chart.
Price currently sits around the 0.5 Fibonacci retracement level.
ETH is trading within a Monthly Fair Value Gap (FVG).
The structure is resting on a strong support zone (yellow box).
These combined elements indicate a bullish bias, not bearish.
From a liquidity perspective, the $4,500–$4,950 USDT zone forms a major liquidity pool likely to attract price.
On a higher zoom-out, price has already taken liquidity above the November 15 2021 high.
Therefore, from a liquidity-analysis standpoint, there remains potential for ETH to climb above $4,900 in the future.
i have set a one SL. Lets hope for the best in such market conditions.

DRAGONFLY DOJI - ETHA Dragonfly Doji is a candlestick pattern that looks like a “T”.
It means the price dropped during the candle but then came back up to close near the opening price.
This shows that buyers pushed the price back up, and it can be a bullish reversal signal, especially after a downtrend like we saw right now on ETH.
Fingers crossed, bulls!

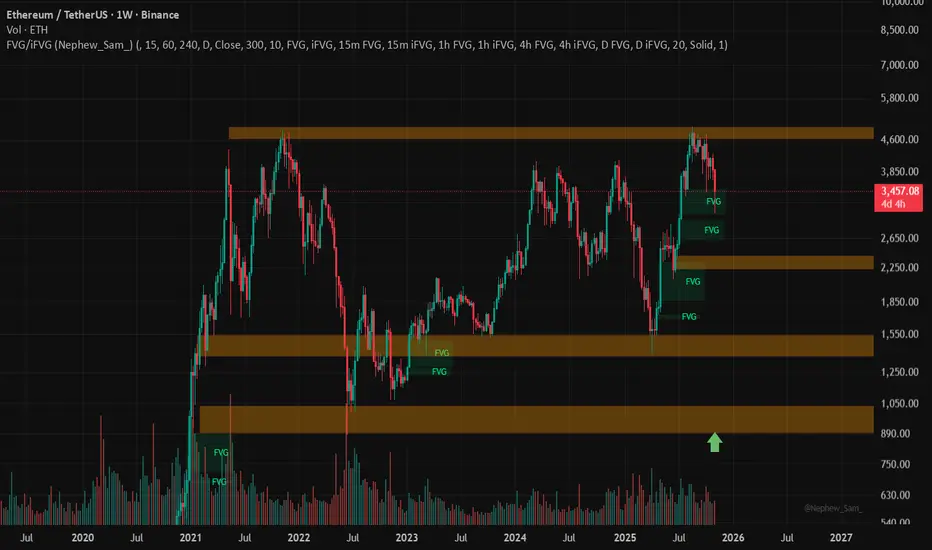
Ethereum Outlook (Weekly Analysis)Ethereum (ETH/USDT) is currently trading around $3,450 , facing a strong correction of nearly –11.5% after failing to hold above the $4,600 resistance zone. The weekly chart highlights several key Fair Value Gaps (FVGs) and major demand zones, which could play a crucial role in the coming months.
Key Observations:
Resistance Zone: The $4,500–$4,800 range remains a strong supply area, previously rejecting price twice (in 2021 and 2025).
Support Levels: Multiple FVGs are visible between $2,200 – $2,800, indicating potential short-term support.
Major Demand Zone: A significant long-term demand block lies around $1,300 – $1,500, which historically acted as a strong accumulation area.
Momentum: Weekly candles show declining volume during the recent rally, suggesting buyer exhaustion and possible retracement before continuation.
Outlook:
If Ethereum maintains support above $2,800, the broader bullish structure remains valid, potentially aiming again toward $4,600 in early 2026. However, a break below $2,500 could open the path toward deeper retracement near $1,500 — aligning with the lower FVGs and historical demand zone. 900$?
ETHUSDT SPOT BUY CYCLE ETHUSDT
Spot
Buy cycle midterm
TP 4654
% bubble ratio
Currently in a negative bubble with fair value at 4654
Spot trading plan:
Entry from (-30% bubble ratio level) and below…
Exit at TP 4654…

4th time the charm ? After visiting the demand zone 4 times, ETH finally got some traction. I got in a long after the 4th time hitting the demand zone, now waiting for a break out confirmation to visit the next run up. Watch the 3 key levels in yellow for TP target / break out for continuations.
Happy Trading!
Don't over leverage and make sure you have stop loss to prevent down side risk from market spike.
Not financial advise, this is pure speculation.

ETH-USDTEthereum has created a positive divergence on the RSI✔️
It has made good returns whenever it reaches the 30-25 range on the RSI. 3300-3400 is an important range for Ethereum in the medium term that should not be broken.

ETH WEAKLY STRONGAs seen on the chart, there’s still nothing to worry about in the ETH/USDT pair on the weekly timeframe. The trend that started in 2022 continues to act like a magnet, keeping the price around it. I expect the support zone at 2990–2770 to hold strong. MACD is likely to break its downtrend resistance within this month, and RSI is slowly cooling off. Upcoming ETH staking news and other positive developments could trigger the next bullish trend.

$ETH at Crucial SupportThe market took a hit - total cap fell from $4.28T to $3.5T, and CRYPTOCAP:BTC is testing support near $103,800. We’ve seen this setup before: panic, whales moving coins, fear everywhere. Yet November often flips sentiment fast - historically, Bitcoin averages +40% this month.
Ethereum is under heavier pressure, possibly heading toward $2,700-2,500 zone. $3,300 remains the key level to watch staying above it keeps the momentum alive, but a break below could open the door to downside pressure.
But these shakeouts often reset the market before the next trend begins - and when liquidity returns, Ethereum usually leads the rebound.
The crypto market is bleeding, major assets like CRYPTOCAP:BTC , CRYPTOCAP:ETH and others have been slipping while liquidity pulls back and sentiment cools.
The total market cap has dipped; multiple large‑cap coins are down over the last 24 hours. We’re possibly entering a phase where panic gives way to opportunity, but timing and tone matter. What’s your move: sit tight, buy the dip, or wait for a clearer signal?

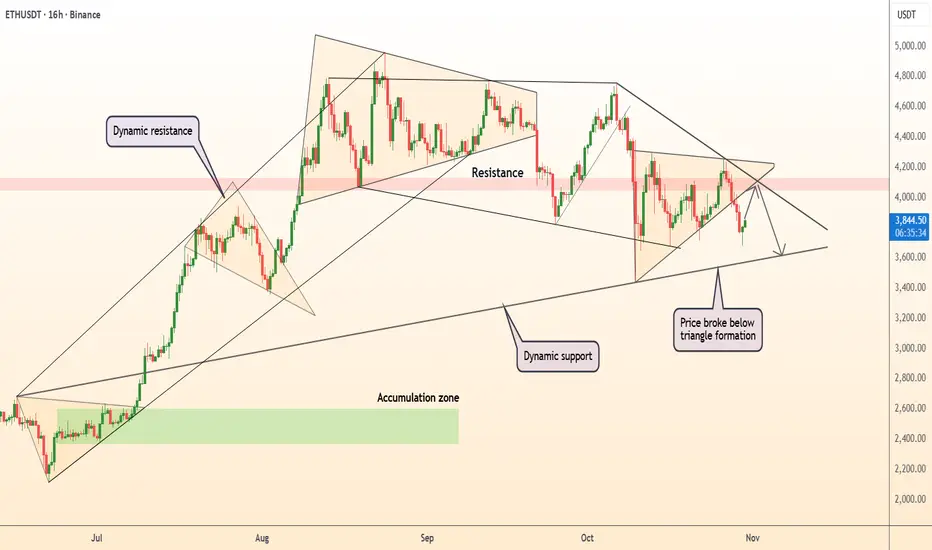
DeGRAM | ETHUSD formed a triangle📊 Technical Analysis
● ETH/USD broke below a triangle formation, confirming a bearish continuation from the dynamic resistance area near $4,200.
● Price action suggests a potential move toward the $3,600–$3,500 zone, aligning with the next dynamic support and continuation of the corrective structure from September highs.
💡 Fundamental Analysis
● Ethereum faces downside pressure as on-chain activity slows and ETF speculation cools amid risk-off sentiment in broader markets.
✨ Summary
● Short bias below $4,200; targets $3,600–$3,500. Breakout and weakening fundamentals support medium-term bearish momentum.
-------------------
Share your opinion in the comments and support the idea with a like. Thanks for your support!
ETHUSDT 4-Hour Chart Analysis. ETHUSDT 4-Hour Chart Analysis.
ETH is forming a falling wedge, a typically bullish reversal pattern, with price just above strong support ($3,389, orange line).
RSI: The indicator is showing bullish divergence—price is making lower lows, but RSI lows are rising, hinting at possible reversal.
Expect further consolidation or small dips toward wedge support, followed by a breakout attempt.
On breakout, resistance is at $3,900–$4,100, then $4,830 as the next major target.
ETH is holding above support and showing bullish RSI divergence. Watch closely for wedge breakout—this could trigger a strong rally if confirmed.
DYOR | NFA

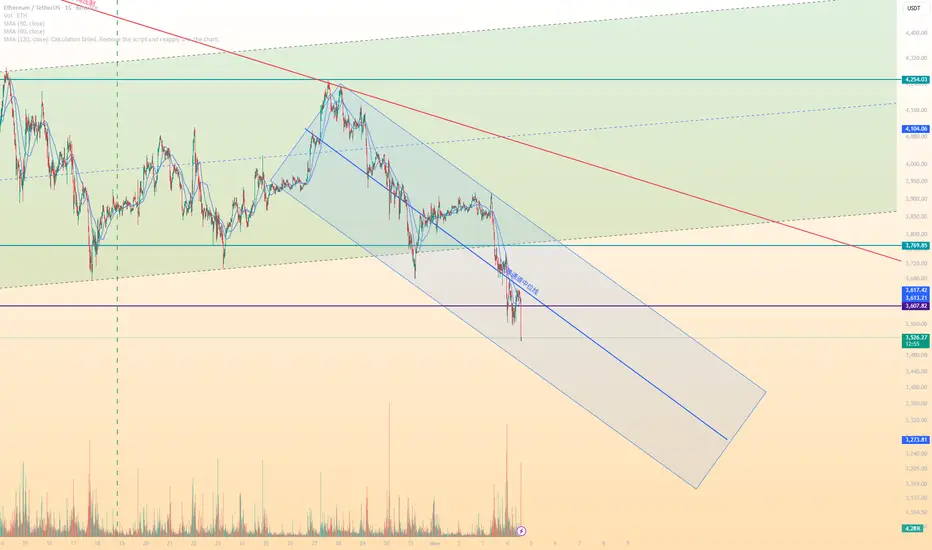
Short ETH in Miidle Line of TunnelETH Down, Short ETH in Miidle Line of Tunnel.
First price target: 3500
Second price target: 3000
Perhaps 3000 is the current bottom.