DeGRAM | ETHUSD will rebound from the support area📊 TECHNICAL ANALYSIS
● The chart shows Ethereum forming a broad symmetrical triangle (from June to Nov), with price currently near the lower trend-line support (approx $3 000) and facing a descending dynamic resistance line. A bounce at the support zone suggests buyers are stepping in.
● Price action indicates a test of the key accumulation zone around $3 000–$3 100 (green area). A successful rebound toward the descending resistance (~$3 600-3 800) and subsequent break could signal the start of the next upward leg (wave count suggesting completion of corrective triangle).
💡 FUNDAMENTAL ANALYSIS
● Despite recent weak sessions, the upcoming Fusaka upgrade (early Dec 2025) brings network improvements for Ethereum (lower fees, better scalability), which supports long-term bullish structure.
● Major institutional accumulation is shown by growing net supply increase (+18 262 ETH over one week) and large investors building positions, signalling underlying conviction even amid market pullback.
✨ SUMMARY
● Long bias: expect rebound from ~$3 000–$3 100 support zone.
● Key trigger: hold support + break above ~$3 600 resistance for continuation.
● Targets: initial move toward ~$3 600-$3 800, with broader potential beyond thereafter given upgrade tailwinds.
● Risk: if support fails (~$3 000), downside opens.
-------------------
Share your opinion in the comments and support the idea with a like. Thanks for your support!
Trade ideas

ETH — Signs of StrengthEthereum has printed a lower low at point B, but quickly reclaimed the low of A — another sign of strength despite overall market weakness.
From a Wyckoff perspective, the elevated volatility around A may indicate a Selling Climax (SC), where panic selling was actively absorbed. The lower low at B followed by a sharp recovery fits the structure of a Terminal Shakeout, which reduces the floating supply before a potential Mark-Up phase.
Price is currently interacting with the descending R-line. A breakout above this level may signal the start of a bullish impulse.
What I expect next:
— Potential bullish breakout above the R-line
— Formation of a local uptrend within the channel
— Move toward the 3,350–3,450 resistance zone, where the mid-term trendline is located (marked as Target)
— Possible confirmation of a shift toward a more bullish market tone heading into the new week

ETHIt looks like a bottom here. My target is around 3600. BTC closed the weekly candle below the 50 WMA, but I wouldn’t rule out a bounce.

Bearish!!ETH Market updates (Based on current price 3164)
- Below EMA 50, 200
- Showing lower highs, lower lows
- No bullish reversal signal
- No bullish divergence
- Heavy selling volume
- Weak buyers above 3150
This thesis keeps short valid

ETH-USDT
Given the current conditions of the crypto market, a sharp rebound can't be expected for now.
However, it can continue moving slowly and steadily towards the trend line.
Ethereum's support is at 3210 📊📊📊💰💰

SHORT & SHORT in ETHHello fellow traders,
I’m opening a risk-entry short position on ETH with a 1:10 risk-to-reward ratio. This is a speculative entry based on early signals rather than full confirmation, so proper risk management is key.
Reasons for the trade:
Price is showing signs of exhaustion after the recent move, indicating a possible short-term reversal.
Momentum indicators are weakening, suggesting bullish strength may be fading.
Key resistance level is holding, and the market has not shown strong follow-through above it.
Market sentiment appears to be shifting, with increasing hesitation at higher levels.
This is a high-reward but higher-risk setup, so I’m keeping my position size controlled and will be quick to exit if invalidated.

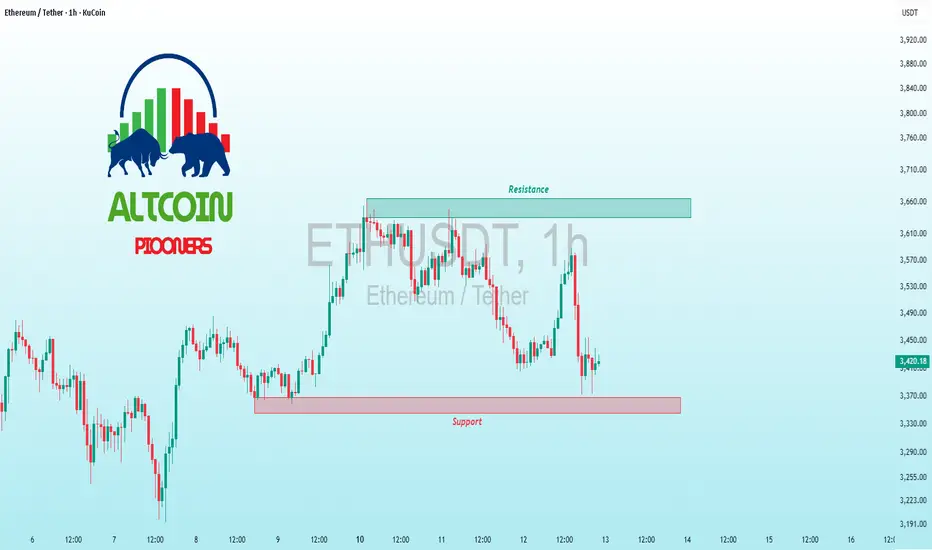
$ETH Bear Trap or Leg Down? Support Battle RagesKUCOIN:ETHUSDT CRYPTOCAP:ETH Bear Trap or Leg Down? Support Battle Rages
Altcoin Pioneers! 🔴 ETH/USDT 1H is in full retreat, slicing through the descending channel and probing support at ~3,000 after a brutal rejection at resistance 3,560. That red trendline from recent highs is unyielding, with volume confirming seller control – but oversold signals flashing.
Hold support? Fingers crossed; a doji at lows could spark a fakeout bounce if BTC stabilizes. Breakout above resistance? Slim, needs >3,550 close on ETF hype. Deeper dip risk? High – invalidation eyes 2,950 (Fib 0.786), alt bleed incoming.
Target: Rebound to 3,150 if holds, plunge to 2,980 on break. Eyes on: RSI divergence (at 32), VWAP for intraday bias, and ETH/BTC ratio for decoupling clues. Buckle up! ⚡📉
#ETH #CryptoMarkets #TradingSignals

Ethereum Just Reclaim this Broken Trendline If Ethereum manages to reclaim this broken long-term trendline, then it can easily reach around $7,700 by December 31, 2025 . All we need is a proper reclaim of that major trendline — and it genuinely looks like Ethereum might do it in the coming days. This is a real ray of hope for us.
You already know that once Ethereum breaks above $5,000 , a full, heavy altseason is likely to get activated. So don’t lose hope — the game is not over yet. There is still a bright opportunity ahead.
Forget Bitcoin for now. Focus on Ethereum and the altcoins. They are the ones currently showing real strength.

ETH Capital Sector. Price Slice 8008.45 K🏷 Capital Sector. Price Slice 15.11.2025
8008,45 — At the time of publication, the price had not yet been reached. ( на момент публикации цена не достигнута )
7284.29 — At the time of publication, the price had not yet been reached. ( на момент публикации цена не достигнута )
7026.69 — At the time of publication, the price had not yet been reached. ( на момент публикации цена не достигнута )
5957,54 — At the time of publication, the price had not yet been reached. ( на момент публикации цена не достигнута )
5390,34 — At the time of publication, the price had not yet been reached. ( на момент публикации цена не достигнута )
5075,09 — At the time of publication, the price had not yet been reached. ( на момент публикации цена не достигнута )
4873,69 — At the time of publication, the price had not yet been reached. ( на момент публикации цена не достигнута )
4759,55 — At the time of publication, the price had not yet been reached. ( на момент публикации цена не достигнута )
4390,43 — At the time of publication, the price had not yet been reached. ( на момент публикации цена не достигнута )
🏷 At the request of close colleagues, friends, and supporters of my work, I am publishing this analytical material in English—for the international institutional community and conscious retail market participants.
🏷 This slice reflects the logic of institutional capital movement. It is critical to understand: price is formed only when sufficient liquidity from the retail sector and sustained crowd interest are present. Without this condition, institutional interest remains potential, but unrealized.
🏷 Meanwhile, institutional capital operates on entirely different temporal and structural charts than those visible on the screens of most traders.
🏷 Therefore, a superficial view of price is doomed to distortion.
🏷 Methodology: Pre-Factum
🏷 My analytical markings are built on the principle of Pre-Factum—anticipating the fact before it manifests. This is not forecasting in the traditional sense, but identifying capital intent prior to its physical manifestation on the chart.
🏷 The central element of this method is identifying a price sector as an intention—where the instrument is striving to go—regardless of its current price action: no emotions, only cold calculation. Every price has its own timeframe.
🏷 There are three ways to interact with unfulfilled price levels:
🏷 1. Trade from the level—enter upon confirmed structural validation.
🏷 2. Wait for fulfillment—observe price movement toward the level without entering, focusing on instrument behavior.
🏷 3. Trade in the direction of the level—utilizing support/resistance levels with strict risk control.
🏷 If you choose the third path, deep understanding of market mechanics becomes mandatory. Without experience, conscious perception of liquidity behavior, and prior study of relevant materials, entering such positions is premature.
🏷 This applies equally to retail newcomers and professionals whose attention remains scattered by short-term timeframe noise.
🏷 Relevance of Markings
🏷 The levels presented here are current, fresh institutional capital markings. They do not invalidate previously identified unfulfilled prices but complement them within the context of evolving liquidity and shifting market logic.
🏷 A flag placed prior to price touch—with the publication date (level, sector—whichever you prefer)—indicates that the instrument, with high probability and regardless of current price movement, intends to execute a move toward that price.
🏷 Two examples:
🏷 Example #1 — BTC:
On the screenshot from September 26, 2025, I marked the price of 106,110 with a blue flag (color is my personal labeling). Screenshot:
The instrument subsequently deviated from this level by 15%, creating pressure: on October 10, 2025, price declined sharply, collecting all long positions.
Instrument slide:
🏷 Example #2 — ETH:
On October 12, I marked the price of 3,291.60 with a yellow flag:
On November 4, the instrument reached the marked price:
🏷 I have directed your attention to specific prices—and there are many such examples in my feed. If you study my materials, you will see: this is a new methodology, currently not demonstrated by anyone else in the world. The precise slice and price sector I have developed reveal the true mechanics of the market.
🏷 Once price reaches a flagged zone, the marking loses its original function. It must be updated to reflect the new logic of capital movement—otherwise, it becomes a misleading reference or a conventional technical analysis level.
🏷 These markings are not static. They are dynamic markers of intent, requiring constant reassessment. It is precisely these that we uncover through the method of capital anticipation.
🏷 Temporal Context
🏷 I emphasize separately: the flag carries not only a price function, but also a temporal one. The publication date is the fixed point of my observation and identification. It serves as my anchor: where and when I captured institutional intent.
🏷 My entire architecture of price sectors is systematically organized into chronological folders. I have already demonstrated this structure in one of my videos—for those who seek to think structurally, not reactively. Use translators as needed to study my demonstration.
🏷 This is not a forecast. It is a map of intent.
🏷 Read it with respect for liquidity, time, and capital intelligence.
🏷 English is not my native language. With international exposure, time will come—I will provide new reference points as needed, without compromising institutional interests or the balance of many market participants. I do not disclose the entire price sector or the skill of seeing any instrument within its price sector for security reasons. You must determine for yourself how to engage with institutional analysis.
🏷 There are traders, and there are analysts—two distinct classes. The mindset between institutional analysis and trading is fundamentally different.
🏷 As you see, I do not use indicators. This is mathematics, logic, and an intellectual system I created—my proprietary property. I have come only to help you see a different structure.
🏷 The battle of titans is a clash of attention and timing.
🏷 The question is not who is right—but who has the resources and patience to unload positions.
🏷 Who leads whom? The one who sees further and holds institutional leverage.
🏷 You have received a map. Most see an image; few read the message. The difference is not IQ, but the habit of looking toward the future—not at indicator noise.
🏷 Institutional capital meticulously crafts candles, as if scripting the narrative to suit its preferred triggers. I, operating from the shadows, read the plan: where entry points will be set, where liquidations will be scheduled, who will hold positions until the bell.
🏷 I offer possibilities, not commands. But let us acknowledge: a hint is an art—and it transforms curiosity into dependency. Do you remember the echo of these words?
🏷 I have shown you another side of analysis—I have designed what you have been waiting for, and what you have grown weary of. This is new technical analysis: to understand how to control the capital sector—study the materials. The secrets are mine. I give you part of this understanding to help you.
🏷 Not tricks, not guesses—but architecture.
🏷 Let it sound mystical—it must. A map in the hands of one who can read between the candles always appears as prophecy to those accustomed to indicator noise.
— The Architect

ETHUSDT: Price Aims For $3,500 ? Here Is Why...Hello everyone,
Lets take a grasp on ETHUSDT. Ethereum has been on bearish fall for some couple of weeks now. trending on a momentum move of lower highs and lows, in regards to this market structure and other time frames.
Presently the price is at the support zone, moving up slowly towards resistance, also as lower high.
Key points;
More confirmation above this support level, would trigger an upward rise to $3,500-$3,550 as the next partial resistance.
Happy weekend to you all.
Thanks for reading.

Ethereum updateLast night, after a rejection, the price touched a **trendline resistance** and is now bouncing back from that area. Buyers seem to be showing more strength at the moment, and it looks likely that the price could **revisit the range high** once again.

$ETH Support Test Amid Volatility – Ready for Rebound?KUCOIN:ETHUSDT CRYPTOCAP:ETH Support Test Amid Volatility – Ready for Rebound?
Current trend: ETH is grinding lower in a choppy range, now hugging the pivotal 3,370 support after a swift rejection from 3,470 highs—buyers defending hard, but volume thinning signals caution ⚡.
Hold support? Likely yes, with hammer candles forming and price stabilizing; a close above 3,390 flips bias bullish.
Breakout above resistance? Possible if BTC stabilizes—targeting 3,550 on volume surge, unlocking alt momentum.
Dip risk? Elevated to 3,300 if support cracks on weak close, especially with overbought divergence looming.
Target: Upside 3,550 short-term; deeper 3,700 if 3,470 clears decisively.
Indicators watching: RSI dipping to 40 (bounce zone), Bollinger Bands squeezing for volatility pop, and OBV for accumulation confirmation 📉.
#ETHTrading #CryptoBounce #AltcoinPioneers
Long trade
1hr TF overview
📘 Trade Journal Entry
Pair: ETHUSDT.P (Perpetual Contract)
Date: Wed 12th Nov 2025
Time: 7:00 AM
Session: London to New York Session AM
Direction: Buyside Trade
Timeframe: 15-Minute
🔹 Trade Details
Entry: 3552.98
Profit Level (TP): 3807.27 (+7.17%)
Stop Level (SL): 3530.45 (–0.63%)
Risk-Reward Ratio (RR): 11.31
🔹 Technical Context
Market Structure:
🧾Prior Consolidation Phase at top range followed by a significant markdown breaking below structural support.
🧾The secondary retest formed at the base level (3244–3200 zone) aligned with liquidity grab beneath prior lows (PDL).
🧾Subsequent shift in structure (CHOCH → BOS) on the 15M chart suggests transition from distribution to early accumulation.
Key Confluences:
🧩Fair Value Gaps (FVGs) identified within the 0.75–0.25 retracement zone, acting as re-entry and mitigation areas.
🧩Breaker Block formation confirmed following BOS, validating bullish continuation setup.
🧩Volume expansion visible around 3550 region, signalling strong buy-side interest.
🧩Kaufman Adaptive Moving Average (KAMA) providing dynamic trend support near 3475 level.
📈Target Narrative:
We assume that price aims to rebalance inefficiency toward the 3,800–3,850 liquidity zone, corresponding to prior unmitigated FVG and institutional range midpoint.
🔹 Narrative & Sentiment
The setup reflects a buyside re-accumulation model emerging from deep discount levels post-sell climax. The corrective structure within the descending wedge aligns with the Wyckoff “Spring” and “Test” phase, suggesting smart money re-entry before expansion.
Macro sentiment also supports ETH strength into mid-November amid rotational flow from BTC dominance cooldown and speculative positioning ahead of CPI data.

Ethereum analysis Hello traders,
Ethereum, based on the higher time frame (weekly) and the lower time frame (4-hour), is showing bullish potential. As you can see, after taking liquidity below the weekly level and returning to the previous range — along with a confirmed trigger candle on the 4-hour chart and RSI dropping below 30 (oversold) — I believe we could see Ethereum retest the $4,000 level.
Stay profitable!

ETHUSDT – Reclaiming Liquidity Zone, Eyeing Supply TestETH successfully closed above the $3,350 liquidity area on both the 3D and weekly timeframe, confirming a clean liquidity sweep and reclaim. This type of move often signals the start of a bullish rebound, which we’ve already seen with ETH recovering strongly over the weekend.
Currently, price is likely heading toward the supply zone between $3,930 – $3,795, where we should monitor the reaction closely. A rejection from this zone could trigger a short-term pullback, potentially revisiting the $3,350 support area once again. However, if ETH manages to break and close above this supply, the next major challenge will be the key resistance near $4,089, a crucial level before retesting the All-Time High (ATH) region.
On the flip side, the bearish scenario would be a weekly close below $3,350, opening the door for a deeper retracement toward the Monthly Order Block (OB) zone around $2,878 – $2,125. This could unfold if Bitcoin also drops below the $100K level, reinforcing broader market weakness.

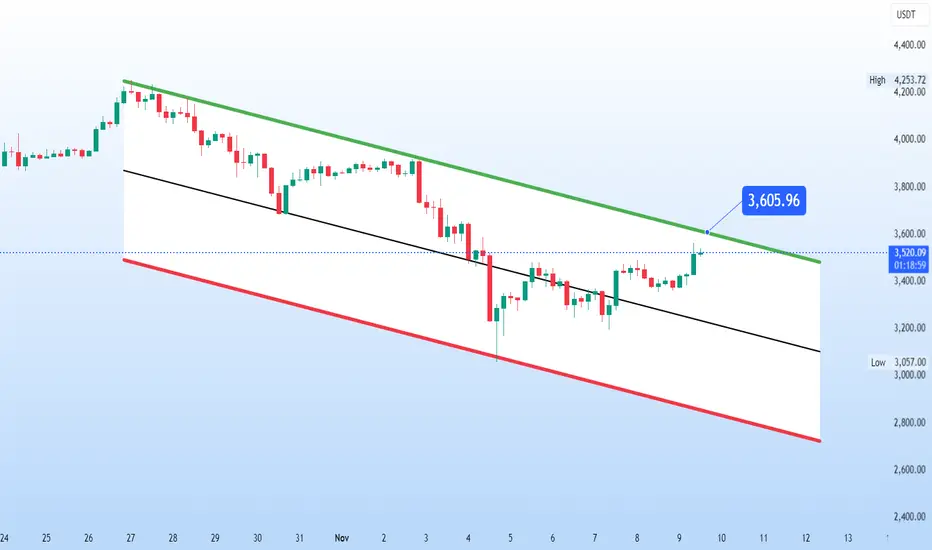
Can Ethereum Holders Help Price Break Its Month-Long Downtrend?Ethereum’s price stands at $3,604 at the time of writing, hovering just below the critical $3,607 resistance mark. The altcoin king has been struggling against its descending trendline for over a month, making this level a key breakout point.
If Ethereum can flip $3,607 into support, the next target would be $3,802, followed by a potential move toward $3,950. Sustained support from LTHs and rising sentiment could fuel this upward trajectory, allowing ETH to escape its bearish grip.
However, if investors begin taking profits, Ethereum could slip below the $3,489 support level. A further decline toward $3,287 would invalidate the bullish thesis. This would signaling renewed selling pressure and extending the ongoing downtrend.

Ethereum and a Very Critical Resistance👋🏻 Hey everyone! Hope you’re doing great! Welcome to SatoshiFrame channel.
✨ Today we’re diving into the 4-Hour Ethereum analysis. Stay tuned and follow along!
🪙 In the 4-hour timeframe, Ethereum is positioned below a key resistance at $3,627. Breaking this level could push the price upward and extend the ongoing multi-timeframe bullish leg into higher timeframes such as the 4-hour and daily charts.
📊 The volume of Ethereum has increased after touching the maker-buyer zone, and this volume expansion has remained consistent as it broke its multi-timeframe resistances. Currently, to break through the marked resistance zone in the chart, Ethereum needs strong volume and whale candles.
🧮 On the RSI oscillator in the 4-hour timeframe, we can see the oscillation remains below the 70 zone and hasn’t crossed it yet. The 70 level itself aligns with the $3,627 resistance area, making it a crucial zone to watch.
✍️ You can read the possible scenarios for Ethereum in the continuation of the analysis, but what’s important to note is that this zone may come with a fakeout, and we might hit a few stop-losses, so proper capital and risk management is essential.
✅ Long Position Scenario:
A breakout above the $3,627 resistance zone, accompanied by sustained buying volume and the RSI crossing above 70, could form a solid setup for an Ethereum long position. If this scenario plays out, a small stop-loss size would be suitable for the trade.
❤️ Disclaimer : This analysis is purely based on my personal opinion and I only trade if the stated triggers are activated .

seems ETH likely to drop further the support zones on the chart are enough to tell the story price is likely gonna hit the trendline, and in that zone, we can long from there


“ETHEREUM Just Flipped Bullish — Strong Reversal Signal Ethereum just printed a strong bullish breakout from key structure on the 4-hour chart.
✅ Signal: Strong bullish engulfing candle closing above resistance
🎯 Long Entry: $3,550 zone
🛑 Stop Loss: $3,517
🎯 Target: $3,700+
This move shows clear momentum shift — bulls stepping back in with strength after multiple rejections.
I’ll be watching closely for a retest of the breakout zone before continuation.
What’s your take — do we break $3,700 next, or is this a bull trap? 👀
Drop your thoughts and analysis below!
#Ethereum #ETHUSDT #CryptoTrading #PriceAction #TradingView #CryptoAnalysis #ETH #BullishSetup #SmartMoney #CryptoCommunity #TradeWithMky

ETH is still moving inside a clean descending channel on the 4HCRYPTOCAP:ETH is still moving inside a clean descending channel on the 4H.
Price is now testing the mid-range and approaching the upper boundary near $𝟯,𝟲𝟬𝟬. Until this channel breaks to the upside, I can’t turn bullish.
For now, nothing to see here, just channel-bound movement waiting for confirmation of strength.

Simple short on EthMy thought process is quite basic, price broke through a support zone and i'm taking the sell from the closest resistance considering the bulls are not acting from a clear zone
