Order Block 3Overall Market Context
The market appears to be in a downtrend or a significant correction within a larger range. This is evidenced by:
The current price ( ~3,456.77 ) is trading well below the listed resistance levels, which start at 3,650.00.
The short-term performance shows a decline of -10.48 (-0.30%).
1. Order Block (Powerful) Analysis
An Order Block is a key area on the chart where a significant amount of market orders was placed, causing a strong and decisive price move (a "power move"). This area often becomes a future support or resistance zone.
Interpretation:
The label "Order Block (powerful)" is present, but its exact price level is not specified in the text. However, we can infer its likely location based on the FTR (Fair Value Gap) and price levels.
Likely Location: The most probable location for this powerful order block is just above the current price, likely in the zone between ~3,475 and ~3,500. This area may have been the origin of a strong bearish move that drove the price down to its current level.
Role: Since the price is below it, this Order Block now acts as a strong resistance zone. For the bearish trend to continue, the price should react down from this zone. A break and close above it could signal a potential reversal or a deeper retracement upwards.
2. Hidden Base Analysis
A "Hidden Base" typically refers to a consolidation or accumulation zone that is not immediately obvious on lower timeframes. It's an area where institutional or large-volume traders are building positions without causing significant price waves, often before a strong continuation move.
Interpretation:
Again, the exact location is not specified, but we can deduce its purpose.
Likely Location & Scenario: Given the downtrend context, the Hidden Base is likely forming near the current price or slightly below it (e.g., between 3,450 and 3,400).
Purpose: In a downtrend, a Hidden Base near the lows suggests potential accumulation by sellers or a pause before the next leg down. It's a "reload" zone. The market is consolidating, building up energy (liquidity) to make its next significant move. A break below this Hidden Base would likely trigger the next wave of selling.
3. FTR (Fibonacci Trend Resonance) & Sup/Res/Div Analysis
FTR uses Fibonacci retracement and extension levels in conjunction with market structure to identify high-probability reversal zones. "Sup & Res & Div" refers to Support, Resistance, and Divergence.
Interpretation:
The text lists numerous price levels. We can group these into key Support and Resistance clusters for the FTR analysis.
Key Resistance Levels (FTR Sell Zones):
Primary Cluster: 3,650 - 3,600. This is the strongest resistance area.
Secondary Cluster: 3,550 - 3,525. This would be the first major test if the price were to bounce.
Immediate Resistance: The Order Block (~3,475-3,500) and the level at 3,456.77 (if the price retraces) are the nearest supply zones.
Key Support Levels (FTR Buy Zones):
Immediate Support: 3,456.77 (Current Price) and 3,450.00.
Major Support Cluster: 3,400 - 3,375. A break below this area would be very bearish.
Lower Supports: 3,300, 3,250, 3,200 are significant psychological and technical levels if the downtrend accelerates.
Trade ideas

ETHUSDTHi friends.
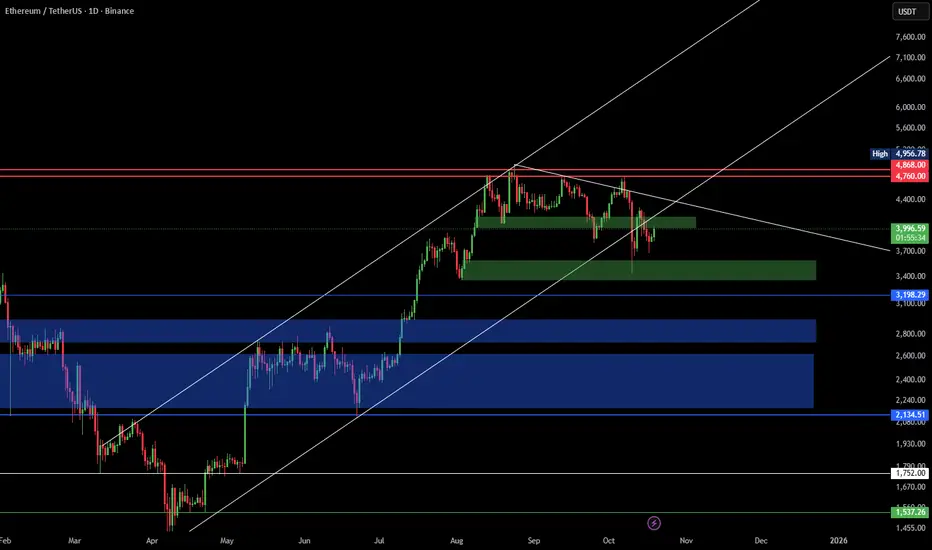
in eth charts, we can see the price succesfully fixed upside of 3900. when you check entire candles, you will see the price is in good situation for a good long position.
i think nowadays this is very low risk that we enter a long position from here.
good luck

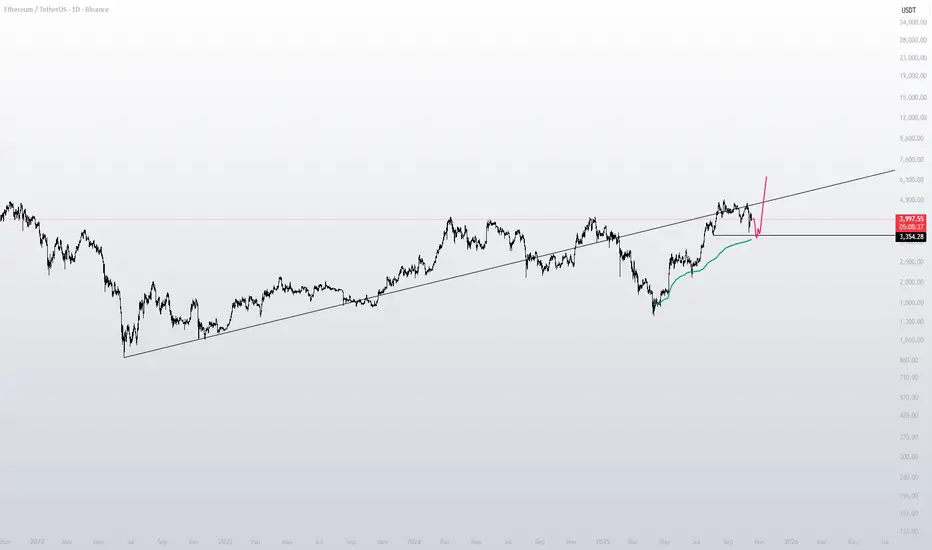
ETHUSDTFollow the previous TA, i drawed order blocks in our way to reach the Final target...
please check both TAs

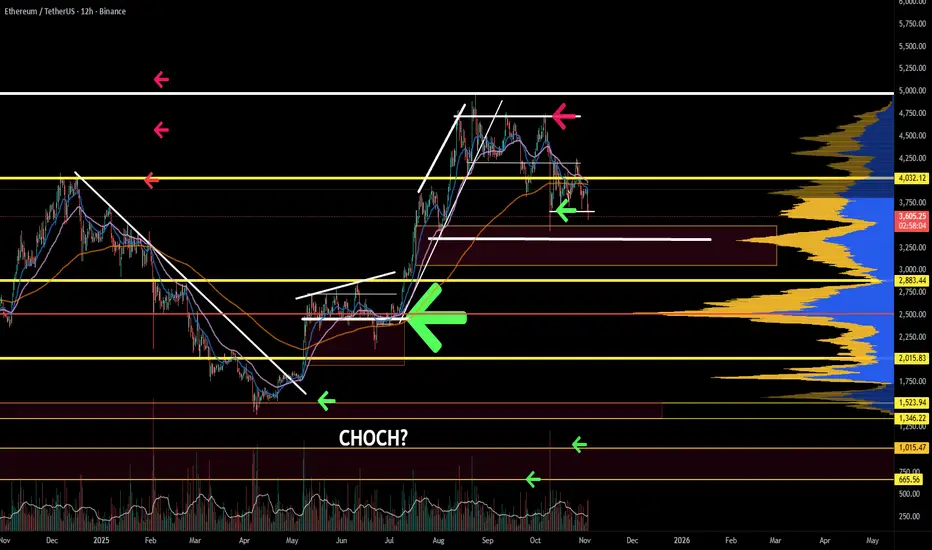
ETH is finally showing some sign of lifeETH after being bearish for so long is finally seen some inflow of money towards it, meaning ALT season is starting to show little glimpses here and there.
ETH Long term looks really good, if everything continues as smooth as it is currently then I will expect ETH to do great, the current targets I have going up 2.4k if the price hold those levels then 3.4k will be a walk to the park.
if it goes down to the 1900 even the 1700 area, I will just buy more.
Always put stop loses the current economy is showing no mercy, neither should we.

ETH Hit the First Target — The Downtrend Is Fully IntactETH has perfectly reached the first downside target we mapped earlier. Price broke the key support zone and today's candles confirm that the move was not a fakeout — this is real momentum, not noise.
Right now, ETH is only retesting broken structure and still trading below all major resistances. Nothing about this chart suggests strength.
🔻 Next Steps (as plotted on the chart):
A small bounce / retest is normal here, but as long as ETH stays below $3,700–$3,800, the trend remains bearish and continuation toward $2,900–$3,000 stays the primary target.
This is still not a place to consider longs — it's simply a corrective pullback inside a confirmed downtrend.
⚠️ Trend direction has not changed.
This move down is following the same plan we laid out from the top.
❗ Not financial advice — only my personal view.

ETH-----Sell around 3475, target 3408 areaETH Contract Technical Analysis (November 6th):
On the daily chart, yesterday's close was a small positive candle, with a pattern of consecutive negative candles followed by a single positive candle. The price is below the moving average, and the accompanying indicators are in a death cross, indicating a clear downtrend. Yesterday's rebound was a correction after a significant drop, with the price correcting back to the moving average and facing secondary downward pressure – a common and predictable pattern. On the hourly chart, the rebound after the decline lacks strength and continuity, making it unlikely to establish a short-term trend. Therefore, intraday trading is expected to be range-bound, with the European session likely to see further downward pressure.
Today's ETH Short-Term Contract Trading Strategy:
Sell at 3475, stop-loss at 3510, target 3408.

Ethereum (ETH/USDT) — Bears in Control | Next Target $3,200Ethereum remains under strong selling pressure.
After losing its ascending channel and failing to reclaim $4,000, momentum has clearly shifted in favor of the bears.
The market is now forming lower highs and showing no signs of strength recovery.
📉 Market Outlook
Price action remains heavy below $4,000–$4,200 resistance.
Current supports: $3,800, $3,400, and $3,200 — all potential short-term reaction zones, not reversal points.
Breaking below $3,800 would likely trigger continuation toward $3,200–$2,800.
Volume structure confirms distribution — no demand yet visible from buyers.
🚫 No Long Positions Recommended
The market is still in a corrective phase; long setups carry high risk.
Until ETH reclaims strong structure, short-term rallies are expected to be sold into.
⚖️ Summary
Bearish momentum dominates while below $4,000.
Patience and discipline are key — avoid counter-trend trades in this environment.
❗ Not financial advice — just my personal market view.
ETHUSDT.P - November 6, 2025ETHUSDT.P is attempting a short-term bullish reversal following a rebound from the $3,274.06–$3,244.47 support zone. A buy limit is positioned near $3,339.11, targeting a move toward the $3,493.78 partial profit zone and the $3,548.75 profit level.
A sustained break above $3,493.78 would confirm bullish continuation, while a drop below $3,274.06 invalidates the setup.
Risk Assessment: Moderate — price structure favors buyers, but confirmation above resistance is required before momentum can strengthen.

Eth bearish breakdownEthereum decisively broke through a major support line on high volume.
Unfortunately, it will be headed lower this year and next.
Target1: 2790 (highly likely)
Target2: 2160 (still possible)
Target3: 1430 (not likely)

ETH - LETS GOOOO BEARISH ..;;;... CRYPTOCAP:ETH - No Nudes, But This Chart’s Got Me Looking Twice 🍑
This is why you voted for me – now a winner of the #Binance #TheBlockchain100 event. 🔥
See you in Dubai this December! ✈️

ethusdtThe price is moving towards the opposite level of the daily trend after breaking the daily trend.

ETHA bad time to invest in Ethereum. The target at 2100 won’t be the final one. In the coming months, the only direction is down.

ethI have a strategy with 80% win rate.
The essence of it is that by the end of October, we will not see ETH above 4100.
On the other hand, we are still within the body of the 12-month candle from 2021. In 2024, we failed to hold above 3700, which indicates weakness and increases the likelihood of a move toward the 2021 low, around 700.
Right now, this sounds pessimistic and I don't like this scenario, but that’s how I see the chart.

Hey Bulls, are you mentally ready for this if it happens?What if, in the coming days or weeks, the price slowly bleeds down, takes out the equal lows around 3350, and reaches our VERY, VERY IMPORTANT aVWAP anchored from the start of the major trend — while everyone’s busy talking about how the price has been reclaiming the weekly level around 3900 after the latest nuke? I honestly think you should keep this scenario in the back of your mind.
ETHUSDT.P - November 4, 2025ETHUSDT.P is maintaining a clear bearish structure, with price accelerating lower toward the $3,400.00–$3,381.34 zone. The setup indicates a potential continuation of the downtrend toward this target area, unless invalidated by a recovery above the $3,681.23 resistance level. A decisive breakdown below $3,381.34 would open further downside extension, while a rebound from this zone could signal short-term relief before further weakness.
Risk Assessment: Moderate risk — momentum remains bearish, but proximity to a key support zone may trigger temporary corrective bounces before continuation.

Eth breakout & retest in progress Htf eth has been bullish once the retest is done.
It will break $5K.
It's a matter of time 😁

ETHUSDT.P - November 4, 2025ETHUSDT.P is currently attempting a short-term bullish reversal within a broader corrective structure. After forming a local low near the $3,460.00–$3,446.72 support zone, price has rebounded and is now targeting a potential buy setup around the $3,538.13 level. This suggests buyers are seeking confirmation for continuation toward the $3,625.51 partial profit area and ultimately the $3,647.77 profit target.
A break and sustained move above $3,625.51 would reinforce the bullish momentum, while failure to hold above the $3,538.13 entry zone could expose ETH to renewed downside pressure, revisiting the stop level.
Risk Assessment: Moderate risk — price is showing early signs of recovery, but confirmation is needed above near-term resistance. The trade setup offers a favorable risk-to-reward ratio if the $3,460.00 support holds, though volatility may persist before directional clarity emerges.

ETH Extends Red Scenario — Key Support at 3,435Last week, Ethereum also followed our red scenario and is currently continuing its decline. The price is now very close to the previous low, and there’s a high chance of breaking it at 3,435 , which could lead to a further drop toward 3,128 .
A return of bullish sentiment is only possible above 3,945 — until then, we remain in a downtrend.

ETH/USDT 1W Chart📊 Market Structure:
Main Trend: Still up (higher lows and highs pattern persists).
Current Phase: Correction in an uptrend.
Local Trend: Down for several weeks (series of red weekly candles).
⚙️ Key Support and Resistance Levels:
Resistance (green lines):
4,753 USDT – recent local high, very strong resistance.
4,373 USDT – previous consolidation level, currently a supply zone.
3,979 USDT – current key local resistance, which previously served as support.
Support (red lines):
3,600 USDT – currently tested support level (coincides with the uptrend line).
3,165 USDT – next strong support level (previous local lows).
2,740 USDT – strong long-term support, potential target for further correction.
📈 Trendline:
The black uptrend line connects successive higher lows since April 2024.
The current weekly candlestick is testing this line (confluence with support at 3,600 USDT).
Maintaining this line = still a bullish medium-term scenario.
A breakout and weekly close below ~3,580–3,600 USDT → a signal of a possible trend reversal.
📉 Volume:
Downward volume is increasing, indicating supply pressure.
A lack of strong demand candlesticks = buyers are cautious in this zone.
🔄 Stoch RSI Oscillator (bottom of the chart):
Located in the oversold zone (below 20).
The %K (blue) and %D (orange) lines are starting to converge → a possible rebound signal in the coming weeks if a crossover occurs upwards.
🧭 Scenarios:
🟢 Bullish
Holding support at 3,600 USDT + trendline.
Confirmation with a bullish candle with higher volume.
Target: Return to 3,980 → 4,370 USDT.
🔴 Bearish:
Closing the week below 3,580 USDT (trendline + support).
Potential decline to 3,165 USDT, and even 2,740 USDT beyond.
RSI and volume suggest that downward pressure remains significant.
📌 Summary:
Key level: 3,600 USDT → decisive point for the market's further direction.
Short-term: Still downward pressure, but a technical rebound is possible (Stoch RSI).
Medium-term: The uptrend has not reversed until ETH closes below the trend line and 3,550 USDT.

ETHEREUM getting a spanking but its not over yetETH is in a downtrend; however, the structure looks retracive, which means that a corrective move would be almost over. If it is not, this means the price will break structure and fall further down. If the objective is to hunt liquidity, expect further downside.
Ethereum Analysis – November 03, 2025Welcome to DIBA PRISM Daily Analysis 💫
Ethereum is currently in a bullish phase 📈 — compared to its previous market cycles and Bitcoin’s recent performance, ETH still shows room for further upside 🚀
Right now, Ethereum is in a corrective phase, and if it forms a higher low relative to the previous one, we can start looking for potential entry points 🎯
At the moment, price has reached a key zone, so it’s best to wait and observe Ethereum’s reaction before making any move 👀
Patience and timing will be the keys to catching the next big move ⚡
Disclaimer:
This content is for informational purposes only and does not constitute financial or investment advice. © DIBAPRISM
Larry D.Kohn

[SeoVereign] ETHEREUM BEARISH Outlook – November 03, 2025I would like to share my Ethereum idea as of November 3.
This idea is an extension of the one from October 27. The short positions entered on the 27th will be closed in profit in connection with this idea, and I plan to add some additional positions at the same time.
Basis — Harmonic 1.414 Butterfly Pattern
Currently, Ethereum is approaching the completion zone of the 1.414 Harmonic Butterfly pattern that I personally designed.
This zone is structurally an overextension area,
where a strong technical reversal possibility exists.
Accordingly, I set the average target price around 3,400 USDT.
Further position management and updates will be provided depending on market conditions.
Thank you for reading.

Ethereum Fails to Reclaim $3,900 — Bearish Target $3,300Ethereum continues to exhibit persistent weakness, with price failing to close convincingly above the $3,900 level. This rejection has reinforced the existing bearish market structure, leading to the establishment of yet another lower low, confirming the continuation of the corrective trend.
As long as price action remains suppressed beneath $3,900, the bearish bias stays intact. This sustained weakness opens the probability of a deeper corrective move toward the $3,300 region, which aligns with a key high-time-frame support zone and potential liquidity pocket.
Key Points:
Failed Reclaim: Inability to close above $3,900 confirms ongoing weakness.
Bearish Structure: Another lower low has formed, extending the downtrend.
Downside Target: Price likely to rotate toward $3,300 support.
From a technical standpoint, Ethereum remains under pressure with sellers maintaining control until a clear reclaim of resistance occurs.
What to Expect:
If $3,900 continues to hold as resistance, expect further downside toward $3,300. A strong daily close above $3,900, however, would invalidate the bearish scenario and hint at a short-term structural recovery.
