ETH analysis
Ethereum has begun a new downtrend within a channel, targeting the $2,900 level, where a bullish reversal is expected.
Trade ideas

eTH-USDTIt has reached the support I mentioned again at $3700 📉📉
If this support holds, the price could return to the two targets I set for you
Keep an eye on it

ETH-----Sell around 3890, target 3830 areaETH Contract Technical Analysis (November 3rd):
On the daily chart, yesterday's close was a small positive candle. While the candlestick pattern shows consecutive positive days, the momentum and continuation are weak, and the price is below the moving averages. The accompanying indicators are showing a death cross, indicating a clear downward trend. Therefore, the trading strategy remains sell. On the hourly chart, the resistance level is around 3920. The current price has rebounded to near the 4-hour moving average resistance level. Given the clear downward trend, further upward movement is unlikely. Therefore, the focus for today and the European session should be on a break below support levels.
Today's ETH Short-Term Contract Trading Strategy:
Sell at 3890, stop loss at 3930, target 3830.

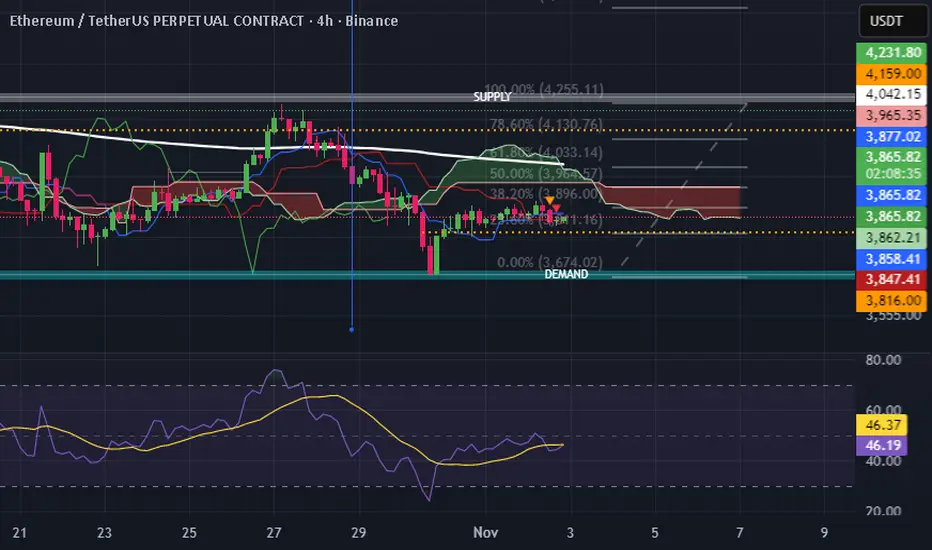
ETHUSD — Ichimoku & Fibonacci Time Analysis (4H)Ichimoku + RSI + Fibonacci used to identify key confluence.
Support zone: 3965–3896 (50–61.8% fib).
Bull confirmation above 4253. Next targets: 4409, 4491.
Strategy focus: time/price balance (Ichimoku-based).
ETH Weakening Near Support, Big Move Loading?CRYPTOCAP:ETH is currently trading near a key support zone, which has held strong multiple times in the past. The price has been consolidating between this support and the mid S/R zone, showing that both bulls and bears are battling for control.
If ETH manages to break and sustain above the mid S/R zone, we could see a potential upside continuation toward higher levels. However, if the price fails to hold this key support and closes below it, a deeper correction toward the lower support zone could be on the table.
For now, ETH looks weaker day by day, so it’s important to keep a close eye on how the price reacts around this zone, a decisive move could set the tone for the next big trend.
DYOR, NFA

ETHUSD — Ichimoku & Fibonacci Time Analysis (4H) and (1H)Ichimoku + RSI + Fibonacci used to identify key confluence.
Support zone: 3965–3896 (50–61.8% fib).
Bull confirmation above 4253. Next targets: 4409, 4491.
Strategy focus: time/price balance (Ichimoku-based).
bearish

ETHUSD — Ichimoku & Fibonacci Time Analysis (4H)Ichimoku + RSI + Fibonacci used to identify key confluence.
Support zone: 3965–3896 (50–61.8% fib).
Bull confirmation above 4253. Next targets: 4409, 4491.
Strategy focus: time/price balance (Ichimoku-based).

ETH/USDT Swing Trade | Heikin Ashi Confirmation + Pullback Plan🚀 ETH/USDT: The Great Crypto Heist — Swing/Day Trade Wealth Strategy! 🤑
Ladies and Gentlemen, welcome to the Thief’s Master Plan for ETH/USDT (Ethereum vs. Tether)! 🎩 This is a fun, professional, and calculated swing/day trade setup designed to catch the bullish wave while dodging the traps. Let’s break down this heist with style, precision, and a sprinkle of humor! 😎
📊 Asset: ETH/USDT (Ethereum vs. Tether)
Market: Crypto (High Volatility, High Reward!)
Strategy: Swing/Day Trade with a Thief’s Layered Entry approach
Vibe: Bullish, sneaky, and ready to outsmart the market! 🦹♂️
🧠 The Plan: Bullish Breakout with Technical Confirmation
✅ Bullish Confirmation: We’re riding the bullish wave with a Triangular Moving Average (TMA) pullback. This confirms the trend direction and filters out noise.
✅ Heikin Ashi Magic: A strong bullish Heikin Ashi candle signals momentum. Watch for smooth green candles to confirm the trend’s strength! 📈
🔑 Key Insight: The TMA pullback combined with Heikin Ashi gives us a high-probability setup for a breakout. Stay sharp, Thieves!
🚪 Entry: The Thief’s Layered Approach
🕵️♂️ Strategy: Use a layered entry (multiple buy limit orders) to scale into the trade like a true market bandit!
📍 Entry Levels:
Buy Limit @ $4250
Buy Limit @ $4300
Buy Limit @ $4350
Buy Limit @ $4400
💡 Pro Tip: Feel free to add more layers based on your risk appetite! Stack those orders like a master thief stacking loot. 💰
⚠️ Note: You can enter at any price level within this range if you spot momentum. The layered approach maximizes flexibility!
🛑 Stop Loss: The Thief’s Escape Route
🚨 Stop Loss: Set at $4150 to protect your loot.
⚠️ Thief’s Disclaimer: This is my suggested stop loss, but you’re the boss of your own heist! Adjust based on your risk tolerance. Don’t get caught by the market cops! 👮♂️
🎯 Target: Steal the Profits, Dodge the Trap!
🏦 Target Price: Aim for $4700 as our primary profit zone.
🚨 Resistance Alert: A police barricade (strong resistance) lurks around $4800. This level is overbought and a potential trap for greedy thieves. Cash out early to secure your gains!
💡 Pro Tip: Don’t get too greedy — take profits at your own discretion. The market is full of traps, so escape with your loot! 🏃♂️
👀 Related Pairs to Watch
Keep an eye on these correlated pairs to confirm market sentiment and strengthen your setup:
BTCUSDT ($): Bitcoin often leads the crypto market. If BTC is pumping, ETH is likely to follow. Watch for BTC breaking key resistance at $60,000 for added bullish confirmation.
ETHBTC: This pair shows ETH’s strength relative to BTC. A rising ETH/BTC ratio suggests ETH is outperforming, reinforcing our bullish bias.
SOLUSDT ($): Solana often moves in tandem with ETH. A breakout in SOL above $150 could signal broader altcoin strength.
Key Correlation: ETH’s price action is tightly linked to BTC and overall market sentiment. Monitor BTC’s trend and crypto market cap for context.
🔍 Key Points & Why This Setup Works
TMA Pullback: Acts as a dynamic support zone, ensuring we enter after a healthy retracement.
Heikin Ashi Confirmation: Filters out choppy price action, giving us clear bullish signals.
Layered Entries: Spreads risk and allows flexibility in volatile markets.
Risk Management: Tight stop loss at $4150 keeps the risk-reward ratio attractive.
Market Context: Crypto markets are volatile, but ETH’s bullish structure and correlation with BTC make this a high-probability trade.
📝 Thief’s Code: Risk Management
Dear Ladies and Gentlemen (Thief OGs), this is a fun strategy, but trading is serious business! 🕴️
Set your own stop loss and take profit based on your risk tolerance.
Never risk more than you can afford to lose — this is a heist, not a gamble!
Stay disciplined, and don’t let the market cops catch you off guard! 🚓
“If you find value in my analysis, a 👍 and 🚀 boost is much appreciated — it helps me share more setups with the community!”
Disclaimer: This is a Thief-Style trading strategy crafted for fun and educational purposes. Always do your own research and trade at your own risk. The market is a wild place — stay sharp, Thieves! 🦹♂️
#ETHUSDT #CryptoTrading #SwingTrading #DayTrading #ThiefStrategy #Bullish #TechnicalAnalysis #HeikinAshi #TradingView

ETHUSDT: Short-Term Pullback Toward Trendline Before PotentialHi guys!
On the current 1h chart, Ethereum shows a clear structure of recovery following a liquidity sweep marked as “Hunting happened.” This move indicates that liquidity below the previous lows has already been collected, creating a potential base for a short-term bullish correction.
Price is currently consolidating above a minor support zone (highlighted in pink), showing a possible accumulation phase. The projected path suggests a potential bullish move toward the major supply zone around $4,080–$4,180, which aligns with the descending trendline acting as dynamic resistance.
However, given the overall bearish market structure and the dominance of the descending trendline, the area around $4,100 could serve as a strong reaction zone. A rejection from this level would likely confirm continuation of the broader downtrend, with a possible retracement toward the $3,700–$3,750 area.

ETHUSDT-LONG IDEAThere are two scenarios for ETH
1. it will range in the same range and then go upside
2. it will break the range and will go lower, accumulate in the given range between lines and the resume the advancing phase
Now we will see which one will gonna play out

ETHUSDT-LONG IDEAETHUSDT is in the accumulation range. broken its trendline but again came back to test it support level well its my personal opinion this support should push price a little bit higher. if this accumulation range break we can expect the advancing phase for the longer run but right now this is the short term trade.

Ethereum Update (ETH)Ethereum (ETH/USDT) is forming a massive multi-year ascending triangle, indicating a long-term accumulation structure. The price is currently consolidating just below the major resistance zone around $4,500, which has historically been a key rejection level.
As long as ETH holds above the $2,800–$3,000 support zone, the bullish structure remains intact. A confirmed breakout above the red resistance area could trigger a strong continuation move, with potential mid- to long-term targets near $6,750, $14,000, and even $15,000 based on Fibonacci extensions and structural symmetry.
Ethereum continues to show relative strength and remains one of the key assets to watch in the coming market expansion. Any deeper retest toward the lower green support could serve as a strategic long-term entry zone before a possible parabolic phase.

Eth Weekly Key SupportEth weekly candles currently have support of the Gann 1x2 fib ray and 78.60% fib
If Monday's candle can open above these supports then we can expect a price rally eventually reaching the top of the chart at around $6k
Breaking of ascending support would see a drop looking for next support at $2.8k-$3k
Opening of the next weekly candle will show direction

ETH-USDTStill stuck around the $3900 level.
For an upward move, this number needs to be broken 🕯
Short-term support for Ethereum is at $3800 and $3700 🔼💰
The condition for a rise toward $4050 and then $4200 is breaking the static resistance at $3900.

ETHUSDT.P: 4H Chart BriefETHUSDT.P trading near 3,885 level. Monitoring for potential breakout or retracement on the 4H chart. Will respond to next move.
Disclaimer: Not financial advice.

ETHUSDT.P - November 1, 2025ETHUSDT.P is forming a corrective pullback within an intraday bullish structure, maintaining higher lows from the recent swing base. A buy limit order is positioned near $3,850, anticipating continuation toward the $3,891 resistance target. The stop-loss is set around $3,828 to manage downside risk. A rebound from the order zone would confirm bullish momentum resumption, while sustained price action below $3,828 would invalidate the setup.

EthusdBased on the formation of deceptive double-top patterns in an uptrend and the accumulation of liquidity above the static resistance line, I expect the market to drop to the previous low.

Can Ethereum’s Capital Flow Blueprint Target 4600 Next?🎯 ETH/USD "The Liquidity Thief" Strategy 💰
Weighted MA Pullback + Manipulation Grab Blueprint
📊 TRADE SETUP OVERVIEW
Asset: ETH/USD (Ethereum vs USD) | Timeframe: Swing Trade
Market Structure: Bullish Confirmation with WMA Pullback Recovery
Strategy Type: Multi-Layer Accumulation (Thief-Style Entry Method)
🎪 THE GAMEPLAN
Bias: 🟢 BULLISH — Confirmed via:
Weighted Moving Average (WMA) acting as dynamic support
Liquidity pool identification on pullback zones
Institutional accumulation patterns detected
This setup thrives on pullback retracements where smart money accumulates before the next leg up. We're essentially "stealing" liquidity at discount prices during these inefficiency windows.
🚀 MULTI-LAYER ENTRY STRATEGY (The Thief Approach)
Instead of FOMO market orders, we deploy calculated limit order layers at strategic support zones:
Entry Levels (Layer-by-Layer Accumulation):
Layer 1: $3,700 USD
Layer 2: $3,800 USD
Layer 3: $3,900 USD
(Pro Tip: Scale these layers based on your risk tolerance and account size. Tighter layers = more fills; wider layers = better average price)
Position Building: Fill partial positions at each layer, building your total exposure gradually. This reduces average entry cost and maximizes probability of initial profit.
🛑 STOP LOSS (Risk Management)
Hard Stop: $3,500 USD
⚠️ Important Disclaimer: This is YOUR trading decision. No strategy guarantees profits. Position sizing and risk management are YOUR responsibility. Never risk capital you can't afford to lose.
🎯 TARGET & EXIT STRATEGY
Primary Target: $4,600 USD
Exit Rationale:
Strong resistance zone confluence
RSI/Stochastic overbought divergence
Liquidity trap zone (potential reversal catalyst)
💡 Golden Rule: Lock in profits at $4,600 or take partial profits at resistance. Never hold through key resistance on swing trades—greed kills thief traders.
⚠️ Disclosure: Risk management and profit targets are trader-dependent. Adjust based on your strategy framework, market conditions, and account allocation.
📈 CORRELATED PAIRS TO WATCH
Monitor these assets for confluence signals and capital flow indicators:
BITSTAMP:BTCUSD (✅ High Positive Correlation) — Bitcoin sets market sentiment; ETH typically follows in lockstep. When BTC rallies, altcoins like ETH amplify the move upward.
BINANCE:ETHBTC (⚖️ Relative Strength) — ETH strength against BTC equals altseason confirmation. Rising ETHBTC ratio means Ethereum is outperforming Bitcoin—bullish for our setup.
$SPY/ IG:NASDAQ (📊 Risk Appetite) — Traditional equity weakness creates crypto pullback risk. If stocks dump, crypto usually follows. Monitor US market opens for confirmation signals.
TVC:DXY (Dollar Index) (⚖️ Inverse Correlation) — Strong dollar = crypto headwind; weak dollar = tailwind for ETH. A declining DXY supports crypto rally scenarios.
COINBASE:USDTUSD (🔒 Stablecoin Flow) — USDT accumulation signals capital waiting for entry. Rising USDT on exchanges = dry powder ready to deploy into altcoins like ETH.
Capital Flow Blueprint: When BTC holds above support AND USDT shows inflow, altcoins like ETH enter "hunter mode."
🔑 KEY TRADING PRINCIPLES (Thief OG Edition)
✨ Patience — Wait for pullback confirmation before layering in
✨ Position Sizing — Risk only 1-2% per trade; 3% absolute maximum
✨ Confluence — Entry + Support + Volume + Correlation = Green Light
✨ Discipline — Exit at target or stop loss; no emotional HODL mode
✨ Adaptation — Markets evolve; update bias if structure breaks
If you find value in my analysis, a 👍 and 🚀 boost is much appreciated — it helps me share more setups with the community!
#ETH #ETHUSD #Ethereum #CryptoTrading #TechnicalAnalysis #SwingTrading #CryptoDCA #TradingStrategy #LayerEntry #LiquidityZones #AltSeason #CryptoAnalysis #TradeSetup #RiskManagement #Thief #CommunityDriven

Will Ethereum’s tight range lead to a breakout? | Day 34☃️ Welcome to the cryptos winter , I hope you’ve started your day well.
⏰ We’re analyzing BTC on the 1-Day timeframe .
👀 Ethereum on the daily timeframe. Ethereum is currently inside a box-like structure in a trading range format. The top of this trading range is in the $4,161 area, and the bottom of this trading range is in the $3,801 price area, where by breaking these zones, Ethereum can start a stronger and more impulsive leg of movement.
🧮RSI oscillator, which has now formed two important oscillation zones for us — one around 54, which overlaps with our long trigger, and the other around 40, which overlaps with our short trigger. The fluctuation limit crossing these zones can give more momentum to Ethereum’s next move on the daily timeframe.
🕯 Ethereum’s volume, after the flash crash the market experienced, has increased sharply, but the tendency has been pushed toward selling pressure, which has caused Ethereum’s corrections to always come with selling pressure.
📈 For Ethereum positioning, the specified zones have high price action validity, where you can set alerts so that if the price reaches these zones, you can open a position. Or, in the multi-timeframe, you can find the identified support and resistance zones and open positions with lower risk around these areas, moving toward anticipating higher or lower levels, so that in each level, you can add some risk to your position.
❤️ Disclaimer : This analysis is purely based on my personal opinion and I only trade if the stated triggers are activated .

Ethereum Analysis (2H)In the lower timeframes, after the major dump forming wave A, it seems that wave B has developed as a diametric pattern, with one remaining leg wave g. Wave g is bullish and could target the levels marked on the chart:
targets : 3920$ - 4038$ _ 4142$
The green zone represents the entry area, which is likely to be retested.
For risk management, please don't forget stop loss and capital management
When we reach the first target, save some profit and then change the stop to entry
Comment if you have any questions
Thank You

Historical Perspective: Previous Commodity Supercycles and Their1. Understanding the Concept of Commodity Supercycles
Before diving into history, it’s important to define what a commodity supercycle is. Unlike short-term price spikes caused by supply disruptions or speculative behavior, supercycles are long-duration upward trends in commodity prices — typically lasting 20 to 30 years — driven by massive structural demand changes.
These cycles reflect the interplay between:
Industrial demand (from large-scale urbanization and industrial growth)
Supply constraints (due to underinvestment in production)
Global economic transitions (such as post-war reconstruction or technological revolutions)
During the upward phase, rapid industrialization boosts demand for raw materials like oil, copper, steel, and agricultural goods. As prices rise, producers expand capacity — often overshooting — which eventually leads to a long-term correction and a downcycle.
2. The 19th Century: The First Modern Commodity Supercycle (1815–1873)
The earliest known commodity supercycle occurred during the Industrial Revolution of the 19th century. Following the Napoleonic Wars (1803–1815), Europe entered a period of peace and rapid industrial expansion, setting the stage for the first global surge in commodity demand.
Key Triggers:
Industrialization in Britain and Western Europe:
Britain’s industrial revolution accelerated demand for coal, iron, and steel. The invention of the steam engine and expansion of railways required massive quantities of these resources.
Urbanization and Infrastructure Development:
Rapid urban growth and the construction of factories, bridges, and transportation networks fueled consumption of metals, timber, and coal.
Global Trade Expansion:
The 19th century saw an unprecedented globalization of trade, driven by colonial expansion and improvements in shipping technology. This increased both the supply and the reach of commodities.
Outcome:
From the 1820s to the 1860s, prices for key commodities such as iron, copper, and coal rose sharply. However, the cycle ended around 1873, coinciding with the Long Depression, as supply caught up with demand and economic growth slowed. Nonetheless, this period laid the foundation for modern industrial economies and global commodity markets.
3. The Early 20th Century Supercycle (1899–1939)
The next significant supercycle unfolded between 1899 and 1939, overlapping with major historical events — including World War I, the Great Depression, and the early stages of the Second Industrial Revolution.
Key Triggers:
Technological Innovations and the Second Industrial Revolution:
Advances in electricity, the internal combustion engine, and chemical manufacturing spurred enormous demand for copper (for wiring), oil (for engines), and steel (for infrastructure and weapons).
Global Urbanization and the Automobile Era:
The rise of automobiles created a new and massive demand for oil and rubber. Countries like the U.S. became both producers and consumers of these resources at unprecedented scales.
World War I (1914–1918):
The war generated extreme demand for metals, food, and energy. Governments mobilized vast industrial capacity to supply military needs, creating temporary price booms.
Post-War Reconstruction:
After the war, Europe required significant rebuilding, further pushing up commodity prices in the early 1920s.
Outcome:
The 1920s witnessed strong commodity prices, but the Great Depression (1929–1939) brought the supercycle to a crashing halt. Overproduction, financial instability, and protectionist policies caused global trade to collapse, sending prices plummeting. This cycle demonstrated how financial crises and overcapacity could abruptly end periods of prosperity.
4. The Post-World War II Supercycle (1946–1973)
After the devastation of World War II, the world embarked on a massive phase of reconstruction and modernization, which fueled one of the most well-documented commodity supercycles.
Key Triggers:
Post-War Reconstruction (Marshall Plan):
Europe and Japan undertook extensive rebuilding efforts financed by the United States through the Marshall Plan (1948–1952). This drove global demand for steel, cement, copper, and machinery.
The Rise of Consumer Economies:
The mid-20th century saw the emergence of middle-class consumption in Western economies. Automobiles, housing, and appliances required vast amounts of raw materials and energy.
Decolonization and Global Integration:
Newly independent nations began industrializing, expanding agricultural and mining activities, and increasing trade participation.
Oil Demand and Energy Expansion:
The oil industry experienced explosive growth during this period. Petroleum became the lifeblood of modern economies, fueling transport, industry, and electricity generation.
Outcome:
This supercycle peaked in the early 1970s, when strong global growth and tight oil supply culminated in the 1973 Oil Crisis. The OPEC oil embargo sent prices skyrocketing, marking both the climax and the collapse of the post-war boom. The subsequent stagflation of the late 1970s and early 1980s signaled the end of this cycle. Yet, it transformed the global energy landscape and established oil as the most strategically vital commodity.
5. The 2000s Supercycle: The China-Led Boom (2000–2014)
The most recent and perhaps most influential supercycle in modern memory began around 2000 and lasted until roughly 2014. It was primarily driven by the rapid industrialization and urbanization of China, along with strong growth across emerging markets.
Key Triggers:
China’s Industrial Expansion:
China’s entry into the World Trade Organization (WTO) in 2001 catalyzed a historic wave of manufacturing and infrastructure investment. The country became the world’s largest consumer of steel, copper, coal, and cement.
Urbanization Across Emerging Economies:
Beyond China, countries like India, Brazil, and Indonesia experienced rising urbanization, boosting demand for construction materials and energy.
Financialization of Commodities:
The early 2000s saw increased investor participation in commodity markets through ETFs and futures. Commodities became a mainstream asset class, amplifying price movements.
Energy Demand and the Rise of Oil Prices:
Oil prices surged from around $20 per barrel in 2000 to over $140 per barrel in 2008, driven by strong global demand and geopolitical tensions in the Middle East.
Underinvestment in Supply:
The previous two decades of low commodity prices had discouraged exploration and investment. When demand spiked, supply was unable to keep pace, intensifying the price surge.
Outcome:
The 2008 Global Financial Crisis temporarily interrupted the supercycle, but prices rebounded quickly due to China’s massive stimulus package and infrastructure spending. However, by 2014, oversupply — especially in oil and metals — combined with slowing Chinese growth, ended the cycle. This period reshaped the global commodity market, making China the central player in global demand dynamics.
6. Common Triggers and Patterns Across Supercycles
While each supercycle is unique, historical analysis reveals recurring themes and triggers:
Industrialization and Urbanization:
Every major supercycle coincided with rapid industrial expansion — whether in 19th-century Europe, post-war America, or 21st-century China.
Technological Transformation:
Breakthroughs like steam power, electricity, and automobiles dramatically shifted commodity usage and demand profiles.
Demographic and Economic Expansion:
Population growth and income rises fuel demand for housing, transport, and consumer goods — all resource-intensive sectors.
Supply Lag and Investment Cycles:
Commodity supply responds slowly due to long project lead times in mining, energy, and agriculture. This delay amplifies the effects of demand surges.
Geopolitical and Military Events:
Wars, embargoes, and trade disruptions often accelerate price booms by constraining supply and increasing uncertainty.
Financialization and Speculation:
In modern times, increased participation by institutional investors has made commodity markets more sensitive to financial sentiment.
7. Lessons from Historical Supercycles
A. The Role of Structural Demand Shifts
Sustained demand growth — not temporary shocks — is essential for a true supercycle. Industrial revolutions and global reconstruction phases have consistently been the key demand drivers.
B. The Danger of Overinvestment
Each boom phase has historically been followed by a glut as producers overexpand capacity. This overinvestment eventually depresses prices and leads to prolonged downturns.
C. The Importance of Policy and Global Coordination
Government policy, trade agreements, and geopolitical stability can either extend or shorten a supercycle. For example, the Bretton Woods system and post-war cooperation helped sustain the 1950s–1970s boom.
D. The Cyclical Nature of Commodities
Despite new technologies and financial instruments, the commodity market remains inherently cyclical. Prices eventually revert as supply catches up and demand matures.
8. Could We Be Entering a New Supercycle?
Many analysts argue that the 2020s could mark the beginning of a new commodity supercycle, driven by factors reminiscent of past booms but adapted to modern realities:
Green Energy Transition: Demand for lithium, copper, nickel, and rare earth elements is soaring due to renewable energy technologies and electric vehicles.
Infrastructure Stimulus: Governments worldwide are investing heavily in post-pandemic recovery and infrastructure modernization.
Supply Constraints: Years of underinvestment in mining and oil exploration could limit supply just as demand accelerates.
Geopolitical Realignments: Conflicts, trade tensions, and resource nationalism are reshaping supply chains and commodity flows.
If history is a guide, the combination of these structural forces suggests that another long-term uptrend in commodities may be emerging — though, as always, the balance between supply and demand will ultimately determine its longevity.
Conclusion
The history of commodity supercycles is, in essence, the story of human progress — from steam engines to skyscrapers, from oil booms to electric revolutions. Each supercycle reflects a period when global society undergoes transformative change, demanding vast quantities of raw materials to fuel development.
From the 19th-century Industrial Revolution to the China-led boom of the early 21st century, the triggers have remained consistent: industrial growth, technological innovation, and demographic expansion. Yet, each cycle has also taught hard lessons about overproduction, economic imbalance, and the limits of natural resources.
As the world moves toward a low-carbon, technology-driven future, the next supercycle may look very different — centered around green commodities and sustainable growth — but it will still be governed by the same fundamental forces that have shaped markets for over two centuries.
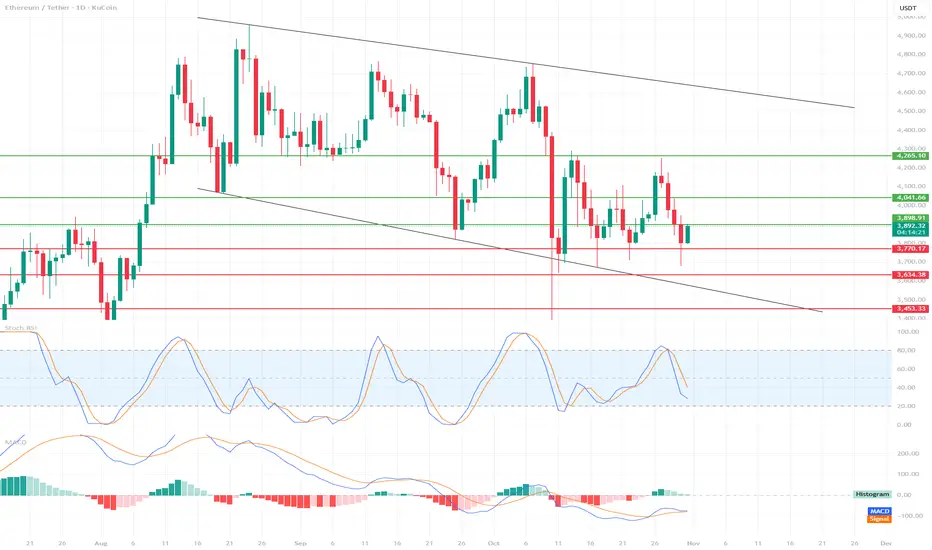
ETH Tests Support – Is This the Beginning of a Rebound?📉 Market Structure
We see a descending channel, bounded by two black trend lines.
Upper Boundary: ~$4,700
Lower Boundary: currently around $3,700, representing strong dynamic support.
The price is currently hovering slightly above the lower edge of the channel, suggesting a possible rebound, but the market remains in a medium-term downtrend.
🔍 Support and Resistance Levels
Support:
$3,770 → currently being tested, crucial in the short term.
$3,643 → next strong support from previous lows.
$3,453 → last line of defense against a steeper decline.
Resistance:
$3,889 → closest resistance, current local ceiling.
$4,041 → strong resistance resulting from prior consolidation.
USD 4.265 → a line that, if broken, could signal a change in the medium-term trend.
📊 Technical Indicators
Stochastic RSI
Located near the oversold zone (below 20), with a slight upward curve.
🔹 Signal: Potential upside move (bounce) in the short term if the %K and %D lines cross upward.
MACD
The MACD line is slightly below zero, but is starting to curve upward and may soon cross the signal line.
🔹 The histogram is starting to decline on the negative side – this is often an early bullish signal (possible change in momentum).
⚖️ Scenarios
🔹 Bullish
If ETH holds above USD 3,770 and the Stoch RSI confirms the rebound, a possible move towards:
3,889 → USD 4,041 → USD 4,265.
A break above USD 4,265 could open the way to USD 4,500+ (upper band of the channel).
🔻 Bearish
Loss of support at USD 3,770 → a signal of weakness.
Then the next downside targets:
USD 3,643, then USD 3,453.
If USD 3,453 breaks, possible tests of the lower band of the channel – even around USD 3,300.
🧭 Summary
Main trend: downward (descending channel).
Short-term bias: neutral-bullish (potential for a rebound from support).
Key level to watch: USD 3,770 – maintaining this level could trigger a rebound, loss = risk of a steeper decline.
ETH-Daily : Bears in Control - Bulls Waiting for Right momentConsidering the liquidity that price may still sweep, Ethereum’s daily structure remains bearish for now, with a possible drop toward 3000 and a potential rebound from the 2700–2900 area.
