Target updated on ETHBig order block there. If it breaks, maybe we'll have a bigger push talking macro. These are my thoughts, based on my knowledge on technical analysis, this is not financial advice.
They deleted some of the last publications because my settings language was Spanish.
ETHWAVAX_1ACF15.USD trade ideas
Is Crypto About To Explode: New Highs? The total crypto market cap is retesting $4 trillion.
We are now looking much more bullish on a technical basis across Ethereum & Bitcoin.
We may have had a failed breakdown in the Total Crypto market cap, which could provide the additional liquidity for another surge.
Recapturing Key Daily 7 & 20 MA's is a very positive sign.
Although still being net short BTC & ETH - I now have breakeven stop losses in place.
Ethereum chart is looking very explosive like it could have a move to $5500
ETH recently has defended a massive volume shelf which is a very bullish sign.
Keep on your radar: BMNR / SBET / MSTR / COIN / MARA

Lets lock in, this BearMarket(ETH)Here we have a classic wyckoff distribution on Ethereum. I'm predicting that we see at least $2600 ETH by October maybe the 15th. Great scalping opportunities will be had in these next four years.
I'm thinking this may be the longest bear market crypto has seen in quite some time.
This is where greatness is born only in a bear market true traders and believers survive.

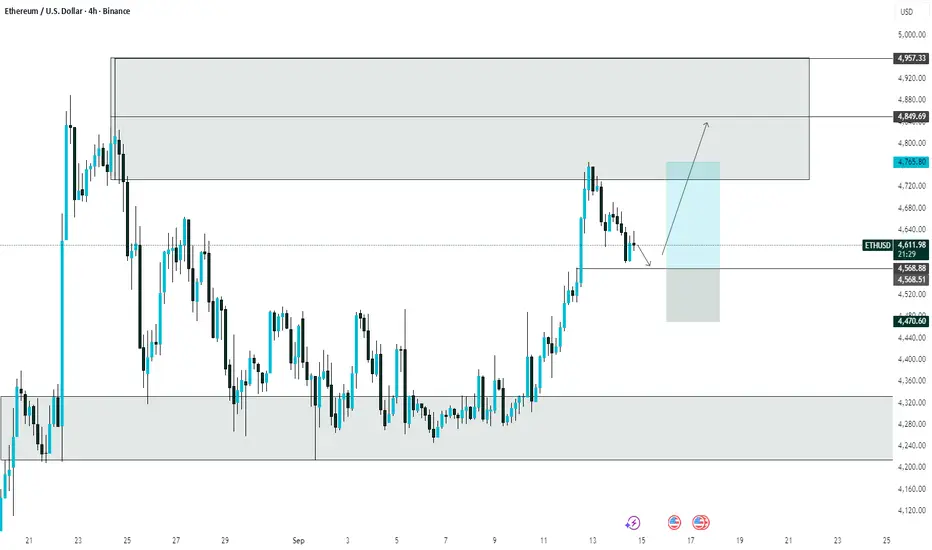
ETHUSD: Will Go Down! Short!
My dear friends,
Today we will analyse ETHUSD together☺️
The recent price action suggests a shift in mid-term momentum. A break below the current local range around 4,609.6 will confirm the new direction downwards with the target being the next key level of 4,590.9 and a reconvened placement of a stop-loss beyond the range.
❤️Sending you lots of Love and Hugs❤️

Ethereum Macro View: Final Push Before the Storm?Ethereum is once again approaching a historical resistance zone around $4,700–$4,800 — the same area that marked major reversals in previous cycles.
🔍 What the chart shows:
ETH is trading within a massive macro range between $1,000 and $4,800
After a strong rally from the $1K zone, we're now retesting the upper boundary
The structure suggests a potential double top or a fake breakout trap
📈 Yes, we could still see a final push towards $6,000–$7,000 — driven by hype, ETF narratives, and euphoria.
But that’s exactly why this zone deserves caution.
🎯 I’m not saying “sell everything,” but:
👉 Consider partial profit-taking in this range
👉 Smart money protects capital before the reversal
👉 History has shown: markets don’t go up forever
⚠️ Key levels to watch:
Resistance: $4,700–$6,800
Downside targets: $2,400 / $1,600 / $1,100
Don’t try to catch the exact top — plan your exit ahead of the crowd.
Discipline > Emotion.

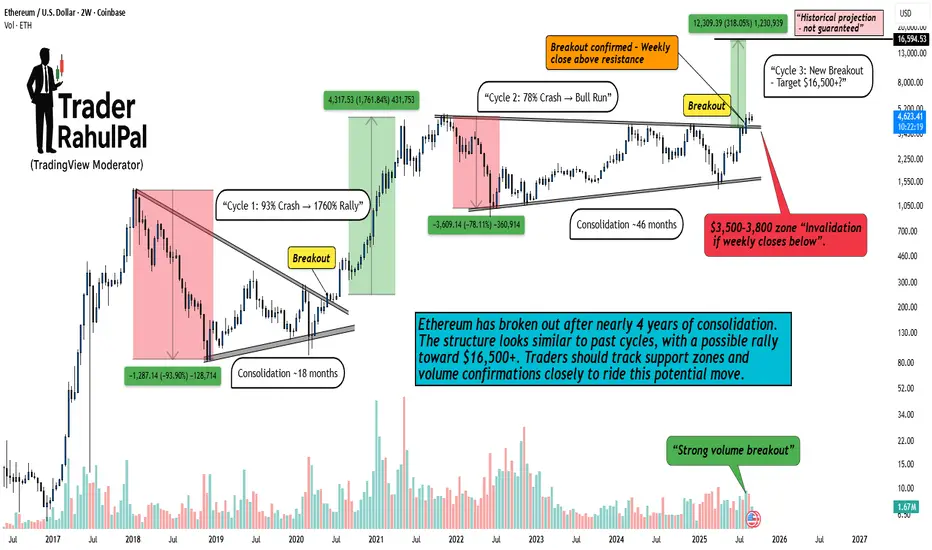
Ethereum Breakout – From Crash to Bull Run, History Repeats?Hello Traders!
Ethereum has once again confirmed a major breakout after years of consolidation. If we study its past cycles, we can see a repeated pattern: deep crashes, long consolidation, and then explosive rallies. The current setup looks no different.
Cycle 1: 2017–2020
ETH crashed nearly 93% , shaking out weak hands.
After 18 months of consolidation , it broke out strongly.
Result → A massive 1760% bull run .
Cycle 2: 2021–2023
ETH faced another 78% crash during the bear market.
This time, consolidation lasted around 46 months .
Breakout again led to a solid bull phase.
Cycle 3: 2025 (Current)
ETH has confirmed a weekly close above resistance – signaling breakout.
Strong volume support adds conviction.
Projection suggests a move toward $16,500+ , about 318% potential upside .
But remember: invalidation if ETH closes below $3,500–3,800 .
Why This Matters
Ethereum doesn’t just move randomly – it moves in cycles . Each cycle has followed the same sequence:
Crash → Consolidation → Breakout → Bull Run
If history repeats, we may be witnessing the early stages of another explosive cycle.
Rahul’s Tip
Always respect both sides of the market. Big targets look exciting, but risk management is everything. Mark your invalidation levels, and never forget: every bull run starts with patience during consolidation .
Disclaimer: This analysis is for educational purposes only and should not be taken as financial advice. Please do your own research or consult your financial advisor before investing.
Analysis By @TraderRahulPal (TradingView Moderator) | More analysis & educational content on my profile
👉 If you found this helpful, don’t forget to like and follow for regular updates.
ETHUSDTETH in support. So best for entry but control risk management because not confirmation of candle for buy.

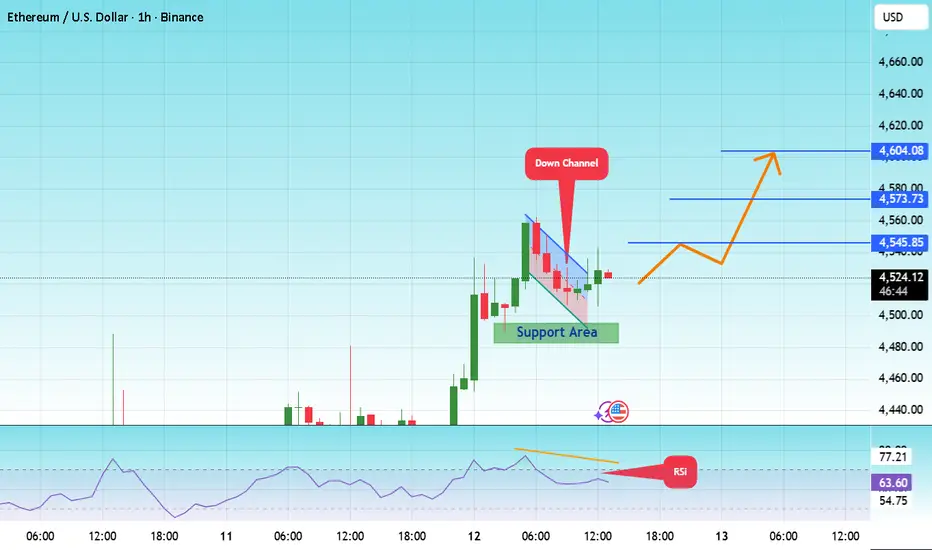
#ETH/USDT –> Falling Wedge Breakout Within Ascending Channel#ETH
The price is moving within a descending channel on the 1-hour frame and is expected to break and continue upward.
We have a trend to stabilize above the 100 moving average once again.
We have a downtrend on the RSI indicator that supports the upward move with a breakout.
We have a support area at the lower boundary of the channel at 4500, acting as strong support from which the price can rebound.
We have a major support area in green that pushed the price upward at 4485.
Entry price: 4525
First target: 4545
Second target: 4573
Third target: 4604
To manage risk, don't forget stop loss and capital management.
When you reach the first target, save some profits and then change your stop order to an entry order.
For inquiries, please comment.
Thank you.
"Ethereum/Dollar – Breakout Confirmed, Eyes on $4,830 Target"The ETHUSD 4H chart illustrates a **strong bullish breakout** from a prolonged **consolidation area** that followed a downward trend. The price action confirms a **break of structure** with a clear move above the **descending trendline** and the formation of a **"break order"**, signaling bullish momentum.
After accumulating in a tight range, Ethereum surged upward, breaking through multiple resistance levels and validating **key targets**. The chart defines upside
**target zone** based on price action and historical resistance:
* Target / Sellers Ground: $4,827.83 – $4,830.26
This final target area is marked as “Sellers Ground”, where potential profit-taking or short interest may increase, making it a key zone to watch for reversal or consolidation.
The chart also outlines the **“Immediate Zone”** around $4,215.18 and a strong **Buyers Area** near $4,062.24, which served as the base for the recent bullish move. The price is currently approaching overbought territory, so caution near the final target is advised.
Trade strategically and Find Setup with patience.

ETH to 3,054$ in NO TIME!You can expect what's written on the title. Check my profile out, you'll be astonished how accurate this page is. Lastly, this pump was also predicted in our last post.

ETH Will HIT ATH very soon !!!! ETH is the future that will accompany BITCOIN besides Solana, because ETH has the strongest ecosystem and has been strongly supported by institutions this time. what's more after Tom Lee with his BMNR continues to add support for ETH price, my target may be too low this time. but I believe ETH price is at least 1/2 of bitcoin market cap.


Why ETH Rejected $4,955 & May make a new High at $5,500This is just for educational purposes and not a signal.
This Trend-based extension analysis is just to demonstrate why price rejected at $4,955.
You can also see how many time price resisted the 0.382 and the trend line within the Fib tool before the final breakout post-ATH.
You can also see the reaction at 0.618 with the previous day's very aggressive Bullish candle.
This explains how important 0.382, 0.618 & 0.5 fib levels are.
I hope this analysis helps

ETHUSD / – Bullish Breakout from Consolidation Zone!Ethereum (ETHUSD) has broken out of a well-defined consolidation area , as seen on the 4-hour chart. After a prolonged period of sideways movement between approximately $4,214.58 and $4,460, price action has decisively moved upward, signaling increased bullish momentum.
Key Zones:
*Buyers Area: Around $4,062.24 – previously respected as a support zone.
*Immediate Zone: Near $4,214.58 – acted as a base before the breakout.*Sellers Ground:** From $4,828.89 up to the recent high of $4,955.90– potential resistance area based on prior price rejection.
Targets Ahead:
The breakout has created a bullish structure with potential short-term targets at:
Target 1: $4,599.86
Target 2: $4,659.79
Target 3: $4,728.29
These levels are marked based on historical price action and Fibonacci alignments.
Technical Notes:
Break Order: A breakout move above the consolidation zone, supported by higher lows and stronger bullish candles.
Trendline Support: A rising trendline is supporting the current bullish structure.
Market sentiment appears to have shifted favorably following the breakout.
This chart is for educational and illustrative purposes only. It does not constitute financial advice or a recommendation to trade.

Ethereum Liquidity Sweep Setup for Bullish Continuation📊 Market Analysis Report – ETHUSD
The market has been consolidating within a range after a strong impulsive move down, followed by a period of liquidity sweeps and corrective structure. Price action shows signs of engineered liquidity grabs both above and below recent highs and lows, which indicates smart money activity.
Currently, ETH is transitioning from a compression phase into expansion. The accumulation zone formed in recent sessions suggests a build-up for a larger move. The market appears to be setting up a liquidity sweep to the downside before a potential continuation upward, aligning with the projected path on the chart.
From a structural perspective, the overall cycle points towards bullish continuation after this corrective phase. The projected liquidity sweep is designed to trap early sellers before price accelerates towards higher objectives.

ETH new ATH incoming?Hey, sorry for not cleaning up my chart here but those are lines for a smaller timeframe and I zoomed out to 2months. ETH is clearly going to make a new all time high here. Get ready. Look at BTC.D, and the fact that ETH has tried to break this resistance multiple times.

ETH: Coiling at 4.45K – waiting for the breakoutHello everyone, let’s take a quick look at ETH.
On the H4 chart, price has broken out from the 4.30K–4.40K zone and is now pressing against 4.44K–4.50K. ETH is riding along the Ichimoku cloud, the Kijun line is starting to slope upwards, and there’s an FVG support band at 4.33K–4.38K – meaning buyers are still holding firm. Short-bodied candles right under resistance suggest compression, and a single H4 close above 4.46K–4.50K could quickly propel price towards 4.58K–4.62K, or even 4.70K–4.75K.
On the macro side, the backdrop is supportive: softer US CPI/PPI has pulled yields and the USD lower – a tailwind for crypto. When risk appetite rises, breakouts like this around 4.45K often travel further.
My bias is for a shallow pullback followed by continuation upwards, as long as ETH holds above 4.33K. Only an H4 close below 4.28K would be more concerning.
What about you – do you think ETH has the strength to break above 4.45K? Share your thoughts!

ETH/USD Trading IdeaThe 1W timeframe looks way too familiar, almost like the last big Bitcoin rally.

ETH ready for bullish momentum.ETH accumulated enough short liquidation for bullish momentum. With the expectation of rate cuts in september we will see a bullish momentum towards these levels #ETH

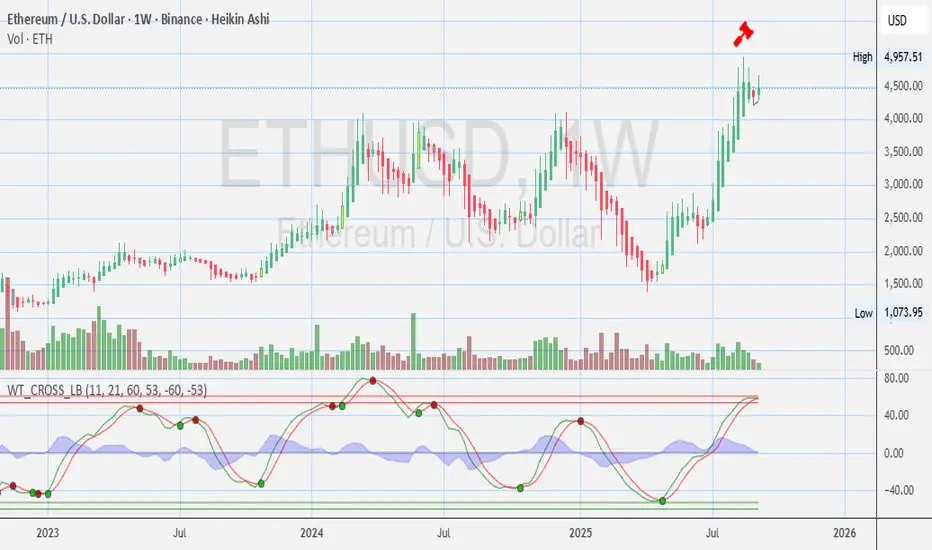
ETH Weekly Chart Update Here’s a breakdown of Ethereum / USD (ETH/USDT, Weekly – Binance, Heikin Ashi) chart:
Trend & Structure
Macro Trend: ETH has been in a strong bullish uptrend since late 2022, recovering from the $800–$1,000 range and pushing toward $4,600+.
Key Resistance: Around $4,950–$5,000 (previous ATH zone from 2021). This level is acting as a major test — a breakout here could confirm continuation to new highs.
Support Levels:
Short-term: $4,200–$4,300 (recent consolidation zone).
Deeper pullback support: $3,500–$3,600 (prior breakout area).
Momentum Indicators (WT Cross / Stoch)
Oscillator is in overbought territory (above 50–60 range) but still pushing upward — this indicates strong bullish momentum but also risk of short-term correction if buyers slow down.
The green signals show momentum continuation, but caution is warranted as we’re near resistance.
Volume
Weekly volume is steady but not at peak levels, suggesting the move may need more accumulation to convincingly break $5,000.
✅ Bullish Case: If ETH breaks and closes above $5,000 on the weekly, it opens the door for price discovery, with next psychological targets around $6,500–$7,000.
⚠️ Bearish Case: Failure to break $5,000 could trigger a retracement back to $4,200 or even $3,600 before another attempt.
--
Disclosures:
This analysis is for informational purposes only and is not financial advice. It does not constitute a recommendation to buy, sell, or trade any securities, cryptocurrencies, or stocks. Trading involves significant risk, and you should consult with a qualified financial advisor before making any investment decisions. Past performance is not indicative of future results.

Ethusd/LongHello traders. My guess is buy according to the pattern. The static level is strong but it breaks with hesitation. Good luck.

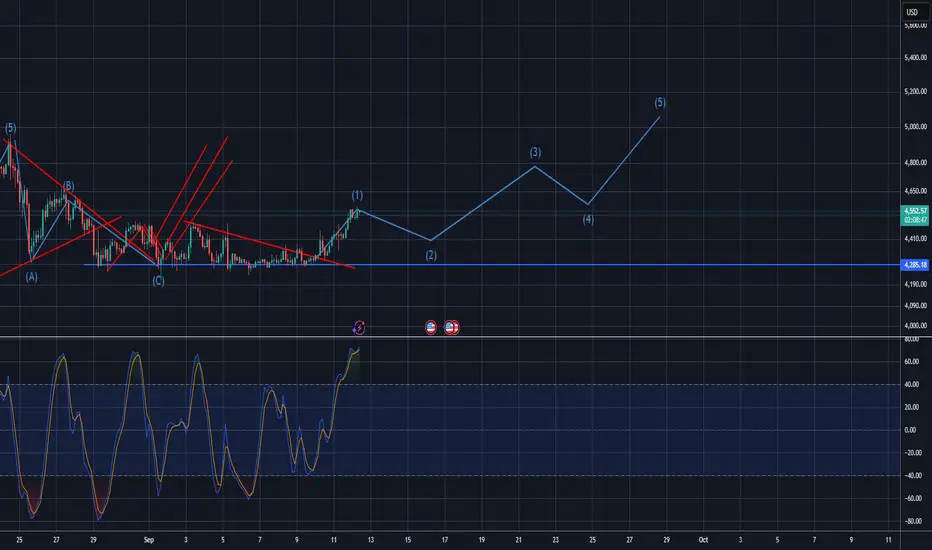
no up trend yet, bad wave count5 wave not possible due to wave 4 has entered into wave 1 territory. I think this is a trap.