ETHEREUM HIGH PROBABILITY SETUP SOON!!!🚨 ETHER HIGH PROBABILITY BUY SETUP 🚨
* Here We Can See Clearly The Next Potential Moves For ETHUSD Coming Hours/Days.
* Keep Your Eyes Close On Your Trading Positions.
* Happy PIP Hunting Traders.
FXKILLA.
ETHWAVAX_1ACF15.USD trade ideas

$ETH is trading around $4,000 after hitting the $4,800–5,000 $ CRYPTOCAP:ETH is trading around $4,000 after hitting the $4,800–5,000 resistance zone I mentioned in my last update. As expected, a short-term correction is playing out toward $3,500–$3,200, with possible extension to $3,100, where I’ll be looking to buy again. My bullish targets remain around $5,000 and $6,000, and I’ll share timely updates as the setup develops.

ETH Macro Picture, Pullback then $10k?CRYPTOCAP:ETH had a massive rally from the wave (II) bottom with a poke above all time high followed by extremely greedy sentiment on social and mainstream media of which I was warning should mark a local top and trap new investors.
Price has now pulled back to the first High Volume Node support target. I am expectinga deeper pullback over the next few weeks to complete wave (2) with an initial terminal target of the weekly pivot $3179 which is also the 0.382 Fibonacci retracement. That would be shallow for wave 2 which is expected in a wave III. However, the 0.5 Fibonacci retracement sits at the next major High Volume Node support where it is expected to meet the weekly 200EMA adding a lot of confluence to this are as the next bottom, $2660.
Any further downside bring up the S1 weekly pivot, golden pocket and high volume node, $2250.
There is weekly bearish divergence from the early 2024 highs.
I will play this trading plan point by point and look for longs at key levels to at least secure some bounce profits if not find a bottom.
Safe trading

Symplegades Part II – Ethereum at the Threshold of Breakout or B⚔️🌉 Symplegades Part II – Ethereum at the Threshold of Breakout or Breakdown 💥🧭
In the previous post, we explored Ethereum’s mythical challenge — the Symplegades, or Clashing Rocks. That post resonated, and now… here comes Part II.
ETH is once again caught in a narrowing passage, this time defined by:
📌 $2,805 – $2,911 resistance overhead
📌 $2,616 – $2,565 support just below
💡 Pectra could be the fuel to break out — or just another wave that crashes on the rocks. The chart shows the potential for both:
➡️ A clean breakout could spark a move to “Destination 1” (~$4.8K)
⚠️ A rejection here might drag us back under $2.6K, even toward $2.1K and $1.8K zones
The Pectra breakout box is clear. But the market won’t hand it to us easily. It rarely does.
🧠 With Vitalik still “asleep,” it’s a tight spot. But if this move gathers momentum? We could be at the very start of Ethereum’s next wave.
📽️ The full video posted earlier today dives into this thesis and why macro + micro signals are conflicting but critical.
📊 Stay tuned — Bitcoin post is up next.
One Love,
The FXPROFESSOR 💙
Disclosure: I am happy to be part of the Trade Nation's Influencer program and receive a monthly fee for using their TradingView charts in my analysis. Awesome broker, where the trader really comes first! 🌟🤝📈

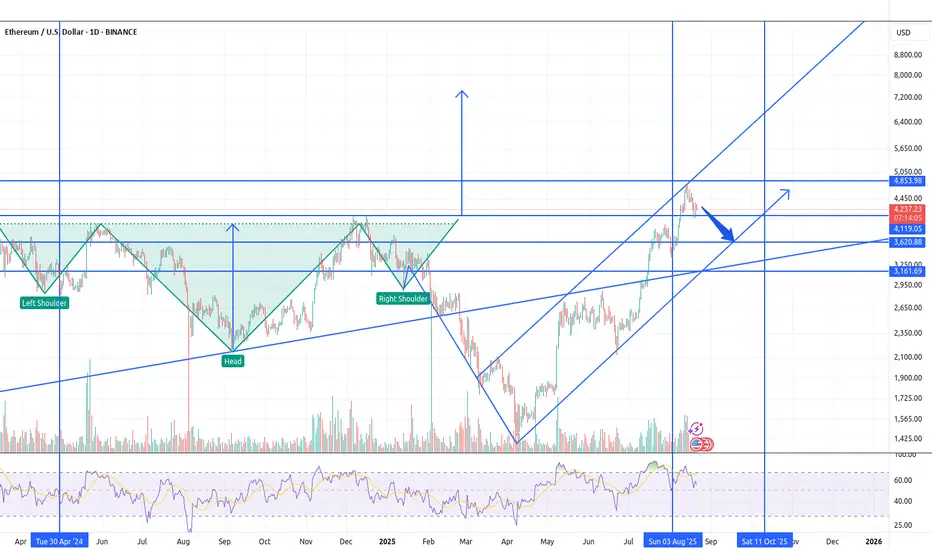
ETH to 40k? 2020-21 Fractal PRESS PLAYWhy?
-meme stock mania redux
-stock market bottoms 6 months before economy (April bottom + 6 = October)
-wyckoff accumulation after sign of strength breakout
New
-deregulation of crypto
-staking of ETH ETFs
-RISC-V future, lighter.xyz, zero knowledge proofs
-layer 2 execution to offload retail flow
press play!
fib lines and PLAY idea inspired by @ScottScotty cheers!

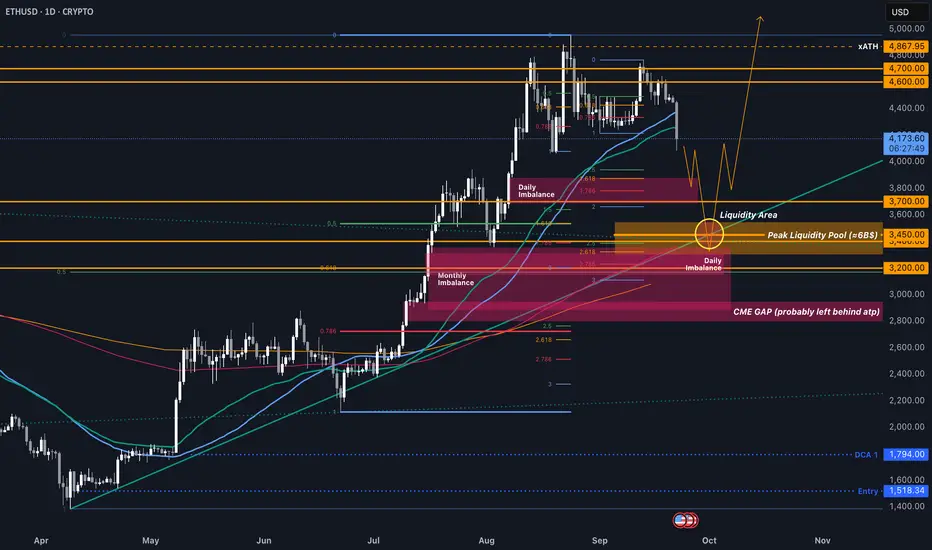
Possible Pre-Skyrocket ManipulationSince every soul on this earth knows that we will see huge bull-moves with given and upcoming rate cuts + october price action, its not unlikely that we COULD manipulate even lower after the Billion Dollar liquidation move overnight.
IF we do so, we would do it pretty fast and continue the displacement from the bearish head and shoulders pattern that broke the daily 50 EMA%SMA in the next few weeks.
On a technical site, there is still a huge amount of liquidity on CRYPTO:ETHUSD left (around 20B$), most accumulated at around 3.450$.
Strangely enough, that area matches the current ranges equilibrium, standard deviation levels of prior bearish manipulation moves, KEY SR Levels of 3400 and 3200, monthly and daily imbalances (which will get filled sooner or later), the 200D EMA and 50W EMA, AND the current htf bullish trendline and broken triangle resistance...
If we hit this before mid-October, these will be free longs, and I will DCA into my position, which sits at 1.794$ currently.
ETHUSD Weekly Scenarios BullsWeekly Scenarios
Bulls
If ETH holds support at $4,200 and manages to rebound above the $4,500-4,600 resistance, we can expect a rally to $5,000 and beyond.
Sideways/Consolidation
The price may remain stuck in the $4,200-4,600 range until the market finds enough signal or volume to break out.
Bears
A breakout below $4,200 with volume confirmation will lead to a decline to $3,800 and below.

ETHUSD SELL NOW 3990🔻 ETHUSD Short Setup – Entry: 3990
Ethereum is facing resistance near 3990, presenting a clean intraday short opportunity. Key bearish signals:
- 🔸 Price rejection at prior supply zone
- 🔸 Bearish divergence on RSI (1H)
- 🔸 Lower high structure forming below 4030
- 🔸 Volume fading on recent push
📉 Trade Plan:
- Entry: 3990
- Stop Loss: 4030
- Take Profit: 3910
Risk/reward ratio: 1:2 – ideal for disciplined scalpers and short-term swing traders. Watch BTC correlation and macro headlines for volatility spikes.

ascending channel/ eliots waveas everyone is panicing and calling a bear market its time to look into the higher time frame of ethereum.
Ethereum is since 9 april in an ascending channel making higher highs and higher lows.
we fineally reached the bottom of the channel and also the $4000 support zone, so double support.
Eliots wave theory: the eliots wave shows etherum has made its wave 1 with a 103% rally, wave 3 with a 130% rally, and wave 5 yet to start. as wave 5 is mostly a bigger run then wave 1 but wave 3 cannot be the shortest it means wave 5 would be a rally of around 104-129%.
INSTITUTIONAL INTEREST and RATE CUTS are also supporting our targets.
according to data on glassnote Ethereum mega-whales are accumulating ETH at their fastest pace in years.

Is this the plan for Eth?for now Eth is perfectly folowing my harmonic pattern. Not sure this one plays out bur fot now still vallid.

ETHUSD corrective pullback support at 4,170The ETHUSD remains in a bullish trend, with recent price action showing signs of a corrective pullback within the broader uptrend.
Support Zone: 4,170 – a key level from previous consolidation. Price is currently testing or approaching this level.
A bullish rebound from 4,170 would confirm ongoing upside momentum, with potential targets at:
4,517 – initial resistance
4,606 – psychological and structural level
4,686 – extended resistance on the longer-term chart
Bearish Scenario:
A confirmed break and daily close below 4,170 would weaken the bullish outlook and suggest deeper downside risk toward:
4,000 – minor support
3,908 – stronger support and potential demand zone
Outlook:
Bullish bias remains intact while the ETHUSD holds above 4,170. A sustained break below this level could shift momentum to the downside in the short term.
This communication is for informational purposes only and should not be viewed as any form of recommendation as to a particular course of action or as investment advice. It is not intended as an offer or solicitation for the purchase or sale of any financial instrument or as an official confirmation of any transaction. Opinions, estimates and assumptions expressed herein are made as of the date of this communication and are subject to change without notice. This communication has been prepared based upon information, including market prices, data and other information, believed to be reliable; however, Trade Nation does not warrant its completeness or accuracy. All market prices and market data contained in or attached to this communication are indicative and subject to change without notice.

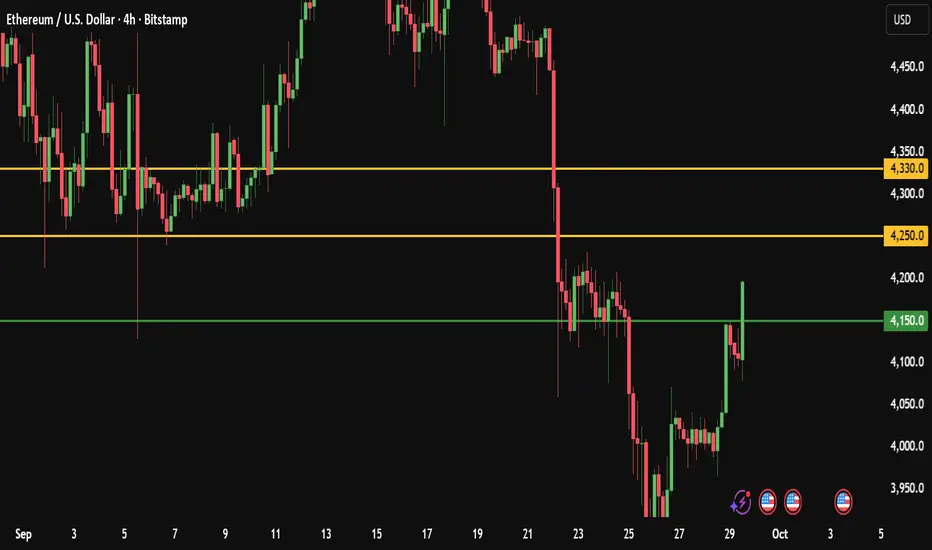
Ethereum Daily Technical Signal: Buy and Target 4330Ethereum Daily Technical Analysis
Ethereum is currently showing signs of strength as it tests the key resistance level around 4150.
A confirmed 4H candle breakout above this zone could trigger fresh bullish momentum, opening the door for higher targets in the short term.
My Personal Long Setup
If the price breaks and closes a 4H candle above 4150, I will enter a long position.
🎯 Target 1: 4250
🎯 Target 2: 4330
❌ Stop-loss: 4040
👍 Don’t forget to boost this trading idea if you found it helpful,
and follow me for more daily crypto insights and trade setups.
⚠️ Please note:
This is not financial advice – I’m only sharing my personal trades.
Always do your own research before taking action.
Best of luck 🌹
$ethEth here in hot water.
$4400 demands respect and this handle has great potential to return it.
Giving a low end of $3900 which has recently come in and if is settled we will get this run.
So again, allow for $3900, track the closures and we’ll see how she goes.
🫣🫶🏽

Zoom out and you'll find peaceIf you zoom out it looks like we are still in an uptrend.
Or am I drawing lines to calm myself down? 😜

ETHUSD H4 | Falling towards pullback supportEthereum (ETH/USD) is falling towards the buy entry at 3,895.02, which is a pullback support that is slightly above the 38.2% Fibonacci retracement and could bounce from this level to the take profit.
Stop loss is at 3,551.04, which is a pullback support that aligns with the 50% Fibonacci retracement.
Take profit is at 4,386.55, which is a pullback resistance.
High Risk Investment Warning
Trading Forex/CFDs on margin carries a high level of risk and may not be suitable for all investors. Leverage can work against you.
Stratos Markets Limited (tradu.com ):
CFDs are complex instruments and come with a high risk of losing money rapidly due to leverage. 65% of retail investor accounts lose money when trading CFDs with this provider. You should consider whether you understand how CFDs work and whether you can afford to take the high risk of losing your money.
Stratos Europe Ltd (tradu.com ):
CFDs are complex instruments and come with a high risk of losing money rapidly due to leverage. 66% of retail investor accounts lose money when trading CFDs with this provider. You should consider whether you understand how CFDs work and whether you can afford to take the high risk of losing your money.
Stratos Global LLC (tradu.com ):
Losses can exceed deposits.
Please be advised that the information presented on TradingView is provided to Tradu (‘Company’, ‘we’) by a third-party provider (‘TFA Global Pte Ltd’). Please be reminded that you are solely responsible for the trading decisions on your account. There is a very high degree of risk involved in trading. Any information and/or content is intended entirely for research, educational and informational purposes only and does not constitute investment or consultation advice or investment strategy. The information is not tailored to the investment needs of any specific person and therefore does not involve a consideration of any of the investment objectives, financial situation or needs of any viewer that may receive it. Kindly also note that past performance is not a reliable indicator of future results. Actual results may differ materially from those anticipated in forward-looking or past performance statements. We assume no liability as to the accuracy or completeness of any of the information and/or content provided herein and the Company cannot be held responsible for any omission, mistake nor for any loss or damage including without limitation to any loss of profit which may arise from reliance on any information supplied by TFA Global Pte Ltd.
The speaker(s) is neither an employee, agent nor representative of Tradu and is therefore acting independently. The opinions given are their own, constitute general market commentary, and do not constitute the opinion or advice of Tradu or any form of personal or investment advice. Tradu neither endorses nor guarantees offerings of third-party speakers, nor is Tradu responsible for the content, veracity or opinions of third-party speakers, presenters or participants.

Eth to 10kEth looks to have broken out of its consolidation range. I prefer direct exposure and am also in BMNR. I believe this 4 year cycle will be broken and this cycle actually goes on much longer than people think. Eth has real use cases that are metalizing before our very eyes.

ETHUSD Long Idea: Bullish Break and Retest of Key ResistanceHello TradingView Community,
This post outlines a potential long trade setup on the Ethereum / U.S. Dollar (ETHUSD) pair, based on the 15-minute timeframe.
Technical Analysis:
The chart shows a significant horizontal price level at approximately $4,094.60. This level has acted as a key pivot, serving as both support and, more recently, as a strong resistance zone that capped the price.
We have now seen a decisive breakout above this resistance, which is a strong bullish signal suggesting a potential shift in market momentum. The trading idea is based on a classic "break and retest" pattern. The plan is to look for a long entry on a pullback to this former resistance level, with the expectation that it will now act as new support and provide a base for the next move higher.
Trade Setup:
The long position tool on the chart visualizes a potential trade plan based on this scenario:
Entry: Approximately $4,094.60 (at the retest of the new support).
Stop Loss: $4,007.15 (placed below the key support level to invalidate the idea if the level fails to hold).
Take Profit: $4,432.58 (targeting the next potential area of resistance or a new higher high).
This setup provides a structured plan with a favorable risk-to-reward ratio for a potential bullish continuation.
Disclaimer: This analysis is for educational and discussion purposes only and should not be considered financial advice. Trading cryptocurrencies involves significant risk. Please conduct your own due diligence and manage your risk appropriately.

$eth updateAs anticipated
CRYPTOCAP:ETH finally rolling out…
Last minute there and looks to be en route.
Targets remain, $4330 - $4400 crucial.
Really gonna be on closures here because we could see a potential high @$5600 OR a full blown roll over sending us back into the realms of $3200.
Month coming to a close, next 2weeks will play crucial to q4 pricing.
Let’s go Traders!!!! ✊🏾

Ethereum (ETHUSD) Nearing Support, Ready for a TurnaroundThe short-term Elliott Wave analysis for Ethereum (ETHUSD) indicates that the cycle from the August 24, 2025 peak continues to unfold as a zigzag Elliott Wave structure. From that peak, wave A concluded at $4,214.14, followed by a wave B rally that reached $4,770.92. Ethereum then turned lower in wave C, which is developing as an impulse Elliott Wave structure. Within wave C, wave ((i)) ended at $4,429.03, and the subsequent rally in wave ((ii)) peaked at $4,649.37.
The cryptocurrency has since extended lower in wave ((iii)), hitting $4,074.40, with wave ((iv)) concluding at $4,208.33. Currently, wave ((v)) is underway and appears mature, suggesting it could end soon. As long as the pivot at $4,770.92 remains intact, further downside is possible. The target for wave C can be calculated using the 100% to 161.8% Fibonacci extension of wave A, measured from the August 24, 2025 peak. This projects a range of $3,553.64 to $4,013.04. Once Ethereum reaches this zone, it could reverse higher or at least rally in three waves. Traders should monitor this area for potential buying opportunities, as it may signal the end of the current corrective phase and the start of a new upward move.

ETH needs a little bit of rest!I think ETH is heading 3600 for a little bit of recovery and gap filling.
ETHEREUM NEXT DUMP COMING✅ Ethereum has made a massive increase in the past 172 days with over 255%. what comes next after such an increase. from the chat, we can see that Ethereum got rejected from the $4955 level that was the previous high, what we should be expecting from Ethereum right now is a drop to the $3700 to $3300 as these areas stands as a key support level in the market.
📝 Note that if Ethereum fails to how these levels, we could see a massive drop in price to the $2900 level as this is a very good demand zone and it lines up with the 200 EMA which makes these area very significant.
📌 Indicator wise, we can see that Ethereum is trading below the 50 EMA which is very critical for the price, also if we look as the weekly MACD, we can see that it is reducing momentum to the down which we need to take very seriously.
🚨Based on the daily time frame, what we should be expecting is price retrace-ment
to the $4500 price level, this area is a good point of interest and also a supply zone that we need to see Ethereum retest this zone before any further move can be confirmed in the market.
⛔️NOT THIS IS JUST PERSONAL OPINION NOT FINANCIAL ADVICE DYOR.
🙏 FOLLOW, LIKE SHARE AND COMMENT FOR MORE UPDATES.

#ETHUSD Looking to take support and bounce Higher to ATHBINANCE:ETHUSD Currently at support zone, any panic should find support for more high.

U.S. Government shuts down; Crypto rallies on uncertaintyU.S. Government shuts down; Crypto rallies on uncertainty
The U.S. government officially shut down on October 1, 2025, after Congress failed to agree on a budget. Disputes over spending and healthcare left agencies including the Fed, SEC, and CFTC paralyzed, delaying jobs and inflation data as well as ETF approvals for Solana and XRP.
Bitcoin, Ethereum, and other cryptocurrencies gained on Wednesday, with ETH up 4.2% to $4,330. Analysts said digital assets may be benefiting from pressure on the U.S. dollar, often seen as a trigger for crypto inflows.
Still, a prolonged shutdown could stall Fed rate-cut hopes by blocking key data releases. With borrowing costs already high, cryptos could face headwinds if the impasse drags on.
