ETH To 3,054$ coming to a theatre near you! please see linked ideas, I keep repeating myself just to warn you all.
if bitcoin breaks support at 109,368$ please expect all hell to break loose in the crypto and stock markets.
ETHWAVAX_1ACF15.USD trade ideas

$4600 and potentially ATH coming Ethereum might soon cross its ATH and potentially it might breakout. Given how much it is actually in use for practical purposes, and as many institutions start accumalating, we might see ETH double by end of year.

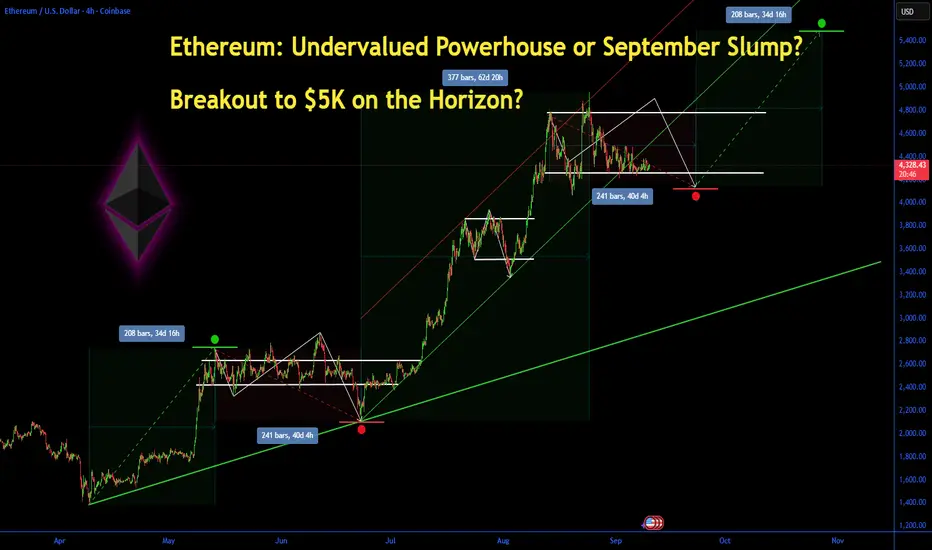
Ethereum: Undervalued Powerhouse or September Slump? Ethereum: Undervalued Powerhouse or September Slump? Breakout to $5K on the Horizon?
Ethereum (ETH) has held steady around $4,300 this month amid a choppy crypto market, down about 15% from its August all-time high but showing resilience with a modest 0.52% gain today to $4,328.5. Early September saw over $500 million in outflows from spot Ethereum ETFs, reversing summer inflows and fueling doubts about institutional appetite.
Yet, with analysts eyeing a potential rally to $9,000–$12,000 by year-end 2025 driven by ETF rotation and broader adoption, is ETH the undervalued blue-chip crypto ready for a rebound, or will seasonal weakness cap its upside? Let's dive into the fundamentals, charts, and key levels to navigate this pivotal moment.
Fundamental Analysis
Ethereum's core drivers remain tied to its ecosystem growth and macroeconomic tailwinds, but recent ETF flows have introduced volatility. As the backbone for DeFi, NFTs, and layer-2 scaling, ETH benefits from rising staking rewards and network upgrades like Dencun, which have boosted efficiency.
Analysts project ETH could hit $5,194 by late September, with long-term forecasts up to $12,000 in 2025 if institutional demand surges via ETFs. However, sticky inflation and Fed policy uncertainty could delay rate cuts, pressuring risk assets like crypto.
- **Positive:**
- Record ETF inflows in July–August signal growing institutional interest; recent positive territory returns hint at rotation back to ETH.
- Staking growth and adoption in DeFi (e.g., Aave, Uniswap) underscore undervaluation, with ETH's market cap at ~$520 billion versus Bitcoin's dominance.
- Broader trends like AI-blockchain integration and regulatory clarity (e.g., potential spot ETFs for challengers like Sui) bolster ETH's utility.
- **Negative:**
- $500M+ ETF outflows in early September reflect profit-taking and risk-off sentiment amid U.S. labor market weakness.
- Seasonal September weakness in crypto, compounded by geopolitical risks, could extend the correction if Bitcoin falters.
Technical Analysis
On the daily chart, ETH is coiling in a tight symmetrical triangle pattern after bouncing from the $4,320–$4,325 support base, with volume picking up on the upside. This consolidation follows a descending channel breakdown, but the hold above key EMAs suggests building momentum for a potential impulse wave higher. Current price: $4,328.5, with VWAP at $4,300 providing intraday support.
Key indicators:
- **RSI (14-day):** Hovering at 48, neutral but nearing oversold territory— a dip below 40 could signal a strong bounce. 📈
- **MACD:** Histogram in negative territory, but the signal line crossover is imminent, hinting at bullish divergence if volume confirms. ⚠️
- **Moving Averages:** Price above the 21-day EMA ($4,280) but testing the 50-day SMA ($4,350)—a sustained hold here avoids short-term bearish pressure.
Support/Resistance: Firm support at $4,320 (recent low and 200-day EMA), with major resistance at $4,500 (August high). Patterns/Momentum: The triangle apex nears; a bullish breakout above $4,500 could target $4,800–$4,952, while failure risks a retest of $4,200. 🟢 Bullish signals: Accumulation on hourly charts. 🔴 Bearish risks: Death cross if 50-day SMA flips below 200-day.
Scenarios and Risk Management
- **Bullish Scenario:** A clean break above $4,500 on ETF inflow news or positive macro data (e.g., softer PCE) targets $4,800 initially, then $5,000–$9,000 by Q4. Buy on pullbacks to $4,320 support for optimal entry.
- **Bearish Scenario:** Drop below $4,320 eyes $4,200 (psychological level); a full death cross could accelerate to $3,800. Avoid longs if Bitcoin slips under $60K.
- **Neutral/Goldilocks:** Range-bound $4,200–$4,500 if data remains mixed, ideal for scalping or options plays.
Risk Tips: Set stops 2–3% below support ($4,200) to cap losses. Risk no more than 1–2% of portfolio per trade. Diversify with BTC or stablecoins to hedge crypto correlations—avoid overexposure in this volatile September.
Conclusion/Outlook
Overall, a bullish bias emerges if ETH reclaims $4,500 and ETF flows reverse, positioning it as an undervalued play with 100%+ upside potential into 2025 amid institutional rotation.
But watch today's crypto volatility and upcoming Fed signals for confirmation—this fits the classic September Effect of weakness before Q4 rallies. What's your take? Bullish on ETH's rebound or sitting out the slump? Share in the comments!
ETH Recovery Underway: Momentum Building!ETH Recovery Underway: Momentum Building!
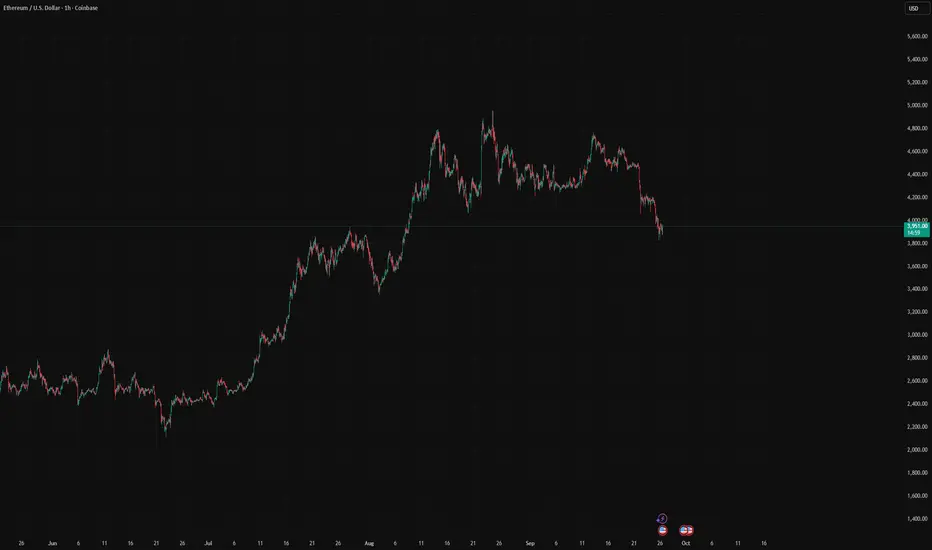
Ethereum (ETH) is currently showing signs of a potential bullish reversal on the 4-hour timeframe. After a significant correction from the 4800-4900 "Sell Order Block" and breaking down through the 4500 "Flip Zone," ETH found strong support around the 3850 key level.
From that low, we've observed the formation of an ascending trendline, indicating a series of higher lows and a gradual recovery in buying interest. The price has successfully climbed back above the 4000 psychological support level and is now testing a more immediate resistance zone, as indicated by the smaller gray box.
A decisive break above this current resistance, potentially pushing towards the 4500 "Flip Zone" again, would significantly strengthen the bullish case. However, maintaining price action above the ascending trendline and the 4000 level is crucial to sustain this recovery momentum. Failure to hold these levels could see ETH retesting the 3850 key support.
Disclaimer:
The information provided in this chart is for educational and informational purposes only and should not be considered as investment advice. Trading and investing involve substantial risk and are not suitable for every investor. You should carefully consider your financial situation and consult with a financial advisor before making any investment decisions. The creator of this chart does not guarantee any specific outcome or profit and is not responsible for any losses incurred as a result of using this information. Past performance is not indicative of future results. Use this information at your own risk. This chart has been created for my own improvement in Trading and Investment Analysis. Please do your own analysis before any investments.

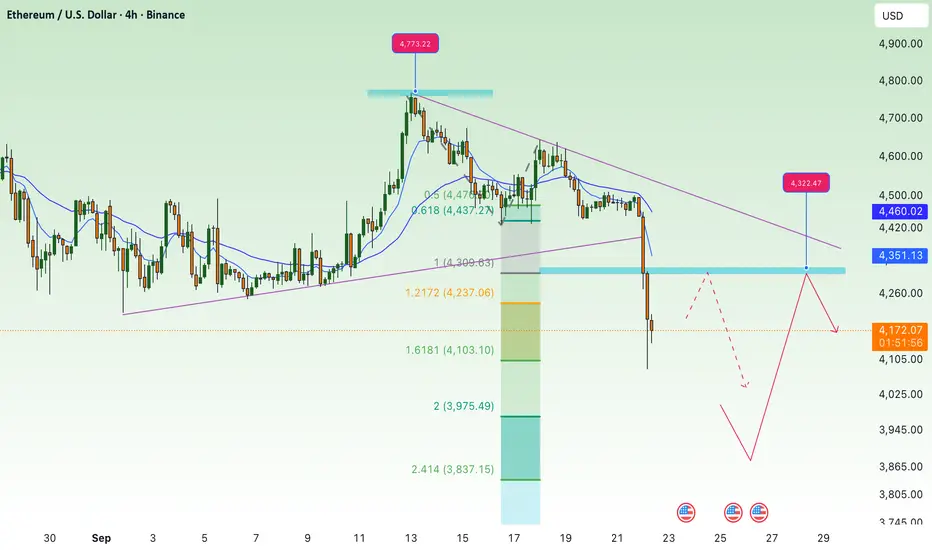
break support, continue to correct downETH 4H Chart Analysis
• Breakout Zone:
ETH has broken below the $4,360 – $4,330 zone (purple box), which previously served as strong support. This signals a shift in sentiment toward bearish momentum.
• Current Price Action:
After a sharp drop, ETH is consolidating around $4,170, hinting at a possible short-term rebound before continuing its downward structure.
• Resistance Levels:
• $4,360 – $4,330: Recently broken support, now acting as strong resistance.
• $4,505: Next resistance above, in line with prior range highs.
• Support Levels:
• $4,166: First Fib extension target, currently being tested.
• $3,880 – $3,900: Major support zone if price declines further (2.618 Fib extension + horizontal demand zone).
• Outlook:
ETH may retest the $4,330 – $4,360 resistance before continuing lower. If bearish pressure persists, the next downside target is around $3,880 – $3,900.
Eth/Usd - Bearish Reversal After Resistance Rejection This chart shows the recent price movement of Ethereum (ETH) against the U.S. Dollar on the 15-minute timeframe. The market initially found strong support in the green zone at the bottom, where price reversed and started moving upwards. This area marked the beginning of a bullish trend, confirmed by breaks of structure (BOS) and a change of character (CHoCH)—indicating a shift from bearish to bullish momentum.
Following this, ETH made a strong bullish move, breaking past previous highs and entering a resistance zone marked in blue. However, once price entered this resistance area, it began to slow down and form what is labeled a “Weak High”, meaning buyers were losing strength and struggling to push price higher.
The chart highlights a potential short trade setup: If a candle closes below the marked support level just under the resistance zone, it would suggest the start of a bearish move. In that case, the suggested trade is to enter a short position and aim for the lower support area (target zone) where the price may again find demand.
This setup reflects a possible trend reversal from bullish to bearish in the short term, especially if price fails to maintain above the resistance and breaks the nearby support.

ETHUSD Bearish Setup: Resistance at Former Support ZoneHello TradingView Community,
Here is a technical analysis of a potential short opportunity on the Ethereum / U.S. Dollar (ETHUSD) pair on the 15-minute chart.
Analysis:
The chart highlights a classic bearish price action pattern known as a "break and retest." We can observe a significant horizontal support level around $4,073.98 that held the price up on several occasions.
Recently, the price has broken down decisively below this support zone, indicating a shift in market sentiment. The price has now pulled back to retest this level from below. The expectation is that this former support will now act as new resistance, rejecting the price and leading to a continuation of the downward move.
Trade Setup:
The short position tool on the chart outlines a potential trade based on this analysis:
Entry: Approximately $4,073.98 (at the retest of the resistance line).
Stop Loss: $4,155.23 (placed above the resistance level to protect against a false breakdown).
Take Profit: $3,826.98 (targeting the next potential area of support).
This setup offers a defined risk management plan for a potential bearish continuation.
Disclaimer: This is purely a technical idea for educational purposes and should not be considered investment advice. Trading cryptocurrencies involves significant risk. Please perform your own due diligence and manage your risk accordingly.

#ETHUSD Looking to take support and bounce Higher to ATHBINANCE:ETHUSD Currently at support zone, any panic should find support for more high.

$ETH I'm LONGING $3997 due to its reliable SUPPORT zoneCRYPTOCAP:ETH long position
ENTRY: $3997
STOP LOSS: $3895
Details in my next posts, but the $4000 ETHEREUM support is one of the greatest support levels in the crypto game.

ETHUSD NEW OUTLOOK According to H1 analysis ETHUSD market is almost at SUPPORT LEVEL so it is the best opportunity to go long from support level market will be fly from here dont bee greedy use money management
TRADE AT YOUR OWN RISK
REGARD ALBERT

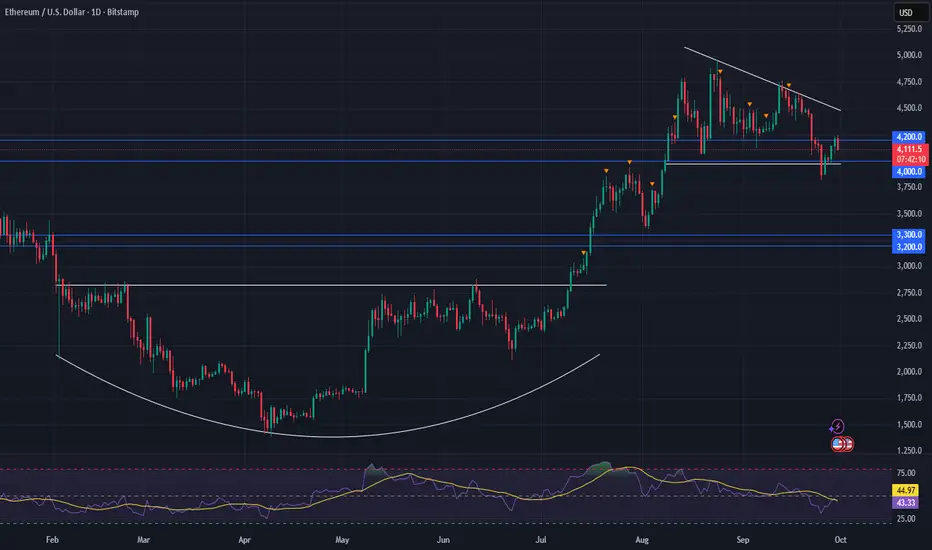
Ethereum Outlook – Key Levels in Play Amid Market JittersAfter a turbulent week across the crypto space—with volatility even bleeding into traditional equities—it's clear just how fragile sentiment remains. We’re seeing the usual overreactions: every minor selloff triggers calls that the bull market is over, despite the broader structure holding up... for now.
🔍 ETH Technical Outlook
Ethereum is retesting a major support zone between 4000–4200. This area has acted as a springboard before, but if it breaks decisively, it could flip to resistance, introducing more headwinds for bullish momentum.
Still, this may be shaping up as another dip-buying opportunity—if macro conditions remain stable and Bitcoin doesn't lead a broader breakdown.
🧱 Next Support Zone
If 4000–4200 doesn’t hold, the next major support zone is 3200–3300. This aligns with previous accumulation levels and would likely draw interest from larger buyers if price gravitates down there.
🔺 Chart Pattern Watch: Triangle Shift
We’ve been tracking a triangle formation, which now appears to be shifting from a symmetrical triangle to a descending triangle—a change in tone, but not yet a deal-breaker for the bulls.
The longer-term target remains intact: we’re still eyeing the 5700–5800 range, assuming structural support zones continue to hold and volume confirms any breakout.
ETH/USD: The Levels Nobody’s Talking AboutETH looks quiet… but the chart is coiling around decision zones.
A) A break of $4,606 clears the path to $5,500.
B) A slip below $3,800 opens the door to $3,669, with a deeper risk toward $2,200.
What most traders miss: it’s not about predicting which level hits first… it’s about understanding what those breaks mean for positioning.
I won’t post a full strategy here, but I’ll say this: the difference between smart money and retail is that smart money prepares before these levels break.
Curious to hear; how are you positioning if ETH chooses either path?

ETH TA 29.09On Thursday, we bounced well from the important zone with HTF divers and are already back above 4k. Now Ether desperately needs to break through the R1 zone of 4215-4250, and then there won't be any important resistances until 4600+. Currently, locally, we're trading sideways at 3980-4200+. Losing the lower boundary of the sideways range is undesirable and very dangerous for further growth, plus there's a good low there, albeit a Voskresensk one. And the nearest decent support is at 3500.

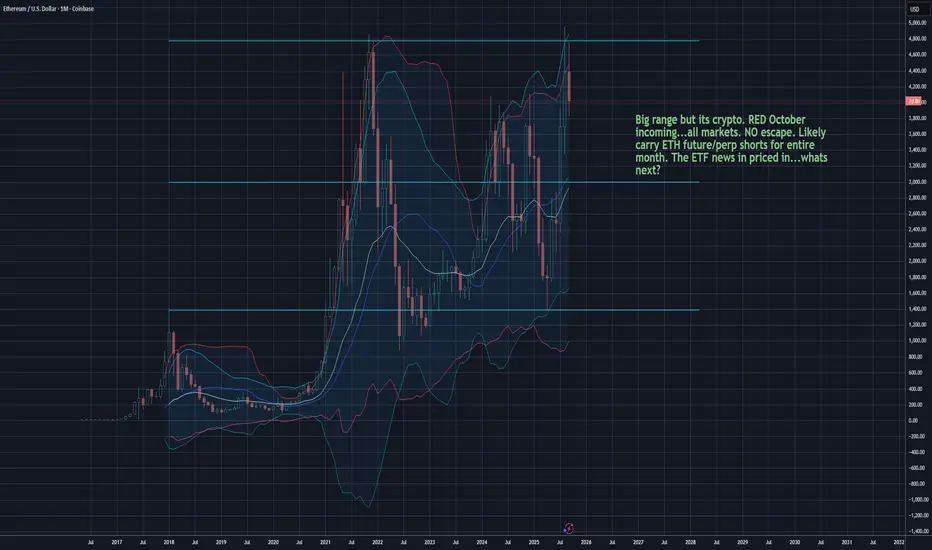
ETH so much good news baked into price...what now?Ethereum hit all time highs on many markets. Lots of excitement around wall-street adoption and staking craze. There are fewer available ETH on most exchanges. Scarcity brings astute collectors that play by different rules. Signs pointing toward a RED October for financial markets.
Rumors of a hard financial system reset continue. They have been around for 4+ years. I will short if we get back towards $4400. Expecting a hard yet short retreat.
Not financial advice & never take advice from anyone on the internet.
ETHUSD H4 | Falling towards pullback supportEthereum (ETH/USD) is falling towards the buy entry at 3,895.02, which is a pullback support that is slightly above the 38.2% Fibonacci retracement and could bounce from this level to the take profit.
Stop loss is at 3,551.04, which is a pullback support that aligns with the 50% Fibonacci retracement.
Take profit is at 4,386.55, which is a pullback resistance.
High Risk Investment Warning
Trading Forex/CFDs on margin carries a high level of risk and may not be suitable for all investors. Leverage can work against you.
Stratos Markets Limited (tradu.com ):
CFDs are complex instruments and come with a high risk of losing money rapidly due to leverage. 65% of retail investor accounts lose money when trading CFDs with this provider. You should consider whether you understand how CFDs work and whether you can afford to take the high risk of losing your money.
Stratos Europe Ltd (tradu.com ):
CFDs are complex instruments and come with a high risk of losing money rapidly due to leverage. 66% of retail investor accounts lose money when trading CFDs with this provider. You should consider whether you understand how CFDs work and whether you can afford to take the high risk of losing your money.
Stratos Global LLC (tradu.com ):
Losses can exceed deposits.
Please be advised that the information presented on TradingView is provided to Tradu (‘Company’, ‘we’) by a third-party provider (‘TFA Global Pte Ltd’). Please be reminded that you are solely responsible for the trading decisions on your account. There is a very high degree of risk involved in trading. Any information and/or content is intended entirely for research, educational and informational purposes only and does not constitute investment or consultation advice or investment strategy. The information is not tailored to the investment needs of any specific person and therefore does not involve a consideration of any of the investment objectives, financial situation or needs of any viewer that may receive it. Kindly also note that past performance is not a reliable indicator of future results. Actual results may differ materially from those anticipated in forward-looking or past performance statements. We assume no liability as to the accuracy or completeness of any of the information and/or content provided herein and the Company cannot be held responsible for any omission, mistake nor for any loss or damage including without limitation to any loss of profit which may arise from reliance on any information supplied by TFA Global Pte Ltd.
The speaker(s) is neither an employee, agent nor representative of Tradu and is therefore acting independently. The opinions given are their own, constitute general market commentary, and do not constitute the opinion or advice of Tradu or any form of personal or investment advice. Tradu neither endorses nor guarantees offerings of third-party speakers, nor is Tradu responsible for the content, veracity or opinions of third-party speakers, presenters or participants.

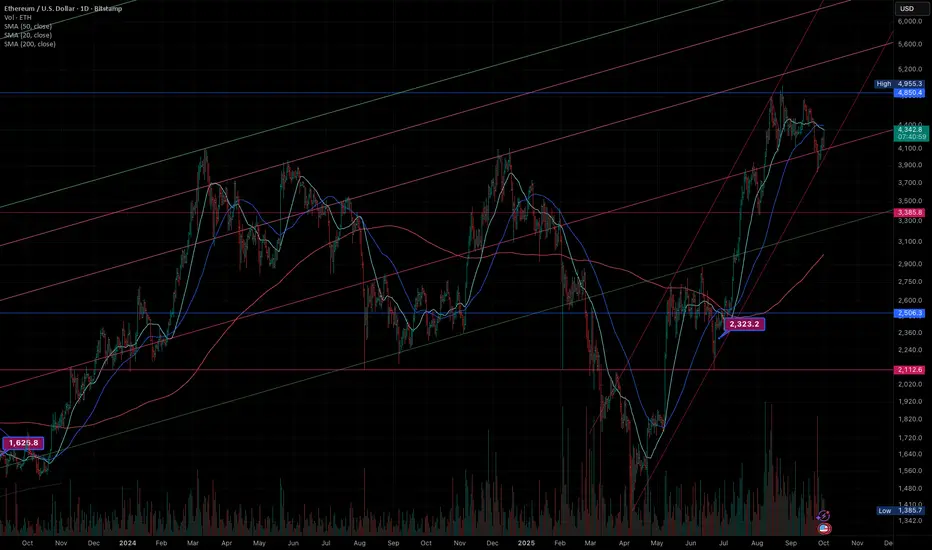
ETH Macro analysis and current cycle targets of $16k-20KI’ve been invested in Ethereum since 2020. Along the way, I took some profits above $4,000 and later rebuilt my position around $1,650. My conviction is rooted in direct experience—after 23 years working in IT, I clearly see both the strengths and limitations of the technology.
What I recognized back in 2020—its dominance, brand recognition, the credibility of its founder, and the trust it commands—is only now becoming clear to the broader market. This is reflected in the growing wave of ETH-based treasury products and institutional adoption.
For me, DeFi was never the main driver. While it has been an important use case, I believe Ethereum’s long-term value will come from its network dominance and trust, which will inevitably extend across multiple industries and verticals.
The logarithmic price chart of ETH since its inception illustrates this well. Historically, each cycle has peaked at roughly 3.4x the previous cycle’s high. If that pattern continues, it aligns with the upper band of the long-term log channel—suggesting potential in the $16K–$20K range during the next cycle.
I don't overthink; I go with what I see and what I know to be the macro trend.
ETHUSD ANALYLTICAL IDEA, FOR 30 SEP, 2025.After the quick fall below $4000, in value, the second in command on the coin market sharply went back to its original position and currently trades around $4100, but the overall direction is bullish as considered the altcoin season. But the question is, will it hold? Or continue pushing above or below well, for now, we can only sit tight on our hands, as my Bias remains bearish for the short term, and I look forward to taking sell trade positions as the price continues to push further in that direction.
As usual, my calls or analysis are based on what we see, the current Bias, and from a probability standpoint, meaning that this projection may be or may not be validated, so tread carefully, and as usual, this is not financial advice, trade responsibly.

ETH/USD - BUILDING MOMENTUM FOR NEXT BULLISH LEGOn the 15-minute ETH/USD chart, we can clearly observe that price action has shifted into a bullish structure after forming a strong impulse move from the lower demand zone. The market respected the higher timeframe liquidity area around 4,140 – 4,150, where buyers stepped in aggressively, creating a solid base for the upward push. From there, a clean series of higher highs and higher lows started to establish, indicating strong bullish momentum in play.
Currently, ETH is respecting the ascending trendline that has been guiding the price upward. Each retest of this trendline has been met with bullish rejections, confirming that buyers remain in control. The price is now consolidating just above the minor supply-turned-demand zone near 4,170, which shows that the previous resistance has flipped into support — a positive sign for continuation.
If the price manages to sustain above this intraday support and trendline, we can expect a potential continuation toward the upside target. Any minor pullback into the demand zone would likely attract buyers again, keeping the bullish structure intact. As long as price stays above the 4,160 zone and does not break below the trendline with strong bearish candles, the bias remains bullish.
Overall, the structure suggests that ETH is preparing for another leg higher, with the projected target in sight. Traders should monitor the price behavior around the support and trendline for confirmation before entering, as clean candle closures above these levels will add confidence to the bullish scenario.

ETH – Eyeing $3.3k Sweep Before Loading LongETH has broken down from its recent range, showing lower highs and consistent selling pressure. I’m watching for one more leg lower into the $3,300 area.
Why $3,300?
A clean sweep here would trap shorts and flush out late longs, setting the stage for a strong bounce.
Setup Plan:
Short-term bias: Bearish, expecting continuation lower into ~$3,300
Will not long until we get a reaction at that level
Long trigger: Strong bounce/reversal signals at $3,300 zone
Targets on the bounce: $3,500 → $3,650 → $3,800
Stop loss: Below $3,250
ETH likely has one more dip before setting up for a cleaner move higher. Patience pays here.
$ETH stop loss TRIGGERED, the BUTTERFLY harmonic pattern pops upCRYPTOCAP:ETH hit my STOP LOSS at $3895, oh well.
It was a bloody day all over the market and including the stock markets, even #Tesla declined by 4.5%.
But CRYPTOCAP:ETH fights on, not yet oversold on RSI so room for further bleeding, definitely.
WAVE C corrective move could drop the price as low as $3563, before the next impulse wave upwards takes place. Downtrend on the DAILY, first one for half-a-year now.
Leverage has been cleared and now most of it are shorts. Liquidity all the way up to the ATH. And nothing much below down to $3000. So, there is that, too.
Very mixed signals.
Bullish BUTTERFLY harmonic pattern popped up and it would be a good base to find a long entry on shorter timeframes, but the CRYPTOCAP:BTC dominance has been too bullish this week for us to long too much💙👽
FLASH CRASH stink orders, why not:
LONG limit orders at:
$3571 and a half-sized one at $3711.

Weekly Prediction For Next Weeks Price ActiknNo Quant, No Bot, Just Lines & Labels📈
Use these labels as guidelines navigate through the markets. This set up is fractal from the monthly to the 1Min. The red line represents trendline liquidity and the yellow line is the wireframe of the order flow. The lines will always cross where the trendline break was which is an indication of Liquidation 1. This stage is where price liquidates the trendline pullback traders at the retest then price creates swing points 3 which is the manipulation that leads to Liquidation 1 at swing point 4 which is price liquidate pending sellers at the trendline break and pending buy stops from the breakout traders. After the takeout, price creates swing point 4 which you can sell to the Pullback level or demand zone.
VOLUME DIRECTION
/\ - Bullish Volume
\/ - Bearish Volume
X - Already Mitigated
WOF - Weekly Orderflow
TIMEFRAME
M - Monthly
W - Weekly
SWING HIGHS & LOWS
SP1- Swing Point1
SP2 - Swing Point 2
SP3 - Swing Point 3
SP4 - Swing Point 4
KEY LEVELS
R - Resistance
S - Support
LIQUIDITY ZONES
EQHS - Equal Highs
LS - Lows
HS - Highs
IMB - Imbalance
PB - Pullback
IND - Inducement

Types of Sanctions: Economic, Trade, and Diplomatic1. Introduction to Sanctions
Sanctions are restrictive measures imposed by one entity—such as a country, group of countries, or international body—on another. Their purpose is to restrict or alter the actions of the target, which may be a nation-state, corporation, or even individuals. The rationale behind sanctions is that applying pressure can compel behavioral change without resorting to direct military conflict.
Sanctions often arise in response to:
Violations of international law (e.g., territorial aggression).
Human rights abuses (e.g., apartheid in South Africa).
Threats to global peace (e.g., nuclear proliferation).
Terrorism or organized crime (e.g., freezing terrorist assets).
Sanctions can be unilateral (imposed by a single state), multilateral (involving multiple states), or global (authorized by organizations like the United Nations).
Among the many forms of sanctions, three stand out due to their widespread application: economic, trade, and diplomatic sanctions.
2. Economic Sanctions
2.1 Definition
Economic sanctions are financial penalties or restrictions imposed to influence the policies or actions of another state or entity. They usually target banking, investment, currency, or financial transactions to undermine the economic stability of the sanctioned party.
2.2 Mechanisms of Economic Sanctions
Economic sanctions typically involve:
Asset Freezes: Blocking access to bank accounts, properties, and other financial holdings.
Restrictions on Financial Transactions: Prohibiting banks from processing payments linked to sanctioned entities.
Investment Bans: Preventing new investments in specific industries or regions.
Debt Restrictions: Limiting borrowing or access to international credit markets.
Currency Controls: Restricting access to foreign reserves.
2.3 Objectives of Economic Sanctions
Deterring aggression: Make the cost of war or hostile acts prohibitively high.
Limiting capacity: Restrict a nation’s ability to fund military or illicit programs.
Promoting policy change: Push governments to alter domestic or foreign policies.
Punishing violations: Penalize actions that contravene international law or norms.
2.4 Case Studies
Iran: Economic sanctions imposed by the U.S. and EU targeted Iran’s banking and oil industries, aiming to prevent nuclear weapon development. These sanctions severely curtailed Iran’s economy and pressured it into negotiations, resulting in the 2015 Joint Comprehensive Plan of Action (JCPOA).
Russia (2014 and 2022): Following Russia’s annexation of Crimea and later the invasion of Ukraine, sweeping sanctions targeted its financial institutions, reserves, and access to global markets. The aim was to weaken its economy and reduce its ability to sustain military operations.
North Korea: Sanctions restrict Pyongyang’s access to global finance and luxury goods, designed to limit its nuclear program’s funding.
2.5 Effectiveness and Criticisms
While economic sanctions can exert enormous pressure, their effectiveness varies. Sometimes, they succeed in bringing parties to the negotiating table; other times, they push states toward alternative alliances or informal economies. Criticisms include:
Humanitarian impacts: Ordinary citizens often suffer more than ruling elites.
Circumvention: Nations may evade sanctions via smuggling or alternative partners.
Political resistance: Instead of weakening regimes, sanctions may strengthen nationalist sentiments.
3. Trade Sanctions
3.1 Definition
Trade sanctions are restrictions on imports, exports, or access to markets. Unlike broad economic sanctions, trade sanctions specifically target goods, services, or technologies.
3.2 Mechanisms of Trade Sanctions
Export Bans: Prohibiting certain goods or technologies from being exported.
Import Restrictions: Blocking the purchase of goods from the target state.
Tariffs and Quotas: Raising barriers to trade to reduce economic interaction.
Sectoral Restrictions: Targeting industries such as energy, technology, or defense.
Embargoes: Comprehensive bans on all trade with a country.
3.3 Objectives of Trade Sanctions
Reduce economic growth: By cutting off access to international trade.
Limit access to technology: Prevent development of weapons or advanced systems.
Send political messages: Isolate regimes diplomatically through trade exclusion.
Promote human rights: Restrict the export of goods that could enable repression.
3.4 Case Studies
Cuba Embargo: The U.S. imposed a trade embargo on Cuba in 1960 to weaken Fidel Castro’s communist regime. While the embargo isolated Cuba for decades, it did not topple the government, sparking debate about its long-term utility.
South Africa (Apartheid Era): Trade sanctions and boycotts against South Africa in the 1980s targeted its exports, particularly minerals, to pressure the government into ending apartheid. These measures, combined with internal resistance, helped bring reform.
Technology Sanctions on China: Recent sanctions have restricted China’s access to advanced semiconductor technologies, aiming to slow its military and technological advancements.
3.5 Effectiveness and Criticisms
Trade sanctions can be powerful but have mixed results:
Effective when applied multilaterally (e.g., South Africa).
Ineffective when targets find new markets (e.g., Cuba trading with Europe and Asia).
Criticism: Often harm economic growth broadly, with limited influence on ruling elites.
4. Diplomatic Sanctions
4.1 Definition
Diplomatic sanctions involve reducing or severing official diplomatic relations. Unlike economic or trade sanctions, they focus on political isolation rather than financial or commercial restrictions.
4.2 Mechanisms of Diplomatic Sanctions
Expulsion of Diplomats: Declaring diplomats persona non grata.
Suspension of Diplomatic Relations: Downgrading or cutting ties entirely.
Exclusion from International Forums: Preventing participation in organizations (e.g., G8 suspension of Russia in 2014).
Visa Bans: Restricting leaders and officials from traveling abroad.
Symbolic Actions: Boycotting state events or summits.
4.3 Objectives of Diplomatic Sanctions
Signal disapproval: Express international condemnation of actions.
Isolate politically: Reduce legitimacy and influence of governments.
Pressure regimes: Encourage policy changes through political isolation.
Prevent escalation: Use symbolic actions instead of military confrontation.
4.4 Case Studies
Russia’s G8 Suspension (2014): Following the annexation of Crimea, Russia was expelled from the G8, signaling diplomatic condemnation.
Myanmar (Post-2021 Coup): Many countries downgraded diplomatic engagement and excluded Myanmar from ASEAN summits.
Iran (Post-1979 Revolution): The U.S. severed diplomatic ties after the hostage crisis, limiting formal engagement for decades.
4.5 Effectiveness and Criticisms
Diplomatic sanctions are often symbolic but can still have impact:
Effective when combined with economic/trade sanctions.
Symbolic in cases where states already embrace isolation.
Criticism: They limit dialogue, reducing opportunities for peaceful negotiation.
5. The Interconnected Nature of Sanctions
In practice, these sanctions rarely exist in isolation. Governments and international bodies often use them together as part of a broader strategy. For instance, against Russia in 2022, the West imposed:
Economic sanctions (asset freezes, exclusion from SWIFT).
Trade sanctions (bans on oil and technology exports).
Diplomatic sanctions (diplomatic expulsions, exclusion from forums).
Together, these measures amplify impact and present a united front, but they also carry risks such as retaliatory actions, global market disruptions, or long-term geopolitical divides.
6. Global Consequences of Sanctions
Sanctions reshape global politics and economics in multiple ways:
Geopolitical Realignments: Countries under sanctions may seek new alliances (e.g., Russia and China deepening ties).
Impact on Global Trade: Sanctions disrupt supply chains, especially in energy and commodities.
Humanitarian Implications: Civilians often face shortages, inflation, and unemployment.
Technological Fragmentation: Trade restrictions on high-tech goods may create separate technological ecosystems.
Erosion of Multilateralism: Unilateral sanctions sometimes undermine collective international decision-making.
7. Critiques and Ethical Considerations
Sanctions, though non-military, raise important ethical debates:
Do they harm the guilty or the innocent? In many cases, ordinary citizens bear the brunt, while elites remain insulated.
Are sanctions coercion or legitimate pressure? Critics argue sanctions can be instruments of coercion and neo-imperialism.
Do sanctions work long-term? Some argue they harden regimes instead of weakening them.
8. Future of Sanctions
The global landscape suggests sanctions will remain central to international diplomacy. Trends include:
Targeted Sanctions: Focusing on elites and sectors instead of entire populations.
Technological Sanctions: Increasing emphasis on restricting access to AI, semiconductors, and advanced technologies.
Financial Innovation: Cryptocurrencies may help evade sanctions, requiring new regulatory approaches.
Greater Multilateralism: Sanctions are more effective when applied collectively.
Hybrid Sanctions: Combining economic, trade, and diplomatic measures with cyber and informational tools.
Conclusion
Sanctions represent a powerful yet imperfect alternative to military conflict. Economic, trade, and diplomatic sanctions serve different but interconnected purposes: economic sanctions weaken financial capabilities, trade sanctions restrict goods and markets, and diplomatic sanctions isolate states politically.
Their effectiveness depends on global cooperation, the resilience of the targeted state, and the degree to which they align with broader strategic goals. While sanctions can promote peace and discourage aggression, they also risk unintended consequences, particularly humanitarian crises.
Ultimately, sanctions are tools—not solutions. They can pressure, isolate, and punish, but sustainable change requires diplomacy, dialogue, and international consensus. As the global order becomes increasingly multipolar and interconnected, sanctions will continue to evolve as instruments of statecraft—balancing between coercion, persuasion, and the pursuit of stability.
ETHERUM FREE SIGNAL|LONG|
✅ETHUSD reacts from higher-timeframe support, running sell-side liquidity before shifting orderflow bullish. Entry at discount seeks draw on liquidity above, targeting imbalance fill near 4360$.
—————————
Entry: 4,169$
Stop Loss: 4,050$
Take Profit: 4,360$
Time Frame: 7H
—————————
LONG🚀
✅Like and subscribe to never miss a new idea!✅
