ETHERUM FREE SIGNAL|LONG|
✅ETHUSD reacts from higher-timeframe support, running sell-side liquidity before shifting orderflow bullish. Entry at discount seeks draw on liquidity above, targeting imbalance fill near 4360$.
—————————
Entry: 4,169$
Stop Loss: 4,050$
Take Profit: 4,360$
Time Frame: 7H
—————————
LONG🚀
✅Like and subscribe to never miss a new idea!✅
ETHWAVAX_1ACF15.USD trade ideas

ETH and BTC seeking further lows?Everything explained in video, please let me know if I missed anything or any other thoughts 🙏🏾


ETHUSD corrective pullback support at 4,170The ETHUSD remains in a bullish trend, with recent price action showing signs of a corrective pullback within the broader uptrend.
Support Zone: 4,170 – a key level from previous consolidation. Price is currently testing or approaching this level.
A bullish rebound from 4,170 would confirm ongoing upside momentum, with potential targets at:
4,517 – initial resistance
4,606 – psychological and structural level
4,686 – extended resistance on the longer-term chart
Bearish Scenario:
A confirmed break and daily close below 4,170 would weaken the bullish outlook and suggest deeper downside risk toward:
4,000 – minor support
3,908 – stronger support and potential demand zone
Outlook:
Bullish bias remains intact while the ETHUSD holds above 4,170. A sustained break below this level could shift momentum to the downside in the short term.
This communication is for informational purposes only and should not be viewed as any form of recommendation as to a particular course of action or as investment advice. It is not intended as an offer or solicitation for the purchase or sale of any financial instrument or as an official confirmation of any transaction. Opinions, estimates and assumptions expressed herein are made as of the date of this communication and are subject to change without notice. This communication has been prepared based upon information, including market prices, data and other information, believed to be reliable; however, Trade Nation does not warrant its completeness or accuracy. All market prices and market data contained in or attached to this communication are indicative and subject to change without notice.

ETH Correction Finally Underway!Local Analysis / Targets / Elliot Wave
I have been banging the drum about a deeper ETH pullback for a weeks and it appears to be finally underway with bearish market structure confirmed with the lower low from yesterday. Online sentiment, mainstream media attention, silly price targets from analysts, discussions of the ‘the flippening’ returned and Trumps son bragging on X were all major warning signs of a local top. The ETH validator exit queue is record breaking causing a delay of 40+ days if you want to un-stake your ETH. Wrapped Ethereum like stETH may be a good option if you really want out fast! Weather this supply hits the markets is still up in the air.
Price is in the High Volume Node support and below the daily pivot. This isn’t likely to break immediately but after a few attempts to weaken it first (4? lol). The first target for the end of the correction is the same as a few weeks ago - the S1 pivot, rising daily 200EMA and 0.382 Fibonacci retracement at $3500, followed by the S2 pivot, High Volume Node support and 0.786 ‘alt-coin golden pocket’ at $2700. This could present a great buy opportunity.
RSI is making its way to oversold which is a good sign when in a range.
Standard Deviation Band Analysis
Standard deviation bands tell a different story with price still only testing the fair value regression line as resistance after presenting a fantastic buy opportunity from the green zone earlier this year. Price rides this line most of the time as you can see by looking left. A significant breakout above would see the SD+2 threshold target around $7000, a blow off top could reach $10,000 at the SD+3 threshold.
Safe trading

Buy Plan: ETH/USD (Monthly Timeframe)Buy Plan: ETH/USD (Monthly Timeframe)
1. Setup:
Price has formed a valid bullish monthly dealing range (DR Monthly).
Reaction observed from the lower part of the range (support area highlighted in red).
Trend shows recovery after the previous consolidation (green area).
2. Entry:
Buy at current price level near $4,126 – $4,140, after confirmation of bullish monthly momentum.
3. Stop Loss:
Below the lower wick of the recent monthly candle: $1,749.58.
4. Target:
Aggressive target around $35,534 (upper green zone on chart).
5. Risk-Reward:
High R:R potential due to large upward target compared to risk.
6. Notes:
Patience is key: Wait for monthly candle close confirmation.
Avoid entering if price closes below the red support zone.
Monitor for any reversal patterns forming at resistance levels.

ETH and Crypto going for weekly correction levels?Everything explained in video, let me know if I missed anything 🙏🏾
Don't forget to like this if you would love to see more of these reviews!

Something will happen soonIn the next week we will see a move out of this triangle, that's a certainty. And I expect a strong move, either up or down. I stay long.

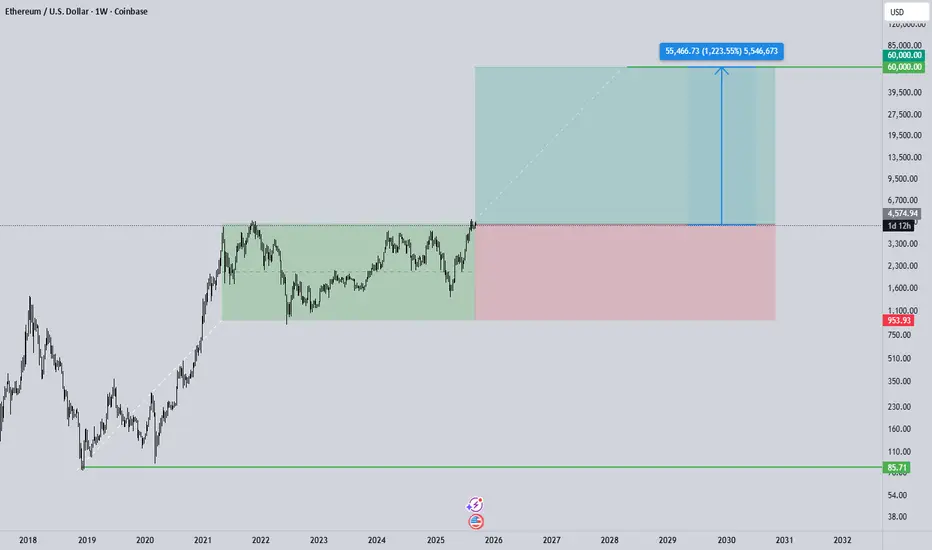
Ethereum Weekly Chart Outlook: Breakout Potential & 60K near!The weekly Ethereum chart shows that after years of consolidation within a broad range (green box), the price is now testing the upper boundary and attempting a breakout. Such behavior typically signals the start of a major bullish phase, provided the breakout is confirmed on the weekly close and the former resistance successfully turns into support. Based on projections, the first intermediate targets could be around 7.4k, 9–12k, and then 16k, while the long-term projection of 60k (+1200% from the current price) represents a highly optimistic multi-year scenario. On the other hand, if the breakout fails and price settles back below resistance, a return to the 1k region is possible. The reward-to-risk ratio of this trade, with a stop at 953 and a target of 60k, is exceptionally high (over 15:1), but the wide stop severely limits position size and demands strict risk management. Therefore, a secure entry should only follow a confirmed weekly close above resistance with a successful retest, and traders should plan for partial profit-taking at intermediate levels along the way.
Fly ETH!Wether the correction over or not, ETH is going to ATH. WXY is currently completed, and from this point ETH can go higher and higher. If the market decides it's not over yet it can dive one more level down to 3960 and transwork WXY to ABC.
Be cautios though, don't enter the market w/o stop loss. Bulls let's get control back!!! Fly ETH!!!

$ETHUSD: Riding the Lightning - The Short Trade is ActiveThe Trade is Active
Greetings, fellow navigators. The market has spoken, and our patience has been met with a trigger. The short setup we've been observing on BITSTAMP:ETHUSD is now live, with price having tagged our entry zone around the $4590 - $4600 level. If stopped out at 4800, we would be okay to re-enter, keeping the stop loss above the most recent swing high.
The thesis remains as discussed: after a powerful "inhale," the market appears to be taking a corrective "exhale." Price has broken the lower boundary of its immediate ascending channel, signaling a potential shift in short-term momentum. The plan is in motion.
Style: Short / Mean Reversion
Entry: ~$4590 (Active)
Stop Loss: ~$4814
Take Profit: ~$3000
Risk/Reward: Approximately 1 : 6.9
The Philosophy - A Word on Trading Crypto
To trade crypto is to engage with the market in its wildest form. It is the extreme sport of the financial world. The volatility here is a double-edged sword; it can carve out immense opportunity, but it demands the utmost respect and skill to handle without getting cut. Trying to catch a reversal in this space can feel like trying to catch a falling blade that has no handle.
This is why we don't "catch"; we plan. We define our risk before we ever enter. The "doctor's orders" for navigating this beautiful chaos are simple, but not easy:
A healthy dose of strategically placed stop losses.
A commitment to non-degenerate risk management.
A big smile, because the lessons learned here will forge you into a disciplined trader.
A Note on Your Well-Being
I speak of getting "cut" not to be grim, but to be real. This path can be intensely lonely, especially when the market delivers a harsh lesson. I've been there. If you are struggling, or ever lose more than you were prepared to, I want you to know that you do not have to carry that weight alone. Please reach out to someone.
Everything money can buy is cheap. You are priceless.
If you are struggling, you don't have to do it alone.
988 Suicide and Crisis Lifeline
Hours: Available 24 hours
Just shine.
Disclaimer: This is not financial advice. It is for educational and informational purposes only. Please conduct your own research and manage your risk accordingly.

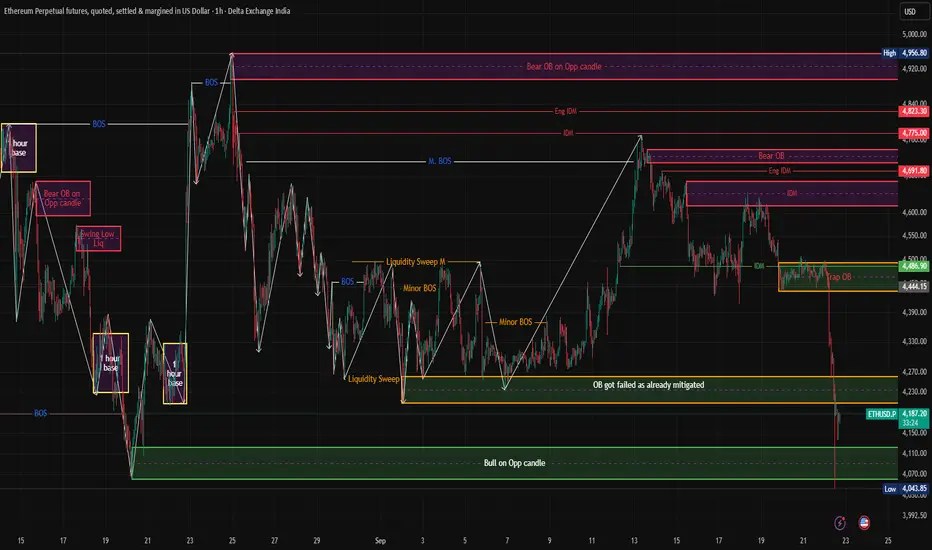
A Clear Bullish set up is getting ready in ETH ETH is showing a bullish setup after recent liquidity sweeps and reaction from the higher-timeframe demand zone.
🔑 Key Observations:
Price tapped into the Bullish Opposite Candle Order Block (4040–4100 zone) and reacted strongly.
A Liquidity Sweep & smart money is likely accumulating.
The Trap Bear OB around 4440–4480 acts as the first magnet for price.
If momentum continues, the next liquidity pool sits higher near 4690–4820, where multiple Bear OBs + IDM overlap.
📌 Trading Plan (Sniper Style):
Entry Zone: 4040–4100 (Bull OB)
Stop Loss: Below 4030 (invalidation)
Target 1: 4440–4480 (Trap OB)
Target 2: 4690–4820 (Major Supply / Bear OB cluster)
💡 Bias: Bullish as long as 4040 demand holds. A clean close below would invalidate the setup.
Ethereum Elliott Wave Buy Setup: Targets 4550 and 4600Ethereum Daily Update (Elliott Wave Setup)
Based on my daily monitoring of Ethereum and according to the Elliott Wave count (which I’ll share shortly with the full analysis), I see a long opportunity forming.
Here’s my personal trade plan:
✅ Entry 1: Buy from current price 4450 / 4445
✅ Entry 2: If price dips, add another buy at 4400
🎯 Target 1: 4550
🎯 Target 2: 4600
Stop-loss: For both entries, a daily close below 4350
Please note:
This is not financial advice – I’m only sharing my personal trades.
Always do your own research before taking action.
👍 Don’t forget to like if you found this useful, and feel free to follow me for more analysis of this kind.
Best of luck 🌹

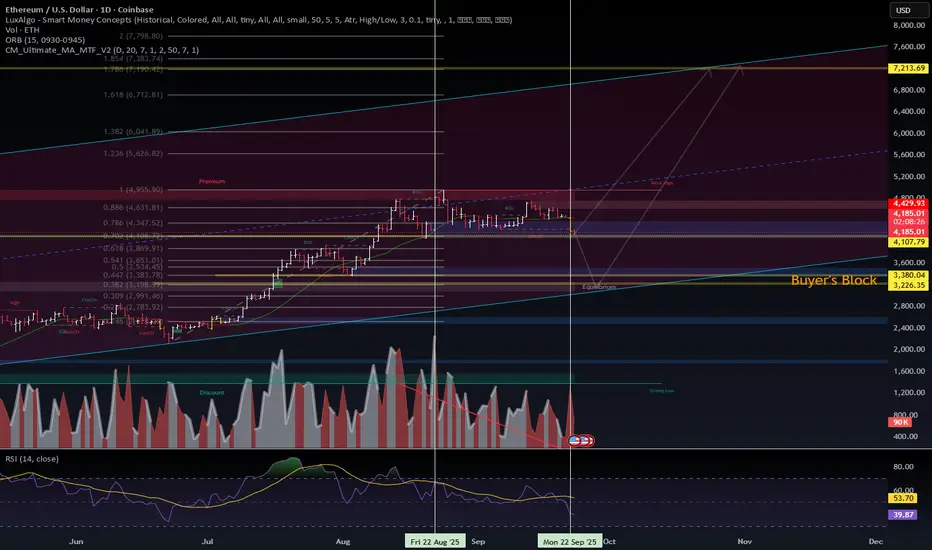
ETH-USD | Range Decision Point — Model vs. StructureETH-USD | Range Decision Point — Model vs. Structure
Ethereum is consolidating under the 0.786 ($4,347) supply band.
Chart (SMC levels): Daily support sits at $4,108. A clean break below exposes $3,895–$3,700, then the larger Buyer’s Block $3,380–$3,266.
Momentum: RSI at ~40 with selling volume dominance = downside bias until $4,347 is reclaimed.
Model (30-day forecast): Institutional ensemble issues a Strong Sell → target $3,895.5 (−7%), with a wide CI down to $3,193.
Game plan:
Bearish path: Daily close < $4,108 → look for $3,950 → $3,895.
Bullish path: Sweep/reclaim $4,108, then acceptance > $4,347 unlocks $4,520–$4,620.
Key Levels:
Bull trigger: >$4,347
Bear trigger: <$4,108
Near-term target: $3,895 (model alignment)
Long-term channel top: $7,713 (stretch target if buyers regain control)
Not financial advice. Educational mapping for VolanX DSS testing.
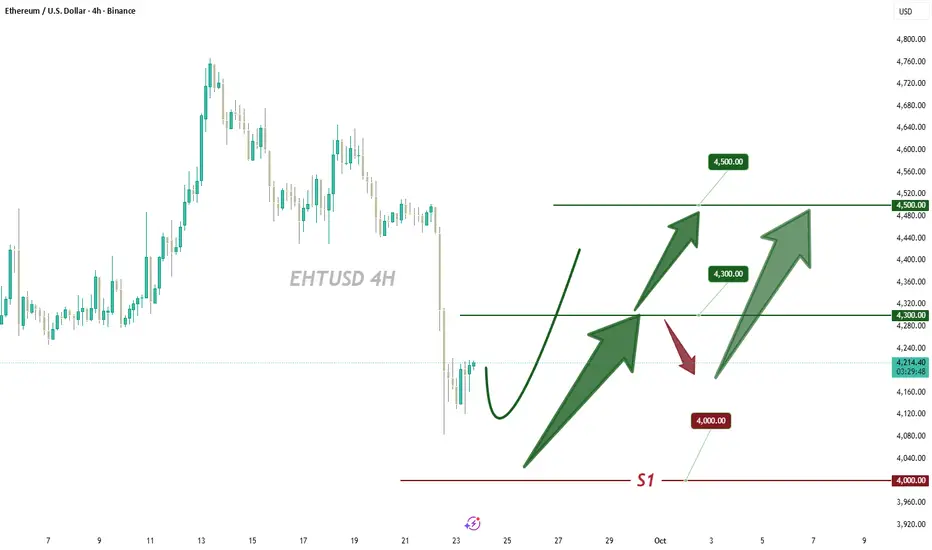
Hold 4000 Support, ETH Awaits ReboundETH has stabilized its downward trend . If the 4000 support level remains unbroken , we can continue to wait for a rebound 📈
Buy 4100 - 4150
TP 4250 - 4350 - 4450
Accurate signals are updated every day 📈 If you encounter any problems during trading, these signals can serve as your reliable guide 🧭 Feel free to refer to them! I sincerely hope they'll be of great help to you 🌟 👇
Ethereum Long Term AnalysisEthereum is done.
Biggest bull trap of the year in crypto. Going to $1800 within the next 48 hours. I told you here first.

Ethereum at Make-or-Break: Resistance vs Support..ETH/USD
Support Zone: 4300 – 4350 (Highlighted in Beige)
This is where buyers previously stepped in, providing a strong cushion for price. If ETH holds above this level, short-term relief bounces are possible.
Resistance Zone: 4480 – 4500 (Highlighted in Blue)
This is the critical supply area where sellers are active. Each time the price tested this zone, rejection followed, confirming strong resistance.
Trade Setup (Bearish Bias)
Entry Zone: 4484 – 4488 (Near Resistance Rejection)
Stop Loss: Above 4520 (to protect against breakout risk)
Target 1: 4200 (first minor support zone)
Target 2: 4000 (major support zone + psychological level)
This chart clearly shows ETH stuck between heavy resistance (4480–4500) and strong support (4000–4300).
As long as ETH trades below resistance, sellers control the market.
A rejection from 4484–4488 favors short entries, with potential downside continuation towards 4000.
Only a clean breakout and daily close above 4520 will shift the momentum back in favor of bulls.

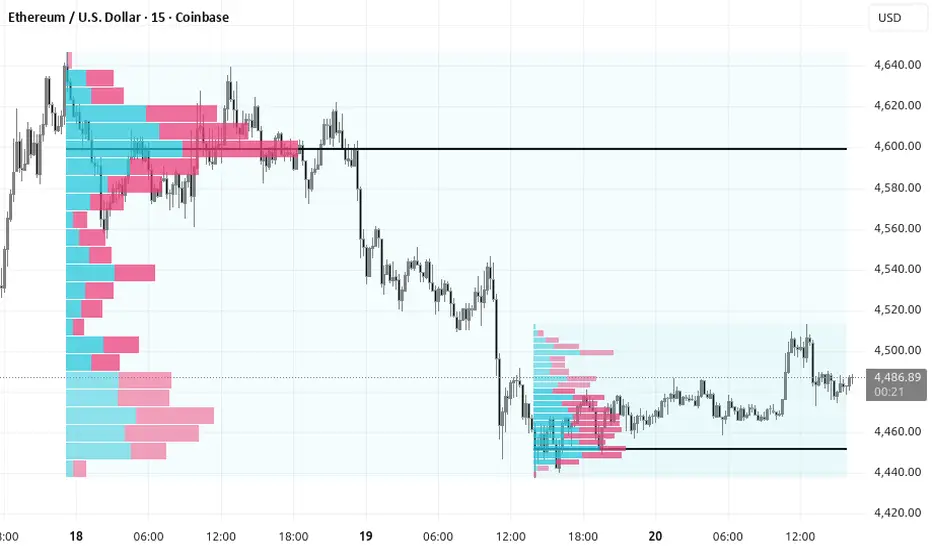
Volume profile analysisI asked AI regarding this analysis:
In volume profile, let's say the bigger swing has the poc at higher price and lower swing has the poc at a lower price. this is 15 minute eth/usd. does price graviate towards higher volume or lower volume?
Response:
In volume profile analysis, price tends to gravitate toward areas of higher volume, specifically the Point of Control (POC), because these represent price levels where the most trading activity occurred, indicating balanced supply and demand or fair value. Lower volume areas often act as zones where price can move quickly through due to less interest or liquidity.
If a bigger swing has its POC at a higher price and a lower swing has its POC at a lower price on a 15-minute ETH/USD chart, price is generally more likely to be attracted to the higher volume areas (POCs) rather than low-volume areas. The POC acts as a magnet where buyers and sellers find equilibrium, and price may return to or consolidate near these high-volume nodes.
Thus, price generally gravitates toward higher volume levels (POC) as these signify price acceptance and fair value, while lower volume areas usually allow for faster price movements or rejections due to lower participation and interest
ETHUSD bull pennantA bull pennant on the 2h chart for ETH USD. I'm not sure how this will play out. The price has held very good so far. Today's sunday candle will be very indicative. If this goes up from here shorts will be cancelled and it will fly. If not then the future holds something different.

long ethlong ETH. 96% de probabilidad. a quick one. small position and long on ETh. go with carefull, 1% or 2%, no more.

Eth Updatehey Guys,
This is an brief Update on my last Eth Idea.
Its been a while and our trade still runs in Juicy Profits from our Entrys at 2.3K and 1.6k. I mentioned in the comments that i expect a pullback.The Entrys i am looking at are between 3.2k and 2.7k . I also highlighted some price action from previous Bull Run so you Guys understand where we are atm.I think a 30% Dip Like in Last run is on the table which would be a great buying oppertunity If you got some Cash in the Side. i will Double down at These Levels and also keep my old Position running. Understand that price can Always reverse and move up from other Support zones. my Levels are Not fixed in Stone.So If price decides to to bounce earlier i will Stick to my old Position and Ride it towards 11k
Good Luck
And Take Care
SKY

Wyckoff Accumulation Completed?I'm thinking that the test just completed for ETH per wyckoff's accumulation schematic, it should now do a test of remaining supply and then move up to 4210-4240 and oscillate up and down for awhile then to first target of 4297 and 4547 as a second possible target.
Wyckoff points marked

Ascending channel, symmetrical triangleEthereum on the dayli chart is trading in a ascending channel and a symmetrical triangle.
Key support of the channel and symmetrical triangle is at 4400 when a break above 4750 would mean a confirmed breakout of the symmetrical triangle with a target around 5700
Ethereum is also still trading above the 50 rsi wich means there is still bullish momentum.
The massive insitutional investments and the rate cuts could send ethereum to $10.000 in Q4
