ETHUSD NEW OUTLOOK According to H1 analysis ETHUSD market is running in selling pressure from last two day now market will be touch the RESISTANCE LEVEL then it will be falling more so be carefull use money management
TRADE AT YOUR OWN RISK
REGARD ALBERET
ETHWAVAX_1ACF15.USD trade ideas

ETH/USD – Major Breakdown, Heavy Sell Pressure🔴 SHORT under $4,200 – target $4,083
Ethereum trades at $4,171, deeply under SMA200 ($4,435). Resistance: $4,500, support: $4,083. RSI at 28, oversold, but sellers remain dominant.
📖 Keywords: #ETHUSD #Ethereum #CryptoCrash #AltcoinSelling

ETH: Short-Term Retracement, Long-Term BullishAfter a strong upward rally, ETH’s price is currently in a phase of retracement and consolidation. Short-term upward momentum has weakened somewhat, leaving it under pressure to pull back. However, the MA20 and MA60 continue to maintain a solid upward trend, providing medium-term support for the price. That said, the MACD histogram has shown short-term contraction, indicating a slowdown in the upward momentum.
Overall, ETH’s price action today is characterized by short-term retracement but sustained upward potential in the medium to long term.
Nevertheless, the cryptocurrency market is highly volatile, so investors should closely monitor market developments and relevant news to adjust their investment strategies in a timely manner

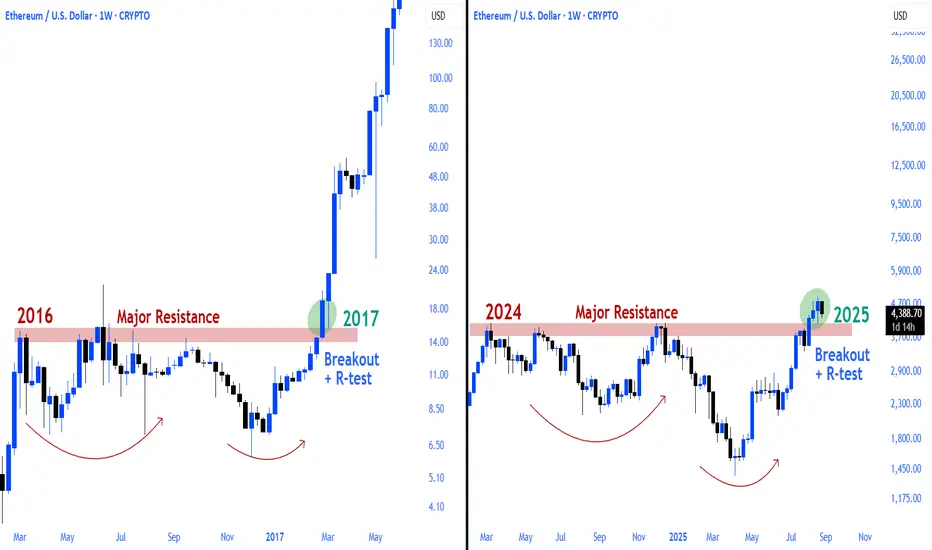
Ethereum Finally Clears Path Towards $5,000+Should Ethereum maintain support above $4,245 over the next few days, it should solidify its intention for a run above $5,000 by mid-late October.
Plenty of bears await the arrival.

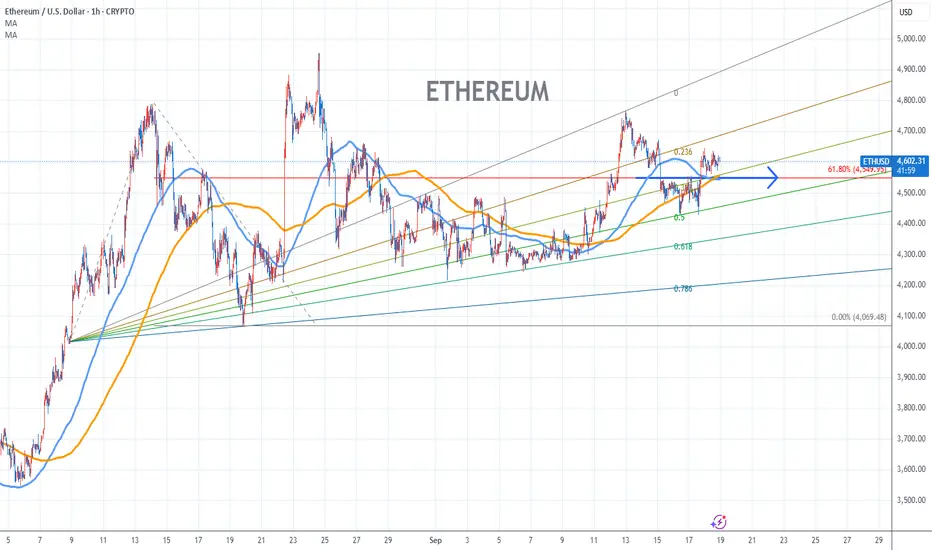
Ethereum Chart Fibonacci Analysis 091825Trading Idea
1) Find a FIBO slingshot
2) Check FIBO 61.80% level
3) Entry Point > 4551/61.80%
Chart time frame:B
A) 15 min(1W-3M)
B) 1 hr(3M-6M)
C) 4 hr(6M-1year)
D) 1 day(1-3years)
Stock progress:A
A) Keep rising over 61.80% resistance
B) 61.80% resistance
C) 61.80% support
D) Hit the bottom
E) Hit the top
Stocks rise as they rise from support and fall from resistance. Our goal is to find a low support point and enter. It can be referred to as buying at the pullback point. The pullback point can be found with a Fibonacci extension of 61.80%. This is a step to find an entry-level position. 1) Find a triangle (Fibonacci Speed Fan Line) that connects the high (resistance) and low (support) points of the stock in progress, where it is continuously expressed as a Slingshot, 2) and create a Fibonacci extension level for the first rising wave from the start point of the slingshot pattern.
When the current price goes over the 61.80% level, that can be a good entry point, especially if the SMA 100 and 200 curves are gathered together at 61.80%, it is a very good entry point.
As a great help, TradingView provides these Fibonacci speed fan lines and extension levels with ease. So if you use the Fibonacci fan line, the extension level, and the SMA 100/200 curve well, you can find an entry point for the stock market. At least you have to enter at this low point to avoid trading failure, and if you are skilled at entering this low point, with the fibonacci6180 technique, your reading skill of to chart will be greatly improved.
If you want to do day trading, please set the time frame to 5 minutes or 15 minutes, and you will see many of the low points of rising stocks.
If you prefer long-term range trading, you can set the time frame to 1 hr or 1 day
ETHUSD-BULLISH POTENTIAL ZONEETHUSD could reverse its trend to bullish as it has formed bullish harmonic AB=CD pattren with a bullish divergence at major daily support use buy stop for the entry.

ETH | New all time highs in sight Strategy: Impulse Correction
Direction: Bullish
Moving Average: Blue above Red
Fib Retracement: 38.2 reached
MACD > 0
1st Target = 4955
2nd Target = 5350
3rd Target = 5859
Entry: 4614
SL: 4300
Trade 7/20

Ethereum Triangle Breakout Trap – Bear Market FocusEthereum (ETHUSD) has formed a symmetrical triangle pattern, but an early breakout has already taken place before the structure was fully completed. Historically, such premature breakouts during the end phase of a crypto cycle often hint towards a bearish trend continuation.
Looking at past bear market cycles, there is a possibility that Ethereum could enter a deeper corrective phase in 2026, aligning with historical crypto market patterns. The key support zones to watch remain at $3000, $2300, and $1800, which could act as major levels in the upcoming months.
On the upside, Ethereum faces strong resistance between $4700 and $4900, where short setups become more favorable. For risk management, a stop loss above $5200 is recommended. Long positions have already been closed, and the focus now shifts towards short opportunities at resistance zones.
📌 This setup provides a clear risk-reward strategy for traders who are closely monitoring ETH price action in relation to cycle completion and historical bear market patterns.
👉 Follow me on TradingView for more crypto market insights, technical analysis, and trading updates. Share your thoughts in the comments – your feedback helps shape future analysis!

ESG & Carbon Credit Trading: A Deep Dive1. Introduction: Why ESG & Carbon Markets Matter Today
In the 21st century, the financial system is no longer only about profits, balance sheets, and shareholder returns. The world is facing an existential challenge: climate change. Rising global temperatures, extreme weather events, biodiversity loss, and resource scarcity have shifted the priorities of governments, businesses, and investors alike. In this context, Environmental, Social, and Governance (ESG) principles and carbon credit trading systems have emerged as critical tools to align finance with sustainability.
Together, they represent the intersection of markets, ethics, and the planet’s survival. ESG provides a holistic framework for evaluating the sustainability of businesses, while carbon credits create a market-based mechanism to reduce greenhouse gas (GHG) emissions.
This essay explores both domains in depth, showing how they interconnect, why they are important, and where they are headed in the future.
2. Understanding ESG
2.1 What ESG Means
ESG stands for Environmental, Social, and Governance – a framework that evaluates companies not just by financial performance, but by how responsibly they operate in the broader ecosystem.
Environmental: How does a company manage its carbon footprint, energy efficiency, waste, water, and natural resource use?
Social: How does it treat employees, customers, suppliers, and communities? Does it promote diversity, inclusion, and human rights?
Governance: How transparent and accountable is its leadership? Does it avoid corruption, insider trading, and unethical practices?
2.2 Evolution of ESG Investing
Originally, sustainability efforts were often seen as “corporate social responsibility” (CSR) or philanthropy. However, investors realized that ESG risks – such as climate regulations, supply chain disruptions, or governance scandals – can directly affect profits and valuations.
By the 2000s, ESG investing became mainstream, with large institutional investors like BlackRock and Vanguard demanding ESG disclosures. Today, ESG funds manage trillions of dollars globally, and regulators like the EU require mandatory ESG reporting.
2.3 Why ESG Matters
It reduces risks from climate laws, carbon taxes, and lawsuits.
It enhances brand value and consumer trust.
It attracts ESG-focused investors.
It ensures long-term sustainability, not just short-term profit.
3. Carbon Credits & Carbon Markets
3.1 What Are Carbon Credits?
A carbon credit represents the right to emit one metric ton of carbon dioxide (CO₂) or equivalent greenhouse gases. Companies buy or earn credits to offset their emissions.
3.2 Compliance vs. Voluntary Markets
Compliance Markets: Governments cap emissions and issue allowances. Companies must buy credits if they exceed their limits. (Example: EU Emissions Trading System).
Voluntary Markets: Businesses or individuals buy credits voluntarily to offset their footprint (e.g., airlines offering “carbon-neutral flights”).
3.3 Cap-and-Trade vs. Carbon Offsets
Cap-and-Trade: A government sets a cap on total emissions. Companies exceeding their cap must buy credits from those with extra allowances.
Offsets: Companies can fund external projects (like reforestation, renewable energy) to earn credits.
3.4 Pricing Mechanisms
Carbon credit prices vary widely:
EU ETS: €60–100 per ton (highly regulated).
Voluntary markets: $2–20 per ton (depending on project quality).
4. How ESG & Carbon Credit Trading Interconnect
ESG is a broad sustainability framework, and carbon credits are one of the most measurable tools within it.
For Corporates: Buying carbon credits improves their ESG score by reducing net emissions.
For Investors: ESG funds often favor companies engaged in carbon markets.
For Regulators: ESG disclosures increasingly include carbon credit purchases and emission offsets.
In essence, carbon credits are the financial “currency” of the environmental pillar of ESG.
5. Global Landscape of Carbon Credit Trading
5.1 Europe – EU Emissions Trading System (ETS)
The EU ETS is the largest and most advanced carbon market in the world. Launched in 2005, it covers power plants, industries, and airlines. It operates under a cap-and-trade system and sets the benchmark for global carbon pricing.
5.2 United States
There is no federal carbon market, but regional initiatives exist:
California Cap-and-Trade Program
Regional Greenhouse Gas Initiative (RGGI) in northeastern states
5.3 China
China launched the world’s largest carbon market in 2021, covering its power sector. Given China’s size, this market has potential to redefine global carbon pricing.
5.4 India & Asia
India has introduced a Carbon Credit Trading Scheme (CCTS) in 2023, aiming to integrate renewable energy projects and industry compliance. Japan and South Korea also run emissions trading systems.
5.5 Voluntary Carbon Markets (VCMs)
VCMs are growing rapidly, driven by corporate net-zero pledges. Platforms like Verra and Gold Standard certify offset projects, from forest conservation to clean cookstoves in Africa.
6. Opportunities & Benefits
6.1 For Corporates
Achieve net-zero targets.
Enhance ESG ratings.
Gain competitive advantage by marketing carbon-neutral products.
6.2 For Investors
Access to ESG-themed ETFs, green bonds, and carbon funds.
Hedge against climate-related risks.
6.3 For Governments
Generate revenue from carbon taxes and auctions.
Meet Paris Agreement targets.
6.4 For Communities
Reforestation and renewable projects bring jobs, energy access, and biodiversity protection.
Carbon finance helps developing nations grow sustainably.
7. Challenges & Criticisms
7.1 Greenwashing Risks
Some companies buy cheap credits instead of reducing real emissions, creating a “pay-to-pollute” system.
7.2 Lack of Standardization
Different countries and agencies certify credits differently, leading to trust issues.
7.3 Price Volatility
Carbon prices can fluctuate widely, reducing market stability.
7.4 Ethical Concerns
Projects in poorer countries may displace communities or fail to deliver promised benefits.
8. Technology & Innovation in Carbon Markets
Blockchain: Ensures transparency and prevents double-counting of credits.
AI & Big Data: Improve ESG ratings and carbon accounting accuracy.
Tokenization: Carbon credits can be turned into digital assets for trading on exchanges.
IoT & Satellites: Verify carbon sequestration in forests or farms.
9. Case Studies
9.1 Tesla
Tesla earned billions by selling carbon credits to traditional automakers who failed to meet emission targets.
9.2 Indian Renewable Energy Projects
Solar and wind farms in India generate certified credits, which are sold internationally.
9.3 Amazon’s Climate Pledge
Amazon invests in carbon offsets like reforestation and carbon removal technologies to fulfill its 2040 net-zero pledge.
10. Future Outlook
Net Zero by 2050: Countries and corporations are setting binding targets, boosting credit demand.
Integration of ESG & Carbon Markets: ESG disclosures will increasingly require detailed carbon offset data.
Rise of Nature-Based Solutions: Forests, wetlands, and agriculture will dominate offset markets.
Global Carbon Price Convergence: Over time, voluntary and compliance markets may merge into a unified global framework.
11. Conclusion
ESG and Carbon Credit Trading are two sides of the same coin. ESG provides the lens through which businesses are judged on sustainability, while carbon credits provide the currency that enables emission reductions to be quantified, traded, and scaled.
However, challenges remain – greenwashing, standardization, and pricing uncertainty. For ESG and carbon markets to fulfill their promise, they must evolve with stronger regulations, technological innovations, and genuine corporate accountability.
In the future, ESG and carbon credits will not remain “add-ons” to business strategy – they will be at the core of financial systems, investment portfolios, and trade. The global economy is slowly transforming into one where sustainability is not optional, but essential.

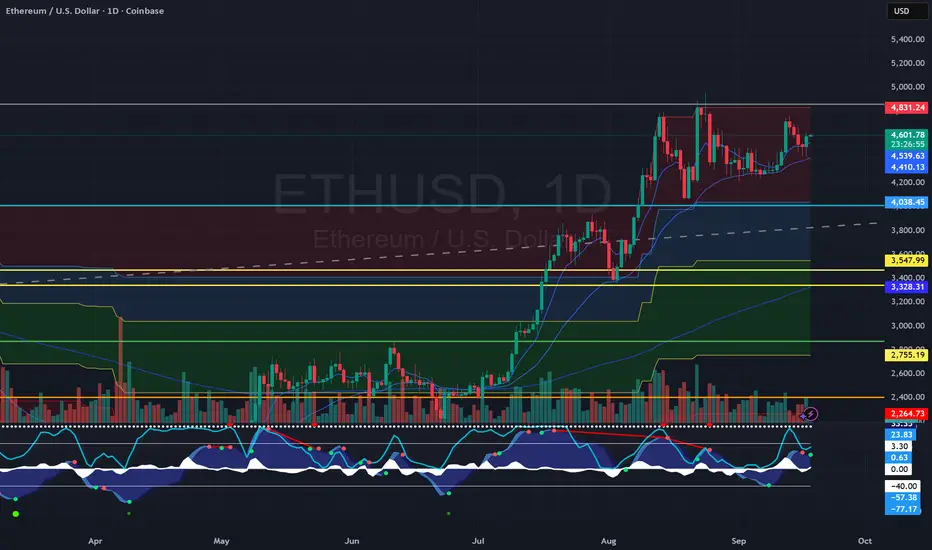
ETHUSD key trading level at 4,100The ETHUSD remains in a bullish trend, with recent price action showing signs of a corrective pullback within the broader uptrend.
Support Zone: 4,100 – a key level from previous consolidation. Price is currently testing or approaching this level.
A bullish rebound from 4,100 would confirm ongoing upside momentum, with potential targets at:
4,450 – initial resistance
4,730 – psychological and structural level
5,070 – extended resistance on the longer-term chart
Bearish Scenario:
A confirmed break and daily close below 4,100 would weaken the bullish outlook and suggest deeper downside risk toward:
3,990 – minor support
3,830 – stronger support and potential demand zone
Outlook:
Bullish bias remains intact while the ETHUSD holds above 4,100. A sustained break below this level could shift momentum to the downside in the short term.
This communication is for informational purposes only and should not be viewed as any form of recommendation as to a particular course of action or as investment advice. It is not intended as an offer or solicitation for the purchase or sale of any financial instrument or as an official confirmation of any transaction. Opinions, estimates and assumptions expressed herein are made as of the date of this communication and are subject to change without notice. This communication has been prepared based upon information, including market prices, data and other information, believed to be reliable; however, Trade Nation does not warrant its completeness or accuracy. All market prices and market data contained in or attached to this communication are indicative and subject to change without notice.

$ETHUSD daily tfEtherium CRYPTOCAP:ETH going to 5700+ the next couple of weeks? placing bets on $BMNR.

ETH LONG RESULT Ethereum price held the support over and repeatedly from which I took the long position to the upside and it moved just as predicted
_THE_KLASSIC_TRADER_.💪🔥

Ethereum Cup-and-Handle Points to $5,430BINANCE:ETHUSD price is trading under $4,600, up 2.2% in the past 24 hours. On the charts, BINANCE:ETHUSD has formed a clear cup-and-handle setup, one of the strongest bullish patterns. A daily close above the neckline at $4,765 would confirm the breakout and set a target near $5,430 — about 17% higher from current levels.
The setup works by measuring the distance from the “cup” bottom to the neckline and projecting it upward. In Ethereum’s case, that move points directly toward $5,430, which would mark a new high for the year.
Support sits at $4,489 and $4,424, both levels tested during the handle formation. A drop under $4,213 would break the pattern and cancel the bullish view.
Another confirmation comes from the Chaikin Money Flow (CMF), which tracks buying pressure. CMF has risen sharply from –0.18 on September 15 and is now close to turning positive. If it crosses above zero, it would show that new money is entering alongside the breakout, giving more power to the move.

Trendline BreakThe price has broken out of a bearish trendline followed by a pullback, now the price looks to make a higher high and continue long
WE ONLY TRADE PULLBACKS
Comment your thoughts

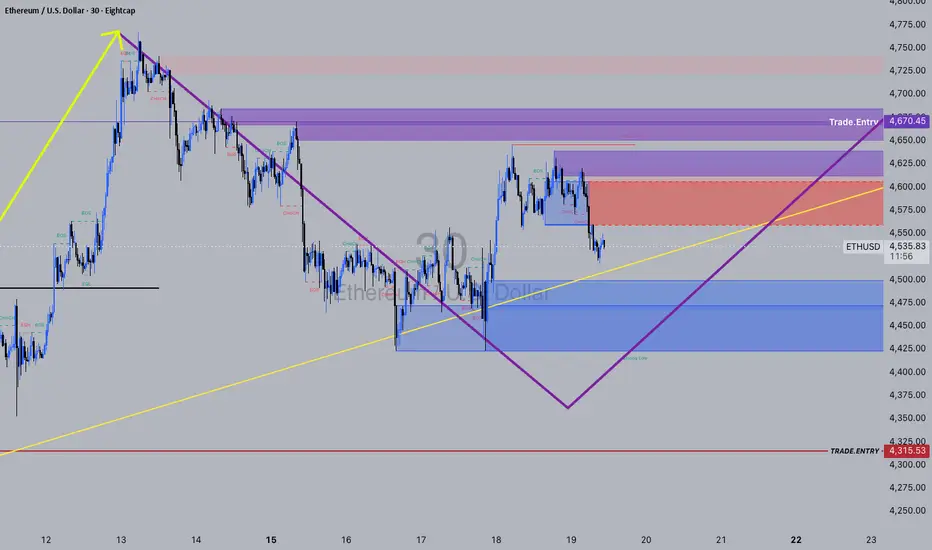
ETH_my_idea_until_Novemberso this is my view on ETH, yes its the m30, as the refined zone for the Daily and H4
from here i believe we can slowly build that long hold into November
we might get some fake outs and some liqi grabs, as this Daily zone is fairly big;
Lets see what big news and ETF's drives it
Ethereum Tests Key Support at $4,535FenzoFx—Ethereum’s downtrend eased after hitting the bullish breaker at $4,425.00. It currently trades near $4,540.00, down 1.00% today. Immediate support lies at $4,535.00. A close below this level could extend the decline toward the equal lows at $4,425.00 and possibly $4,240.00.
The bearish outlook remains unless Ethereum exceeds $4,700.00 and closes above the bearish fair value gap.

ETHEREUM (ETHUSD): Bullish Trend Continues
I see a nice bullish confirmation on Ethereum after a recent pullback.
The price formed a double bottom pattern and violated its neckline
and a resistance line of a falling wedge pattern.
With a high probability, the market will go up.
Goal - 4741
❤️Please, support my work with like, thank you!❤️
I am part of Trade Nation's Influencer program and receive a monthly fee for using their TradingView charts in my analysis.


ETH Cup and Handle on the DailyI think ETH is about to complete a Cup and Handle on the daily timeframe. What do you think?
ETHUSD-BULLISH IDEAETHUSD has shown good bullish potential as it's making harmonic AB=CD bullish pattren as it retraced to 0.5-0.6 fib level and made a bullish divergence.

ETHEREUM POSSIBLE NEXT MOVEETHUSD
price break above the 4hr resistance after a long time consolidation
the resistance has been tested so lets long for buying opportunity

Milad//@version=5
indicator("EMA + RSI Strategy", overlay=true)
// تنظیمات
emaShort = input.int(7, "EMA کوتاه")
emaMid = input.int(50, "EMA میان")
emaLong = input.int(100, "EMA بلند")
rsiLength = input.int(14, "RSI Length")
// محاسبه EMA ها
emaS = ta.ema(close, emaShort)
emaM = ta.ema(close, emaMid)
emaL = ta.ema(close, emaLong)
// محاسبه RSI
rsi = ta.rsi(close, rsiLength)
// شرایط خرید و فروش
buySignal = (emaS > emaM and emaS > emaL and rsi > 50)
sellSignal = (emaS < emaM and emaS < emaL and rsi < 50)
// نمایش EMA ها
plot(emaS, color=color.yellow, title="EMA Short")
plot(emaM, color=color.blue, title="EMA Mid")
plot(emaL, color=color.red, title="EMA Long")
// سیگنال روی چارت
plotshape(buySignal, title="Buy Signal", location=location.belowbar, color=color.green, style=shape.labelup, text="BUY")
plotshape(sellSignal, title="Sell Signal", location=location.abovebar, color=color.red, style=shape.labeldown, text="SELL")
