Milad//@version=5
indicator("EMA + RSI Strategy", overlay=true)
// تنظیمات
emaShort = input.int(7, "EMA کوتاه")
emaMid = input.int(50, "EMA میان")
emaLong = input.int(100, "EMA بلند")
rsiLength = input.int(14, "RSI Length")
// محاسبه EMA ها
emaS = ta.ema(close, emaShort)
emaM = ta.ema(close, emaMid)
emaL = ta.ema(close, emaLong)
// محاسبه RSI
rsi = ta.rsi(close, rsiLength)
// شرایط خرید و فروش
buySignal = (emaS > emaM and emaS > emaL and rsi > 50)
sellSignal = (emaS < emaM and emaS < emaL and rsi < 50)
// نمایش EMA ها
plot(emaS, color=color.yellow, title="EMA Short")
plot(emaM, color=color.blue, title="EMA Mid")
plot(emaL, color=color.red, title="EMA Long")
// سیگنال روی چارت
plotshape(buySignal, title="Buy Signal", location=location.belowbar, color=color.green, style=shape.labelup, text="BUY")
plotshape(sellSignal, title="Sell Signal", location=location.abovebar, color=color.red, style=shape.labeldown, text="SELL")
ETHWAVAX_1ACF15.USD trade ideas

ETHUSDT watch well BINANCE:ETHUSD
watch breaking this resistance level, after that new era is starting for BINANCE:ETHUSD

ETH/USD — Elliott Wave Setup Points to $6K or Breakdown at $4400Ethereum is trading near $4308, consolidating just below heavy resistance at $4400–$4600. Order book heatmaps show massive liquidity stacked here, while support thins around $3800–$4000. A break above could trigger a large-scale short squeeze — nearly $13.22B in shorts sit at risk around $4700.
Wave Structure
• Wave iii peaked at $4612 (78.6% Fib).
• Wave iv bottomed at $4061 (23.6% Fib).
• Next extension targets: $5233, $5815, $6406.
• Long-term Fibonacci extension: $6922.
Funding & Sentiment
Funding rates have normalized after swinging negative in September. Neutral positioning reflects market indecision: breakout or deeper retrace.
Key Levels
• Resistance: 4400–4600, 4700, 5233, 5815
• Support: 4061, 3800, 3665–3374
Trading Plan
📈 Long above 4600 → Targets: 4700 / 5233 / 5815 (SL 4300)
📉 Short below 4060 → Targets: 3800 / 3665 (SL 4220)

ETHUSD - Pullback doneETHUSD just completed a Head and Shoulders pattern.
Bearish volume has been diminishing as the pattern is unfolding, which is an indication that the pattern is likely a reversal in trend.
The breakout of the neckline occurred with a strong bullish volume.
ETHUSD should reach 5000

Eth for TPCRYPTOCAP:ETH in range as of late, nicely playing since…
Looks to be on way, just needs a breach on recent high and we should be seeing this through!!!!!
Lassgooo!!!!
🔪💨

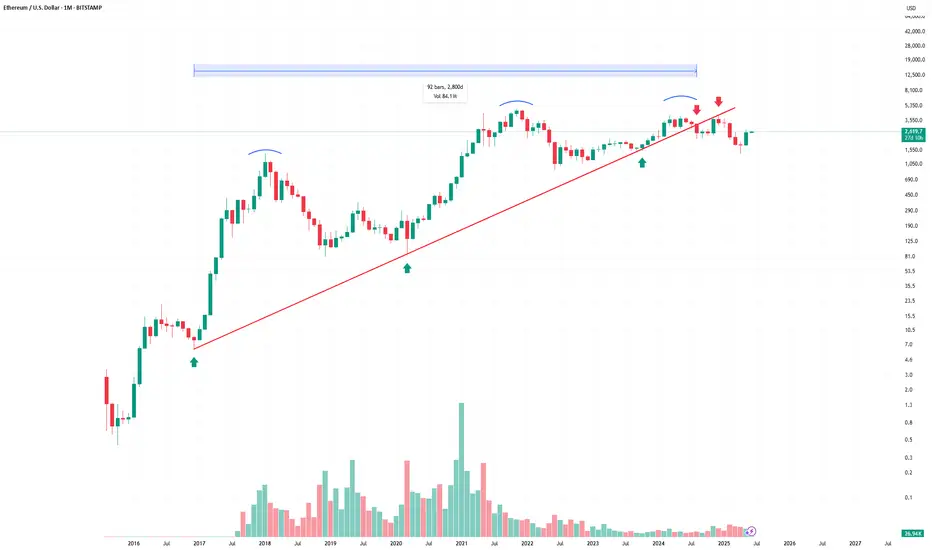
This is why I don't buy Ethereum.This chart shows a clear loss of momentum after a long-term uptrend.
The trendline supported the price for years, confirmed multiple times (green arrows).
Price broke below the trendline and failed to reclaim it (red arrows = rejection).
We're seeing a potential triple top pattern with lower highs (blue curves), a classic distribution signal.
📉 Last candle confirms breakdown structure — lower highs, and now lower lows.
I'm not saying ETH is dead.
But for me, this is not a buy.
Until it reclaims the trendline or shows true strength with a breakout and volume, I'm staying out.
Thanks For Reading.
ETH/USD eyeing H&S top profit objective!From the daily price of ETH/USD (Ethereum versus the US dollar), price recently engulfed the neckline of a head and shoulders top pattern (extended from the low of US$4,060). Subsequently, it retested the underside of resistance at US$4,217. Should the unit hold resistance, further selling towards the head and shoulders pattern profit objective at US$3,609 could be seen.
FP Markets Research Team

Ethereum Pulls Back After Liquidity TapFenzoFx—Ethereum tapped liquidity above the equal highs at $4,233.00 and now trades around $4,190.0, down 0.60% today. Despite the move, the volume profile didn’t form a new high, signaling bearish bias.
Immediate support lies at $4,130.0. A close below this level may trigger further downside toward $4,034.0. If selling pressure continues, ETH could decline to the recent lows at $3,825.0. The bearish outlook remains valid below $4,250.0, which must be breached and held to invalidate it.

Differences Between Forwards and Futures Trading Introduction
In the vast landscape of financial markets, risk management and speculation are two of the most important forces driving investment strategies. Businesses, investors, and institutions constantly seek instruments that help them manage uncertainty while simultaneously creating opportunities to generate returns. Among the most prominent tools that serve this purpose are derivative contracts.
Derivatives are financial instruments whose value is derived from an underlying asset, such as stocks, bonds, commodities, currencies, or indices. Among the many types of derivatives—options, swaps, forwards, and futures—the last two hold a particularly important place in global finance.
At first glance, forwards and futures contracts appear to be similar: both are agreements to buy or sell an asset at a predetermined price at a specific date in the future. However, the structural and functional differences between the two are significant, and these distinctions make them suitable for different participants, use cases, and risk preferences.
This discussion will dive deep into the key differences between forwards and futures, exploring their characteristics, market structure, risk implications, advantages, disadvantages, and practical applications. By the end, you’ll have a clear understanding not only of the technical differences but also of the strategic role each plays in the global financial ecosystem.
What Are Forwards?
A forward contract is a customized, over-the-counter (OTC) agreement between two parties to buy or sell an asset at a specified price on a future date.
Key features:
Customization: Forwards are tailor-made. Parties can set their own contract size, settlement date, price, and terms.
OTC nature: They are not traded on an exchange. Instead, they are private agreements negotiated directly between buyer and seller.
No daily settlement: Payment occurs only at maturity, not daily.
Credit risk exposure: Since forwards are private deals, there is a chance that one party may default.
Use case: Businesses often use forwards to hedge against price fluctuations in commodities, foreign exchange, or interest rates.
Example:
A wheat farmer in India expects to harvest 100 tons of wheat in six months. To protect against price drops, he enters into a forward contract with a flour mill, agreeing to sell the wheat at ₹20,000 per ton six months later. Regardless of the market price at that time, both parties are bound to honor this deal.
What Are Futures?
A futures contract is a standardized agreement traded on an organized exchange to buy or sell an asset at a specific price on a future date.
Key features:
Standardization: Futures contracts have fixed sizes, maturity dates, and specifications set by the exchange.
Exchange-traded: They are traded on regulated exchanges (e.g., CME, NSE, BSE, ICE).
Daily settlement (mark-to-market): Gains and losses are settled daily. This reduces the risk of large defaults.
Margin requirements: Both buyer and seller must deposit an initial margin with the exchange and maintain variation margin based on daily fluctuations.
Liquidity and transparency: Since they are exchange-traded, futures are more liquid and transparent compared to forwards.
Example:
A trader buys a crude oil futures contract on the NYMEX at $80 per barrel for delivery in three months. If oil prices rise to $90, the trader profits; if prices fall to $70, the trader incurs losses. Daily mark-to-market ensures gains/losses are credited or debited every trading day.
Key Differences Between Forwards and Futures
Let’s break down the main differences across multiple dimensions:
1. Market Structure
Forwards: OTC contracts; negotiated privately.
Futures: Exchange-traded; standardized terms.
Implication: Futures benefit from regulatory oversight and liquidity, while forwards offer customization.
2. Contract Customization
Forwards: Fully customizable (quantity, price, asset quality, settlement date).
Futures: Standardized by exchange (fixed contract sizes, expiry dates, asset quality).
Implication: Corporates prefer forwards for precise hedging; traders prefer futures for liquidity.
3. Settlement Mechanism
Forwards: Settled at maturity (physical delivery or cash).
Futures: Daily mark-to-market settlement.
Implication: Futures reduce credit exposure through daily margining; forwards concentrate risk until maturity.
4. Counterparty Risk
Forwards: Exposed to counterparty default.
Futures: Exchange clearinghouse guarantees contracts.
Implication: Futures are safer for retail and institutional traders, while forwards may expose businesses to greater risk.
5. Liquidity
Forwards: Lower liquidity; contracts are unique.
Futures: High liquidity due to standardized contracts and active trading.
Implication: Futures are better for short-term speculation; forwards suit long-term hedging.
6. Regulation
Forwards: Lightly regulated; depends on private agreements.
Futures: Heavily regulated by exchanges and regulators (e.g., SEBI in India, CFTC in the U.S.).
7. Pricing Transparency
Forwards: Pricing is opaque; available only to contract parties.
Futures: Prices are publicly available in real time.
8. Settlement Type
Forwards: Usually physical settlement.
Futures: Can be cash-settled or physically delivered.
9. Participants
Forwards: Mostly corporates, banks, and institutions.
Futures: Retail traders, speculators, hedgers, and arbitrageurs.
10. Maturity
Forwards: Any date, based on parties’ agreement.
Futures: Fixed maturity dates (monthly, quarterly).
11. Default Risk Mitigation
Forwards: No default protection; depends on trust.
Futures: Clearinghouse acts as counterparty to all trades, ensuring default protection.
12. Cost Structure
Forwards: No upfront margin; but risk exposure exists.
Futures: Require margin deposits and daily variation margins.
13. Flexibility vs. Accessibility
Forwards: High flexibility, low accessibility for retail traders.
Futures: Lower flexibility, higher accessibility due to exchanges.
14. Speculative vs. Hedging Use
Forwards: Primarily hedging.
Futures: Both hedging and speculation.
Practical Examples
Commodity Hedging
Airline companies use forwards to lock in jet fuel prices with suppliers.
Traders use crude oil futures to speculate on price movements.
Currency Hedging
Exporters sign forward contracts with banks to lock in foreign exchange rates.
Speculators trade currency futures on exchanges like CME or NSE.
Interest Rate Management
Corporates use interest rate forwards with banks.
Traders hedge with interest rate futures on treasury bonds.
Advantages and Disadvantages
Forwards
Advantages:
Tailored contracts.
Useful for corporate risk management.
Disadvantages:
Illiquid.
High counterparty risk.
Lack of transparency.
Futures
Advantages:
Standardized and liquid.
Regulated and transparent.
Reduced counterparty risk via clearinghouses.
Disadvantages:
Less customization.
Margin requirements can be costly.
Mark-to-market can cause cash flow volatility.
Applications in Trading and Risk Management
Corporates: Use forwards for precise hedging.
Retail Traders: Use futures for speculation and short-term trades.
Institutions: Use futures for portfolio hedging, arbitrage, and diversification.
Regulatory Aspects
Forwards: Governed by contract law, not heavily regulated.
Futures: Regulated by government authorities and exchanges to ensure fair trading and reduce systemic risk.
Impact on Market Participants
Hedgers: Prefer forwards for customization; futures for liquidity.
Speculators: Prefer futures for leverage and ease of entry.
Arbitrageurs: Futures allow arbitrage between spot and derivatives markets.
Conclusion
Though forwards and futures may seem like two sides of the same coin, their structural differences shape how they are used in practice. Forwards provide flexibility and tailored solutions, making them valuable for corporates with specific hedging needs. Futures, on the other hand, offer standardization, transparency, and reduced risk, making them ideal for traders, institutions, and investors seeking liquidity and safety.
In essence, forwards are personal contracts, while futures are public contracts. Each has its place in the financial ecosystem, and the choice between the two depends on the needs, risk appetite, and market participation style of the user.
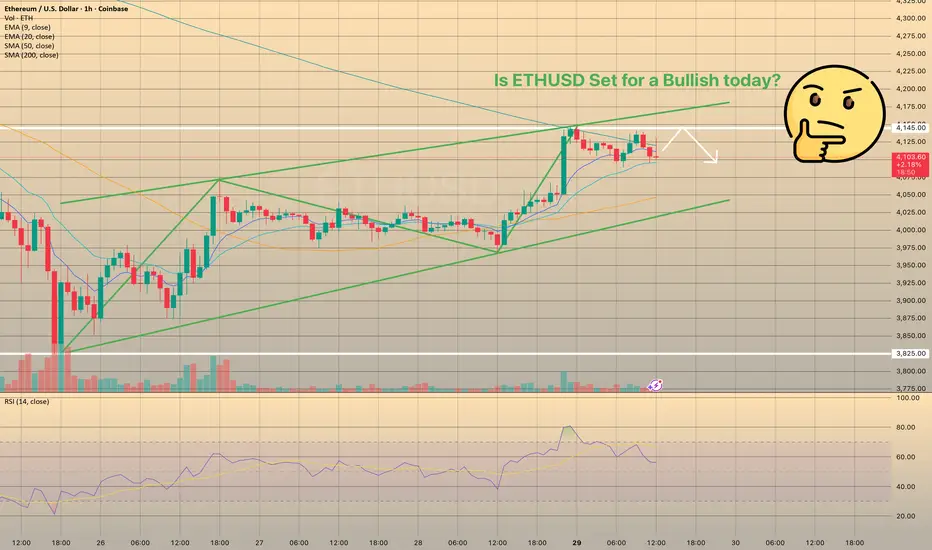
Ethereum outflows point to bullish setup above $4KEthereum outflows point to bullish setup above $4K
Altcoins are surging, and Ethereum has reclaimed the spotlight after crossing the key $4,000 mark. Trading volume is rising, and ETH is holding steady near $4,100 after a relatively calm weekend, suggesting stability following last week’s volatility. Analysts view $4,000 as a crucial support level—if bulls defend it, ETH could soon retest higher levels.
One factor supporting this outlook is a steady decline in Ethereum balances on spot exchanges. A CryptoQuant report shows coins are being withdrawn into self-custody and staking, reducing sell-side liquidity. Historically, such outflows have set the stage for rallies as demand absorbs limited supply.
Short positioning also adds fuel: more than $11 billion in shorts could be forced to cover if ETH breaks above $4,200, potentially accelerating gains.
Still, analysts warn that supply constraints alone aren’t enough—strong buyer inflows are needed to sustain momentum. The next few days will be key, with ETH’s ability to hold above $4,000 serving as a test for the next leg of the rally.
Weak Spot Demand Threatens $4,000 SupportETH/USD is showing signs of fragility as spot market participation weakens. Since September 12, the On-Balance Volume (OBV) indicator has trended downward, highlighting fading buyer demand in the market.
The OBV measures cumulative trading volume by adding volume on bullish days and subtracting it on bearish days. A rising OBV typically reflects strong buyer momentum driving prices higher, while a decline suggests that sellers are gaining the upper hand.
With ETH’s OBV steadily falling, it signals that selling pressure currently outweighs buying activity. This imbalance amplifies downside risks and raises concerns about whether Ethereum can maintain support above the critical $4,000 level in the coming weeks.

ETHUSD: Local Bearish Bias! Short!
My dear friends,
Today we will analyse ETHUSD together☺️
The market is at an inflection zone and price has now reached an area around 3,980.1 where previous reversals or breakouts have occurred.And a price reaction that we are seeing on multiple timeframes here could signal the next move down so we can enter on confirmation, and target the next key level of 3,969.3.Stop-loss is recommended beyond the inflection zone.
❤️Sending you lots of Love and Hugs❤️

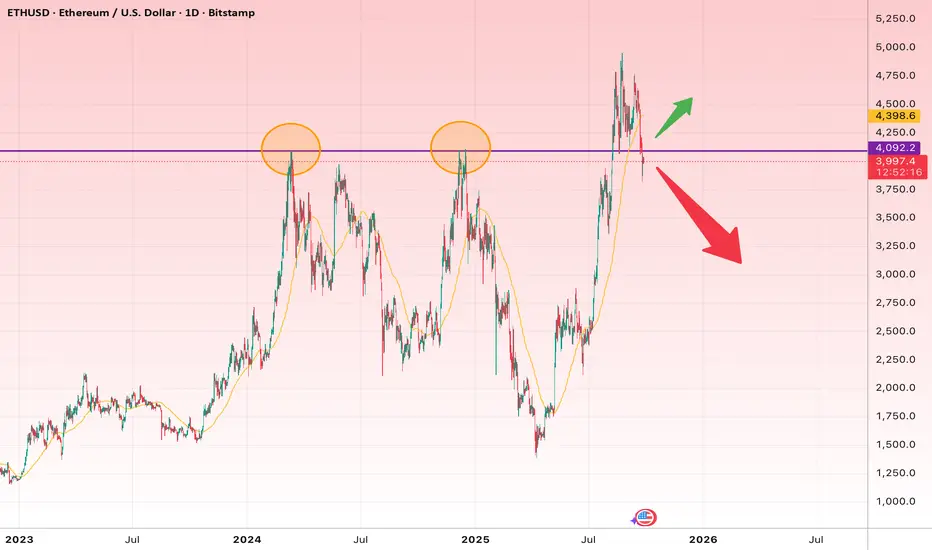
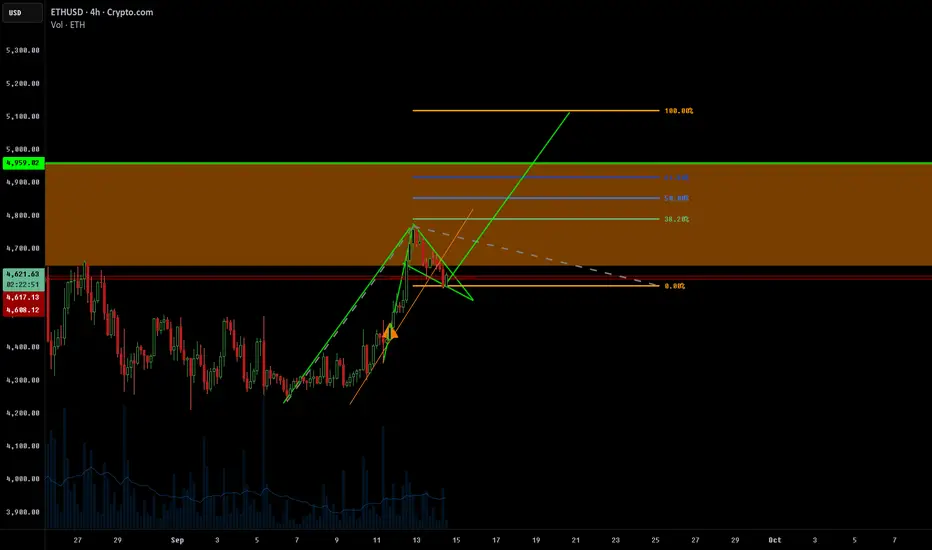
Ethereum at a Historical Crossroads: Breakout or Major Rejection
Based on the ETH/USD daily chart you shared, here’s a professional breakdown:
🔎 Technical Overview
Key Level: $4,000 – $4,100
This zone is a multi-year resistance (price was rejected here twice before → double top).
Currently, price is sitting just below this line — a true decision point.
Pattern Outlook
A confirmed breakout above $4,100 could open the way for a strong bullish rally.
A rejection here could trigger a deep correction, similar to the past two times.
100-Day Moving Average
Acting as dynamic mid-term support. A clean break below it would be a strong bearish signal.
📈 Short-Term Outlook (1–3 weeks)
Bullish Scenario:
Break and daily close above $4,100–$4,200 → Target 1: $4,500, Target 2: $4,850.
Stop-loss: Daily close below $3,900.
Bearish Scenario:
Rejection and breakdown below $3,850 → Target 1: $3,400, Target 2: $3,000.
Stop-loss: Daily close above $4,150.
📊 Long-Term Outlook (3–9 months)
Bullish (if resistance breaks):
Mid-term targets: $5,250 (next historical peak) → then potentially $6,000–$6,500 if momentum continues.
Stop-loss: Sustained close below $3,400.
Bearish (if resistance holds):
Likely correction towards $2,750–$3,000.
In a broader market downturn, a retest of $2,200–$2,400 is also possible.
⚠️ Key Takeaway: Price is sitting at a critical resistance zone. Risk management is crucial — trading without a stop-loss here could be dangerous.
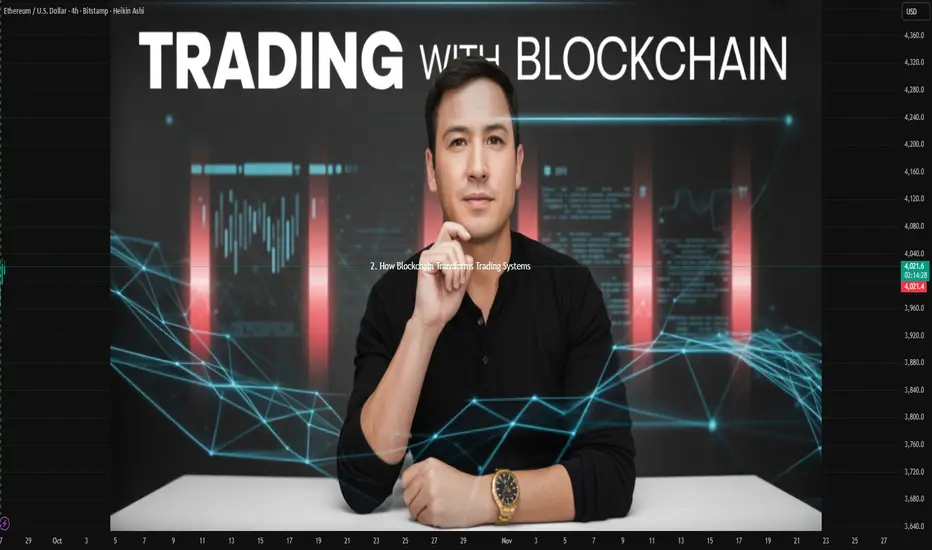
How Blockchain Transforms Trading Systems1. Understanding Blockchain: The Foundation
Before analyzing its impact on trading, it is important to understand what blockchain is:
Decentralization – Traditional trading systems rely on centralized exchanges, brokers, and clearinghouses. Blockchain distributes data across a network of nodes, reducing dependence on single intermediaries.
Immutability – Once a transaction is recorded on a blockchain, it cannot be altered or deleted, providing an incorruptible ledger of trades.
Transparency – Transactions are visible to network participants (depending on whether the chain is public or permissioned), reducing information asymmetry.
Smart Contracts – Self-executing codes stored on the blockchain that automatically perform actions when predefined conditions are met.
Cryptographic Security – Transactions are secured by advanced encryption, minimizing the risks of fraud and cyberattacks.
These characteristics collectively enable blockchain to redefine the architecture of trading systems, moving away from reliance on trust in intermediaries toward trust in code and consensus.
2. Traditional Trading Systems: The Current Limitations
To appreciate blockchain’s transformative role, one must examine the pain points of existing trading infrastructure:
Intermediation Costs – Trades typically involve brokers, exchanges, custodians, clearinghouses, and settlement agencies. Each adds complexity, time, and fees.
Settlement Delays – Equity trades often follow T+2 (trade date + 2 days) settlement cycles, tying up capital and increasing counterparty risk.
Counterparty Risk – Trust in intermediaries is necessary, but systemic failures (e.g., 2008 financial crisis) expose vulnerabilities.
Lack of Transparency – Order books, OTC transactions, and derivative trades are often opaque, leading to information asymmetry and sometimes manipulation.
Cross-Border Complexity – International trades face additional hurdles: currency conversion, regulatory compliance, and time zone mismatches.
Cybersecurity Risks – Centralized exchanges present attractive targets for hackers, as seen in multiple data breaches worldwide.
Blockchain addresses these weaknesses by eliminating redundant intermediaries, accelerating settlement, reducing systemic risk, and ensuring transparent records.
3. Blockchain’s Direct Impact on Trading Systems
3.1 Decentralized Exchanges (DEXs)
Unlike centralized exchanges, DEXs operate on blockchain networks, enabling peer-to-peer trading without intermediaries. Benefits include:
Direct control of funds by traders (custody remains with the owner until trade execution).
Lower fees due to reduced intermediary layers.
Global accessibility with no geographic restrictions.
Examples: Uniswap, SushiSwap, PancakeSwap, which allow crypto token trading without central oversight.
3.2 Tokenization of Assets
Blockchain enables real-world assets (stocks, bonds, real estate, commodities) to be tokenized into digital representations. This leads to:
Fractional ownership – Small investors can own fractions of high-value assets like real estate.
Liquidity creation – Traditionally illiquid assets (art, infrastructure) become tradable in secondary markets.
24/7 markets – Unlike stock exchanges, tokenized assets can trade continuously.
3.3 Instant Settlement and Clearing
Through blockchain, settlement can shift from T+2 to T+0, reducing capital lock-ups and eliminating counterparty risk. Smart contracts automatically transfer ownership and funds simultaneously.
3.4 Increased Transparency
All participants can view transaction history, reducing insider advantages and manipulation risks. Regulators also benefit from real-time auditing capabilities.
3.5 Reduced Costs
By removing brokers, custodians, and clearinghouses, blockchain significantly reduces transaction costs and administrative overhead.
4. Blockchain in Different Asset Classes
4.1 Equities
Tokenized shares on blockchain can be traded peer-to-peer.
Startups like tZERO and Polymath are working on blockchain-based equity issuance and trading.
Companies can issue security tokens directly to investors, bypassing traditional IPO channels.
4.2 Commodities
Commodity trades (gold, oil, agricultural products) can be tracked via blockchain for provenance verification.
Tokenized commodities reduce the need for paper-based contracts and increase liquidity.
4.3 Derivatives
Smart contracts automate execution of options, futures, and swaps.
Margin calls and settlements can be programmed into blockchain, reducing disputes.
4.4 Foreign Exchange
Blockchain-based stablecoins and CBDCs (Central Bank Digital Currencies) allow for instant, low-cost cross-border currency trades.
This disrupts the $6.6 trillion-a-day forex market.
4.5 Real Estate & Alternative Assets
Tokenization enables fractional ownership of properties, infrastructure projects, and private equity.
Platforms like RealT already allow investors to buy tokenized shares in rental properties.
5. Blockchain and Market Infrastructure
5.1 Clearing and Settlement
Traditionally, clearinghouses manage post-trade processes. With blockchain, clearing and settlement occur simultaneously, reducing systemic risks.
5.2 Custody and Record-Keeping
Blockchain acts as a self-updating ledger, replacing third-party custodians. Ownership is cryptographically verifiable.
5.3 Compliance and Regulation
Blockchain enables real-time auditing, AML/KYC compliance, and traceability of funds. Regulators can gain direct access to immutable transaction histories.
5.4 Liquidity Pools
DEXs use automated market makers (AMMs) to create liquidity pools, replacing traditional order books. This enables continuous liquidity provision without centralized intermediaries.
6. Advantages of Blockchain in Trading
Speed – Settlement cycles reduce from days to seconds.
Cost-Efficiency – Lower reliance on intermediaries reduces fees.
Security – Cryptographic protection minimizes fraud and hacks.
Accessibility – Retail traders worldwide can access tokenized markets with just an internet connection.
Transparency – Publicly verifiable ledgers increase trust.
Programmability – Smart contracts enable complex trading strategies to run automatically.
Global Integration – Seamless cross-border trading with digital assets and stablecoins.
7. Challenges and Risks
Despite its promise, blockchain in trading faces hurdles:
7.1 Regulatory Uncertainty
Different jurisdictions classify blockchain assets differently (security, commodity, currency).
Lack of harmonized regulation limits global adoption.
7.2 Scalability Issues
Blockchains like Bitcoin and Ethereum face throughput limitations.
High transaction volumes in equity or forex markets may exceed current blockchain capacities.
7.3 Security Concerns
While blockchain itself is secure, DEXs and smart contracts are vulnerable to hacks and exploits.
Private keys remain a weak point in custody solutions.
7.4 Market Manipulation
Low-liquidity tokens are prone to pump-and-dump schemes.
Automated systems can amplify volatility.
7.5 Integration with Legacy Systems
Traditional financial institutions still run on decades-old infrastructure.
Transitioning to blockchain requires significant time, cost, and cultural change.
8. Case Studies
8.1 ASX (Australian Securities Exchange)
Announced blockchain adoption for clearing and settlement (replacing CHESS).
Although delayed, it reflects serious institutional interest.
8.2 DTCC (Depository Trust & Clearing Corporation, USA)
Testing blockchain for derivatives clearing, handling billions of trades annually.
8.3 JPMorgan Onyx Platform
Uses blockchain for intraday repo transactions and wholesale payments.
8.4 Uniswap and DeFi Platforms
Over $1 trillion in trading volume executed on blockchain-based DEXs.
9. The Future of Blockchain Trading Systems
Looking ahead, blockchain will likely lead to:
Tokenized Securities Becoming Mainstream – Equities, bonds, and ETFs will exist in tokenized forms.
Global 24/7 Markets – Traditional trading hours will be obsolete.
Central Bank Digital Currencies (CBDCs) – Official digital currencies will integrate into trading platforms.
Automated Smart Derivatives – Entire derivatives contracts will self-execute via code.
Hybrid Exchanges – Combining centralized compliance with decentralized efficiency.
AI + Blockchain Trading – AI algorithms may interact directly with blockchain-based liquidity pools.
10. Conclusion
Blockchain represents a paradigm shift in trading systems. It reimagines the way markets operate by replacing intermediaries with decentralized networks, creating transparency where opacity ruled, and enabling instant settlement where delays were common. By tokenizing assets, blockchain democratizes access to investments, opening global markets to small investors and reducing inefficiencies that have plagued finance for centuries.
Yet, the journey is far from smooth. Scalability, regulation, and integration remain critical challenges. However, just as the internet transformed communication and e-commerce, blockchain is set to transform trading into a faster, cheaper, and more inclusive ecosystem.
The transformation will not happen overnight, but the trajectory is clear: the trading systems of tomorrow will be built on blockchain foundations.
Eth USD SELL Trade Today🔻 ETHUSD Short Setup – Entry: 3965
Ethereum is showing signs of exhaustion near the 3965 resistance zone, setting up for a potential intraday pullback. Key bearish signals include:
- 🔸 Double top formation around 3965
- 🔸 Bearish divergence on RSI (1H/4H)
- 🔸 Volume drop on recent push
- 🔸 Rejection from upper Bollinger Band
📉 Trade Plan:
- Entry: 3965
- Stop Loss: 4005 (above resistance)
- Take Profit Zones: 3900 / 3840 / 3785

ETH continue the bear marketthis is a quick set up fpor today's market as we see all cryptos are bearish and we must have to wait for a mall retracement to continue take the entree

Ethereum Wave Analysis – 25 September 2025
- Ethereum broke support area
- Likely to fall to support level 3714.00
Ethereum cryptocurrency recently broke the support area between the key support level 4090.00 (which stopped the previous corrections 4 and A) and the 50% Fibonacci correction of the upward impulse from the start of August.
The breakout of this ssupport area accelerated the active short-term impulse wave C of the intermediate ABC correction (4) from the end of August.
Ethereum cryptocurrency can be expected to fall further to the next support level 3714.00 (target for the completion of the active impulse wave C).

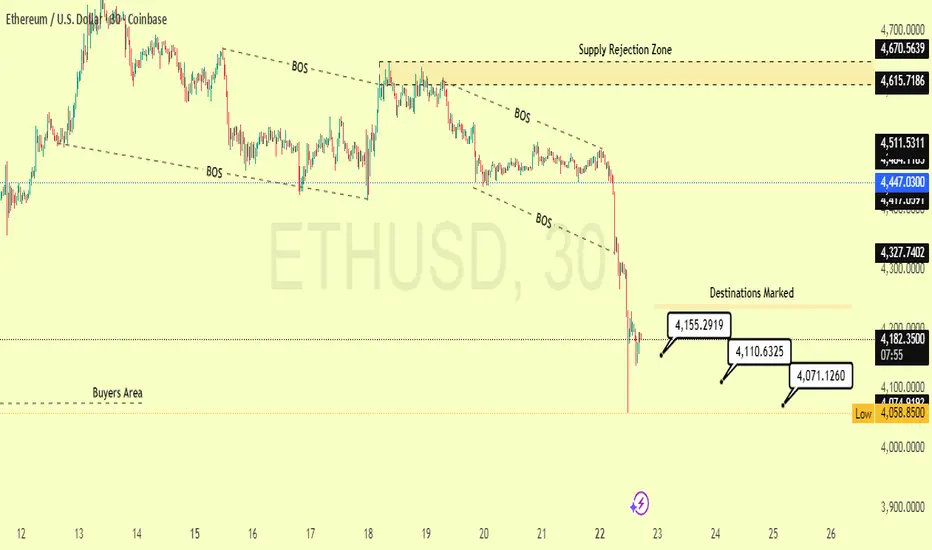
ETHUSD – Sharp Rejection from Supply Zone | Key Targets Mapped"Brief Description:
Ethereum faced a decisive rejection from the **Supply Rejection Zone near $4,615– $4,670**, where previous institutional sell-offs occurred. Price structure showed consistent signs of weakness leading up to this, including multiple Break of Structure (BOS) confirmations on lower highs. The rejection triggered aggressive selling pressure, causing a near 6% drop in a single session — a clear indication of supply absorption and lack of bullish momentum at the top. This move likely flushed leveraged longs, opening the door for liquidity grabs toward demand zones.
Following the sharp dump, ETH is now showing signs of a short-term relief move. The chart outlines a corrective bounce setup with clear intraday targets, acting as potential resistance levels on the way up:
Target 1: $4,155.29 – Strong reaction level, aligned with structural breakdown point.
Target 2: $4,110.63 – Mid-level reaction zone; watch for volume behavior here.
Target 3: $4,071.13 – Near-term resistance, potential pullback zone.
Traders should monitor lower timeframes for signs of reversal or continuation near these levels. The Buyers Area around \$4,000 remains critical if price continues lower.
This setup aligns with broader market weakness and reflects typical behavior following rejection from a strong supply zone — remain cautious and trade with discipline.
Best Way of Trade in Global Market1. Introduction to Global Market Trading
The global market is a vast network where nations, corporations, and individuals engage in the exchange of goods, services, and financial assets. It connects continents through trade flows, currency exchanges, stock markets, and commodities. In today’s era of globalization, no economy functions in isolation—an event in one corner of the world can ripple across markets everywhere.
Trading in the global market is not just about buying low and selling high. It is about understanding global dynamics, currencies, interest rates, political shifts, technological innovation, and cultural differences. The best way to trade in the global market is by adopting a strategic, informed, and risk-managed approach.
2. Why Trade in the Global Market?
Trading globally offers opportunities that local markets may not provide.
Diversification of Risk – By spreading investments across countries and asset classes, traders reduce dependence on a single economy.
Access to Growth Markets – Emerging economies like India, Brazil, and Vietnam are growing faster than developed economies, offering higher returns.
Currency Benefits – Forex markets allow traders to profit from exchange rate fluctuations.
Global Innovation Exposure – Investing globally provides access to new technologies, industries, and consumption trends.
Hedging Against Inflation – Commodities like gold, oil, and agricultural products offer protection against inflationary pressures.
Trading in the global market is both an opportunity and a responsibility, requiring awareness of risks and market structures.
3. Types of Global Market Trading
To find the best way to trade globally, one must first understand the different types of trading:
Stock Market Trading (Equities) – Buying and selling shares of global companies listed on exchanges like NYSE, NASDAQ, LSE, or NSE.
Forex Trading (Currencies) – The world’s largest market, where currencies like USD, EUR, JPY, and INR are traded 24/7.
Commodity Trading – Trading in gold, silver, crude oil, natural gas, coffee, wheat, and other resources.
Bond & Debt Market Trading – International investors trade government or corporate bonds for safer, fixed-income returns.
Derivatives Trading – Futures, options, swaps, and other contracts used for speculation or hedging.
Crypto & Digital Assets – Trading Bitcoin, Ethereum, and other digital currencies gaining global recognition.
Cross-Border Trade in Goods & Services – Physical movement of goods like electronics, automobiles, and textiles between nations.
Each type requires different skills, risk tolerance, and strategies.
4. Key Instruments in Global Trading
Stocks/Equities – Represent ownership in a company.
ETFs (Exchange-Traded Funds) – Allow access to a basket of global assets.
Futures Contracts – Agreements to buy/sell assets at a future date.
Options – Provide flexibility with rights (not obligations) to trade assets.
Currencies (Forex) – Driven by macroeconomic and geopolitical factors.
Commodities – Gold, crude, and agricultural goods as safe havens or growth bets.
Bonds – Government & corporate debt for stability.
Understanding which instruments fit your financial goals is crucial to finding the best global trading method.
5. Factors Influencing Global Trade & Markets
Economic Indicators – GDP growth, inflation, unemployment, interest rates.
Central Bank Policies – The US Federal Reserve, ECB, RBI, and BOJ decisions.
Geopolitical Events – Wars, sanctions, trade agreements.
Technology & Innovation – AI, fintech, e-commerce growth.
Natural Resources & Climate Change – Affect commodity supply and pricing.
Global Connectivity – Internet penetration, financial access, blockchain.
The best traders carefully study these factors to anticipate market shifts.
6. Best Ways / Strategies to Trade Globally
Here comes the most important part—the actual best practices for trading in global markets.
A. Fundamental Strategies
Study macroeconomics: inflation, interest rates, and trade balances.
Track earnings reports of multinational corporations.
Monitor commodity demand-supply balance.
Analyze political stability and trade agreements.
B. Technical Strategies
Use charting tools: candlesticks, moving averages, RSI, MACD.
Identify global price patterns and volume spikes.
Apply volume profile & market structure analysis for stronger entries/exits.
C. Risk Management
Always set stop-loss levels.
Use position sizing (never invest more than 1–2% of capital per trade).
Diversify across regions and asset classes.
Hedge with safe assets like gold or USD when markets are volatile.
D. Long-Term vs Short-Term Approaches
Long-Term Global Investing: Buy quality global stocks, ETFs, or bonds for steady growth.
Short-Term Global Trading: Focus on forex, futures, and options for quick profits with higher risks.
E. Leverage Technology
Use AI-powered trading platforms.
Apply algorithmic trading for efficiency.
Stay updated with real-time news feeds & data analytics.
7. Role of Technology, AI & Global Connectivity
Algorithmic Trading – High-frequency strategies based on programmed rules.
AI in Market Prediction – Predicting price movements using big data.
Blockchain & Crypto – Decentralized finance reshaping cross-border trade.
E-commerce Expansion – Global platforms like Amazon, Alibaba influencing logistics & currencies.
The future best way of trading globally will increasingly depend on data-driven decision-making.
8. Challenges in Global Trading
Currency Volatility – Fluctuating exchange rates affect profits.
Geopolitical Risks – Wars, trade wars, sanctions.
Regulatory Differences – Each country has unique tax, compliance, and trading rules.
Information Overload – Too much data can confuse decision-making.
High Competition – Global traders compete with hedge funds, institutions, and algorithms.
Understanding and preparing for these challenges is vital.
9. Practical Steps for Beginners to Start Global Trading
Education First – Learn basics of forex, stocks, commodities.
Choose a Reliable Broker – Ensure global access, regulation, and low fees.
Start Small – Begin with ETFs or paper trading before direct forex/derivatives.
Follow Global News Daily – Understand how events affect markets.
Practice Risk Management – Never trade emotionally.
Build a Global Portfolio – Mix equities, bonds, forex, and commodities.
10. Future Outlook of Global Market Trading
Digital Currencies & CBDCs will make cross-border trade faster.
AI-Powered Trading Bots will dominate short-term strategies.
Emerging Markets will drive growth opportunities.
Sustainable Trading (green energy, ESG assets) will attract capital.
Decentralized Finance (DeFi) will reduce dependency on traditional banks.
The future best way of trading globally will be a hybrid of human intelligence + AI-driven systems + sustainable investments.
11. Conclusion
The best way of trading in the global market is not a single fixed formula—it is a dynamic process combining education, analysis, technology, and discipline. Traders must blend fundamental understanding with technical tools, ensure risk management, and use AI-driven strategies to remain competitive.
Global trade is expanding rapidly, and with the right approach, even small traders can participate meaningfully in the world’s biggest financial opportunities.
In essence, the best way to trade in the global market is to stay informed, diversified, disciplined, and adaptive—while leveraging both technology and human judgment.

Updated ETH Chart. Bullish falling wedge extension past ATHUpdate to my previous idea, I think with the Fed rate cut upcoming after the weekend close, ETH will make a new ATH next week.
Ichimoku buy signal on ETH/USD DailySo there's an ichimoku buy signal on the ethereum daily chart. When the faster span crosses over the slower one, (doesn't let me use japanese words) and the current candles are over the cloud, this indicates a buy signal. The lagging span should ideally be above the corresponding price action. In this case it almost is.
Other than the indicators, we have a bull pennant looking shape. as well as a cup and handle looking pattern. The trade is to buy here targeting new all time highs for ethereum. This also depends on bitcoin. If bitcoin goes up, I am very certain this will happen.
Not telling you a stop loss or anything.
Not financial advice

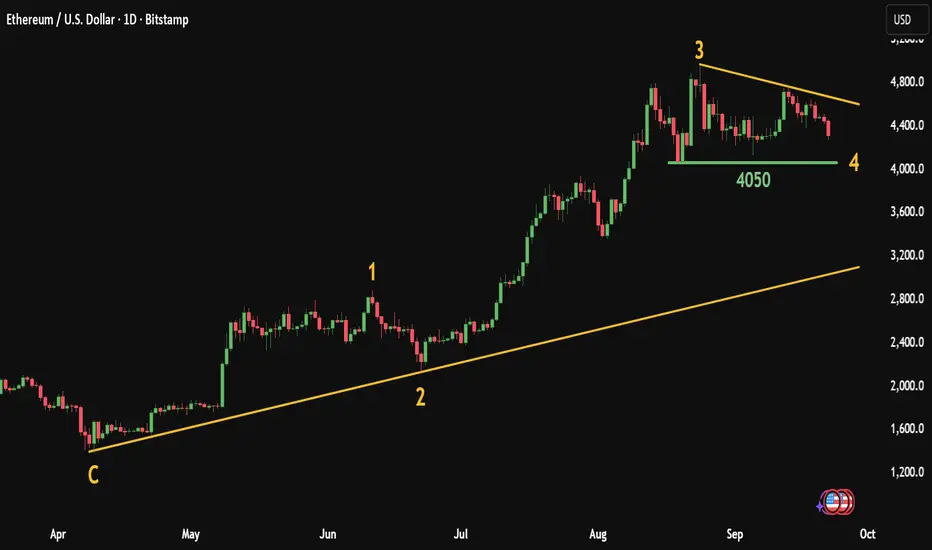
ETH Elliott Wave Analysis: Key Support at $4,050, Targets $5,200The attached chart clearly illustrates that Ethereum’s current price action is following a classic Elliott Wave structure, with three major impulsive waves completed and the market currently consolidating within the fourth corrective wave.
Ⅰ. Completed Waves
Wave C (the bottom): Marked the starting point of the new bullish cycle, around the $1,700 – $1,800 levels.
Wave 1: The initial impulsive rally, reaching $2,900 – $3,000.
Wave 2: A sideways/ corrective decline, which respected the previous bottom and maintained the overall bullish structure.
Wave 3: The strongest and most extended impulsive wave, pushing price aggressively to $4,800 – $4,900, showing the typical momentum associated with third waves.
Ⅱ. Current Phase – Wave 4
Price is consolidating within a descending contracting triangle, which is typical of a fourth-wave correction.
The key support lies at $4,050, acting as the main level to preserve the bullish Elliott structure.
Wave 4 is usually more complex and sideways than Wave 2, which fits well with the current market behavior.
Ⅲ. Outlook – Wave 5
As long as $4,050 holds without a daily close below it, the most likely scenario is the start of the fifth impulsive wave upward.
This wave is expected to break above the Wave 3 peak at $4,800 and extend into new highs.
Potential upside targets: $5,200 – $5,500, with room for higher levels if institutional momentum drives further expansion.
Conclusion:
Ethereum is unfolding within a clear Elliott Wave bullish cycle. The ongoing Wave 4 correction is consolidating around the $4,050 support level, which is the key pivot to watch. Holding this zone increases the probability of a Wave 5 rally, potentially driving ETH to fresh all-time highs in the coming weeks.
ETH – Symmetrical Triangle Compression📆 On the 6H timeframe, CRYPTOCAP:ETH is consolidating inside a symmetrical triangle 🛡️
This compression phase often precedes a sharp directional move — either a breakout to the upside or a breakdown if support gives way ⚡. Traders typically watch these setups closely as volatility tends to expand after the squeeze.
👀 Keep an eye on this structure — the next move could be significant.
Not financial advice.
