ETHUSD is in correction, but longs are now preferredETH is developing a big triangle, leg A of which is completed.
ETHWAVAX_1ACF15.USD trade ideas

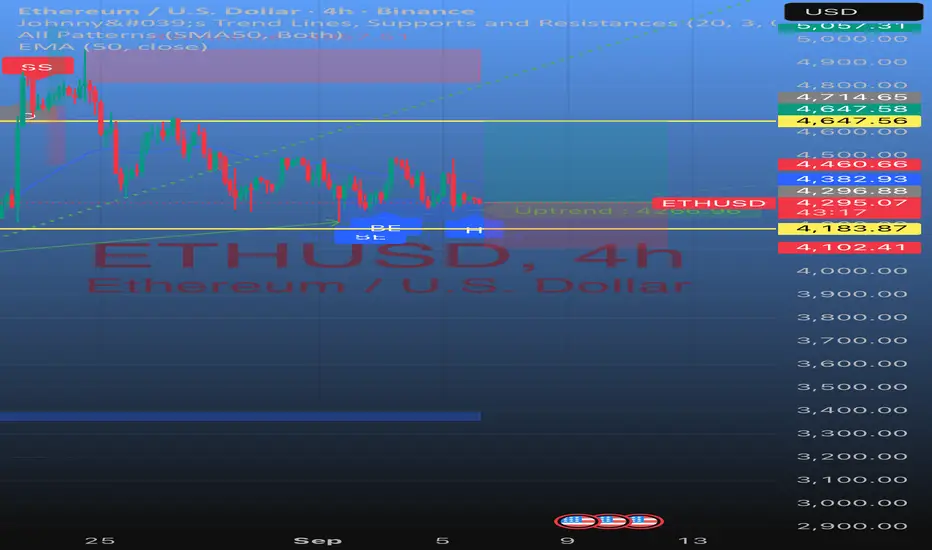
ETHUSD H4 | Bearish reversal signalEthereum (ETH/USD) has rejected off the sell entry at 4,628.98, whichis a pullback resistance and could reverse from this level to the downside.
Stop loss is at 4,851.84, whichis a swing high resistance.
Take profit is at 4,226.60, whichis a pullback support.
High Risk Investment Warning
Trading Forex/CFDs on margin carries a high level of risk and may not be suitable for all investors. Leverage can work against you.
Stratos Markets Limited (tradu.com ):
CFDs are complex instruments and come with a high risk of losing money rapidly due to leverage. 65% of retail investor accounts lose money when trading CFDs with this provider. You should consider whether you understand how CFDs work and whether you can afford to take the high risk of losing your money.
Stratos Europe Ltd (tradu.com ):
CFDs are complex instruments and come with a high risk of losing money rapidly due to leverage. 66% of retail investor accounts lose money when trading CFDs with this provider. You should consider whether you understand how CFDs work and whether you can afford to take the high risk of losing your money.
Stratos Global LLC (tradu.com ):
Losses can exceed deposits.
Please be advised that the information presented on TradingView is provided to Tradu (‘Company’, ‘we’) by a third-party provider (‘TFA Global Pte Ltd’). Please be reminded that you are solely responsible for the trading decisions on your account. There is a very high degree of risk involved in trading. Any information and/or content is intended entirely for research, educational and informational purposes only and does not constitute investment or consultation advice or investment strategy. The information is not tailored to the investment needs of any specific person and therefore does not involve a consideration of any of the investment objectives, financial situation or needs of any viewer that may receive it. Kindly also note that past performance is not a reliable indicator of future results. Actual results may differ materially from those anticipated in forward-looking or past performance statements. We assume no liability as to the accuracy or completeness of any of the information and/or content provided herein and the Company cannot be held responsible for any omission, mistake nor for any loss or damage including without limitation to any loss of profit which may arise from reliance on any information supplied by TFA Global Pte Ltd.
The speaker(s) is neither an employee, agent nor representative of Tradu and is therefore acting independently. The opinions given are their own, constitute general market commentary, and do not constitute the opinion or advice of Tradu or any form of personal or investment advice. Tradu neither endorses nor guarantees offerings of third-party speakers, nor is Tradu responsible for the content, veracity or opinions of third-party speakers, presenters or participants.

Petrodollar & Oil Trade Mechanisms1. Origins of the Petrodollar System
1.1 Oil and the Bretton Woods Order
After World War II, the Bretton Woods Agreement (1944) created a global financial system where most currencies were pegged to the U.S. dollar, and the dollar itself was pegged to gold at $35 per ounce. This made the dollar the cornerstone of world trade. Since oil was becoming a critical global resource, it naturally started being priced in dollars.
1.2 The Collapse of Bretton Woods
In 1971, President Richard Nixon ended the convertibility of the dollar to gold. This “Nixon Shock” meant the U.S. dollar was no longer backed by gold, leading to concerns about its stability. At the same time, oil demand was booming worldwide, and the U.S. needed a way to preserve the dollar’s dominance.
1.3 U.S.–Saudi Deal and Birth of Petrodollars
In 1974, the U.S. struck a historic deal with Saudi Arabia, the world’s largest oil exporter and de facto leader of OPEC (Organization of Petroleum Exporting Countries). The agreement included:
Saudi Arabia pricing its oil exclusively in U.S. dollars.
Investing surplus revenues in U.S. Treasury securities and financial markets.
In return, the U.S. provided military protection and security guarantees.
Other OPEC members followed suit. This was the birth of the petrodollar system, where oil exports globally were priced and traded in U.S. dollars. The result: demand for dollars surged worldwide, cementing the U.S. currency as the world’s reserve currency.
2. How the Petrodollar System Works
2.1 Dollar-Denominated Oil
Under the petrodollar system, any country wishing to buy oil must first acquire U.S. dollars. This creates constant global demand for dollars, ensuring its strength and liquidity in foreign exchange markets.
2.2 Recycling of Petrodollars
Oil-exporting nations like Saudi Arabia, Kuwait, and the UAE generate huge dollar revenues. These dollars are then recycled in two ways:
Investment in U.S. assets: Treasuries, bonds, real estate, and equities.
Loans to developing countries: Petrodollar surpluses often flow into global banks, which lend them to countries in need of capital.
This cycle—oil buyers purchasing dollars, exporters reinvesting dollars—sustains global financial flows.
2.3 U.S. Strategic Advantage
Because oil trade requires dollars, the U.S. enjoys unique privileges:
Ability to run persistent trade deficits without collapsing currency value.
Financing government spending through foreign purchases of U.S. debt.
Strengthening its geopolitical influence by controlling financial channels linked to the dollar.
In essence, the petrodollar acts as a form of “hidden tax” on the world, since global demand for dollars supports U.S. economic power.
3. Oil Trade Mechanisms in Practice
3.1 Global Oil Markets
Oil is traded in both physical markets and futures markets:
Physical market: Actual crude is bought and sold, usually under long-term contracts or spot deals.
Futures market: Contracts on exchanges (like NYMEX or ICE) allow traders to speculate or hedge against oil price movements.
Both markets are dominated by U.S. dollar pricing benchmarks such as:
WTI (West Texas Intermediate) – benchmark for U.S. oil.
Brent Crude – benchmark for international oil trade.
3.2 Shipping & Logistics
Oil trade relies heavily on maritime transport. Tanker routes like the Strait of Hormuz, Suez Canal, and Strait of Malacca are chokepoints critical to supply. Insurance, shipping contracts, and freight charges also link back to dollar-based systems.
3.3 Role of OPEC and Non-OPEC Producers
OPEC, founded in 1960, has historically coordinated oil output to influence prices. But newer players like Russia, the U.S. (via shale oil), and Brazil also play major roles. Despite these shifts, the dollar remains the settlement currency.
3.4 Derivatives and Financialization
Beyond physical barrels, oil is increasingly a financial asset. Banks, hedge funds, and institutional investors use futures, options, and swaps to speculate or manage risk. The fact that all these instruments are denominated in dollars further entrenches the petrodollar.
4. Geopolitical Implications of the Petrodollar
4.1 Dollar Hegemony
The petrodollar is a cornerstone of U.S. financial dominance. Control over oil trade means:
U.S. sanctions become extremely powerful (cutting nations off from dollar-based transactions).
Countries are incentivized to hold dollar reserves.
American banks and financial institutions dominate global capital flows.
4.2 Middle East Politics
The U.S.–Saudi alliance is at the heart of the petrodollar system. U.S. military presence in the Middle East has often been tied to protecting oil flows and ensuring dollar-denominated trade.
4.3 Wars and Petrodollar Resistance
Countries that attempted to bypass the petrodollar often faced geopolitical pushback:
Iraq (2000): Saddam Hussein switched oil sales to euros. The U.S. invasion in 2003 reversed this.
Libya (2010): Muammar Gaddafi proposed a gold-backed African dinar for oil. NATO intervention soon followed.
Iran: Has long sought to sell oil in euros, yuan, or barter arrangements, facing heavy U.S. sanctions.
4.4 Rise of China and Yuan Internationalization
China, the world’s largest oil importer, has pushed for alternative arrangements:
Launching Shanghai crude oil futures denominated in yuan.
Signing oil-for-yuan agreements with Russia, Iran, and others.
Promoting the “petroyuan” as a challenger to the petrodollar.
5. Economic Effects of the Petrodollar System
5.1 On the U.S.
Benefits: Cheap financing, stronger global financial role, ability to run deficits.
Risks: Overreliance on dollar demand can mask structural weaknesses in U.S. manufacturing and trade.
5.2 On Oil Exporters
Oil-rich nations earn vast revenues, but dependence on dollars ties them to U.S. monetary policy. Petrodollar inflows can also create “Dutch Disease”—overdependence on oil revenues at the expense of other sectors.
5.3 On Importing Countries
Nations must secure dollars to pay for oil. This can create vulnerability during dollar shortages, especially in developing countries, leading to debt crises (e.g., Latin America in the 1980s).
5.4 On Global Finance
Petrodollar recycling has fueled global liquidity. But when oil prices collapse, dollar inflows shrink, causing volatility in emerging markets and banking systems.
6. Challenges to the Petrodollar System
6.1 Shift Toward Multipolarity
The world is moving toward multipolar finance, with alternatives like:
Petroyuan (China).
Digital currencies and blockchain settlements.
Barter systems (oil-for-goods agreements).
6.2 U.S. Sanctions Overuse
While sanctions are a powerful tool, their frequent use pushes countries to seek alternatives to dollar-based trade. Russia, Iran, and Venezuela are examples of nations turning to non-dollar settlements.
6.3 Renewable Energy Transition
As the world moves toward renewable energy and electric vehicles, long-term oil demand may decline. This could erode the centrality of the petrodollar in the global system.
6.4 De-dollarization Movements
Countries like BRICS members (Brazil, Russia, India, China, South Africa) are actively promoting alternatives to dollar dominance. The creation of BRICS financial frameworks could reduce reliance on the petrodollar.
Conclusion
The petrodollar system has been one of the most powerful and enduring mechanisms in the modern global economy. It links the world’s most traded commodity—oil—to the U.S. dollar, reinforcing American financial dominance for nearly five decades. Oil trade mechanisms, whether through physical barrels, futures contracts, or financial derivatives, all flow through this system, shaping the destiny of nations.
However, the petrodollar is not invincible. Geopolitical rivalries, overuse of U.S. sanctions, the rise of China, and the gradual energy transition toward renewables are all eroding its absolute dominance. While the dollar is unlikely to lose its central role overnight, the world is clearly moving toward a more multipolar currency system for energy trade.
The story of the petrodollar is not just about oil or money—it is about power, politics, and the architecture of the global economy. Its future will depend on how nations navigate energy transitions, financial innovations, and geopolitical shifts in the decades to come.

Practice makes perfectGreat thing about TradingView are the tools, one such is paper trading. Using paper trading, I can live test my strategies. I've been trying to catch the bottom of this dip, maybe this is it?

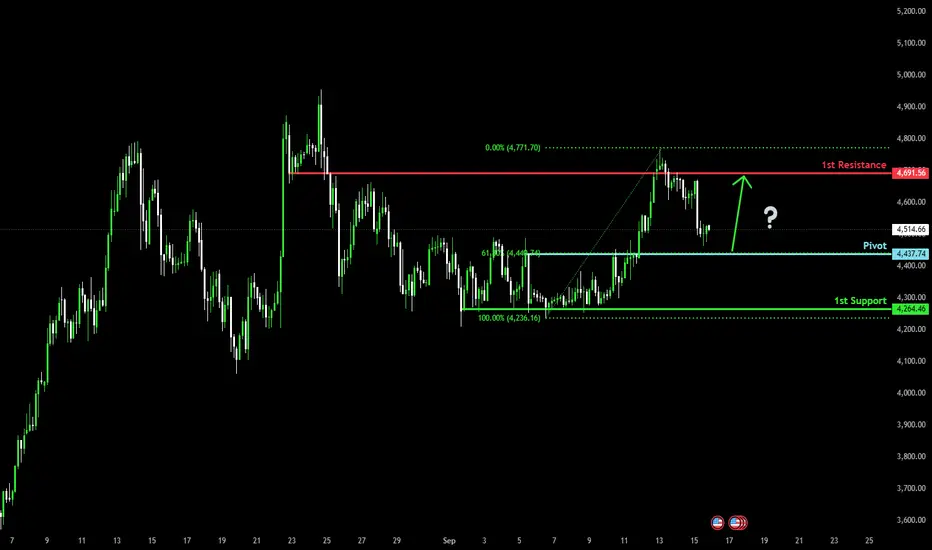
Bullish bounce off 61.8% Fibonacci support?The Ethereum (ETH/USD) is falling towards the pivot, which acts as a pullback support that aligns with the 61.8% Fibonacci retracement and could bounce to the 1st resistance.
Pivot: 4,437.74
1st Support: 4,264.46
1st Resistance: 4,691.56
Disclaimer:
The above opinions given constitute general market commentary, and do not constitute the opinion or advice of IC Markets or any form of personal or investment advice.
Any opinions, news, research, analyses, prices, other information, or links to third-party sites contained on this website are provided on an "as-is" basis, are intended only to be informative, is not an advice nor a recommendation, nor research, or a record of our trading prices, or an offer of, or solicitation for a transaction in any financial instrument and thus should not be treated as such. The information provided does not involve any specific investment objectives, financial situation and needs of any specific person who may receive it. Please be aware, that past performance is not a reliable indicator of future performance and/or results. Past Performance or Forward-looking scenarios based upon the reasonable beliefs of the third-party provider are not a guarantee of future performance. Actual results may differ materially from those anticipated in forward-looking or past performance statements. IC Markets makes no representation or warranty and assumes no liability as to the accuracy or completeness of the information provided, nor any loss arising from any investment based on a recommendation, forecast or any information supplied by any third-party.
FOMC CRYPTO ANALYSISThe crypto market is showing big volatility right now, and with it comes opportunity.
In this video I break down Bitcoin (BTC) and the broader market, and explain why I see this as a chance to sell BTC strength and look for the right moment to rotate into altcoins.
I’ll cover:
- How current volatility is shaping the market
- Key BTC levels I’m watching with ICT concepts
- Why I’m preparing for an altcoin opportunity after this move
- The importance of timing rotation from BTC into alts
👉 Do you think it’s time to rotate into alts, or is BTC still in control? Share your thoughts in the comments.
#Crypto #Bitcoin #Altcoins #BTC #ICTTrading #CryptoStrategy

Ethereum: The Long Game, The Smart AccumulationEthereum Long-Term Bull Thesis with Accumulation Perspective
Ethereum remains at the core of the smart contract revolution, and the long-term structure continues to validate the bullish thesis. With scaling solutions gaining traction, institutional participation increasing, and ETH’s utility expanding across DeFi, gaming, tokenization, and beyond, the macro case for higher valuations over the coming years is undeniable.
From a price-structure perspective, ETH has broken above critical resistance and is sustaining momentum near multi-year highs, underscoring the strength of the current cycle. I remain firmly bullish on Ethereum’s long-term trajectory, viewing it not just as an asset, but as the backbone of the evolving decentralized economy.
That said, corrections are part of any healthy uptrend. Should the market provide a pullback, I’m eyeing the $3,200–$3,500 zone as a major accumulation area. This range is reinforced by strong confluence of historical support, key trendline intersections, and prior consolidation bases visible on both the daily and 4H charts. In my view, this zone represents where value buyers will reload in anticipation of Ethereum’s next leg higher.
In essence, my outlook does not change with short-term fluctuations: I am a long-term believer in ETH’s growth story. A correction into the $3,200–$3,500 accumulation zone would not be weakness — it would be opportunity.
Summary: Long-term bullish, unwavering conviction. Any dip toward the $3,200–$3,500 range is a gift for accumulation in an asset that I believe will continue to redefine digital finance.

ETH/USD Rebounds from Support, Eyes 4,767ETH/USD bounced from a protected low at 4,464, showing early signs of recovery. If price holds above support, a move toward the previous swing high at 4,767 is likely. The setup favors buyers as long as the protected low is not broken.
This analysis is for educational purposes only and does not constitute financial advice.

The first step towards 5k - ETH weekly update Sep 15 - 21thDear investors and traders,
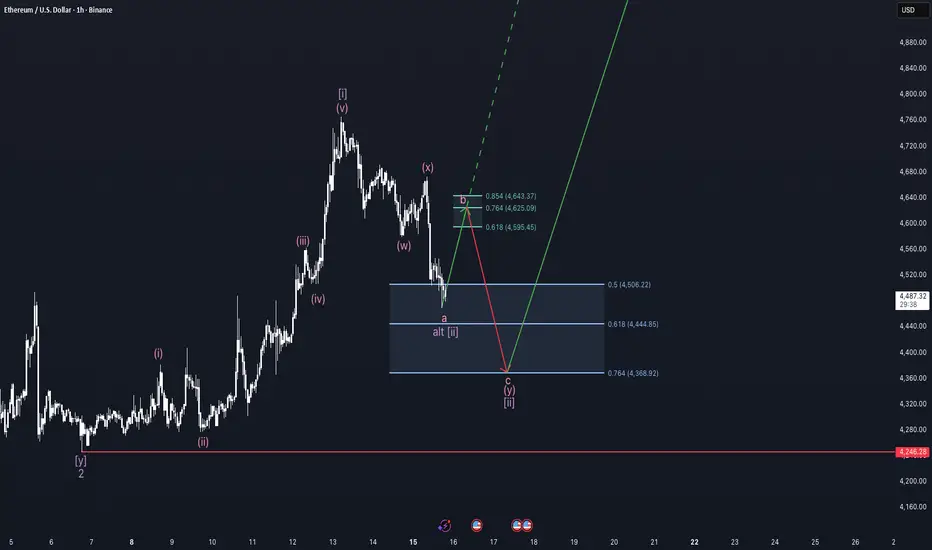
Ethereum is currently in the second wave of the minute cycle within the larger third wave unfolding in the minor cycle.Zooming into the fractal structure of the mentioned second wave, we can easily recognize the double three pattern as shown on the chart. My primary expactation therefore is a combination of a flat structure as a minuette wave w and a following zig zag a minuette wave y. I have chosen this scenario, because it's typical for altcoins to retrace their wave two a bit deeper then assets do normally. Also, the flat structure hasn't corrected this second wave too far, making a larger pullback likely. The zig zag probably made his subminuette wave a and should retrace now to levels of around 4.6k. The alternative scenario would be, that this second wave is already completed and with that we would be looking forward to 5k. For the alternative scenario to be completed, we need ETH to climb higher than the previous high of the minuette wave x.
Moving on to the liquidity analysis, we can see why this is my primary scenario: A massive amount of liquidity sitting just above the with the red line shown low of the minor wave two. I think we are going to drop again in the direction of this liquidity, but I hope it is going to melt down as people fear to get liquidated. The drawn in price target surely isn't where the liquidity sits, but it's where most fibonacci levels come together. The Orderbook is relatively empty in nearer space, but there is a large amount of short orders sitting at 5k.
Derivative data shows us turbulent funding rates because of people trying to catch this drop with large leverage market orders and getting liquidated, making the funding rate apparently to come back, maybe because they fear to loose more money now. Open interest stagnates, which is on the one hand positive because there are no more short positions adding up but this also means on the other hand that there are no long positions coming in. One thing I also noted in relation to people trying to catch the drop and burning themselves is that the liquidations are declining, which is indicating the leverage is decreasing.
Coming to exchange flows, the exchanges currently record an inflow of ethereum meaning that people are probably moving their coins from wallets to the exchange to sell them, which is a bearish signal. Also notable is that the exchange reserve is increasing, also indicating that people sell their ethereum.
The seasonality of ethereum shows us that the current Q3 was doing exceptionally well for ethereum and looking forward Q4 is also going to be green with a probability of 60%. September in the past was rather bearish then bullish, flipping the probabilities to a 40% probability to get a positive result. Nonetheless, the average return of September is 7%, which sparks hope.
Looking to Blackrock and other whales and entities, we can clearly see that Blackrock sold a part of it's ethereum (10k ETH) just slightly before the top and not buying again till now indicating the bottom is not in yet. The ETFs is still getting inflows, showing institutions accumulating ethereum.
All in all I am long and I think that the anticipated lows are optimal prices to establish swing long positions. Crucial for a impulsive move and the transition from a minute wave two to a minute wave 3 is the decline of liquidity at the low of the minor wave two.
Ethereum (ETHUSD) Technical OutlookEthereum remains in a critical yet bullish consolidation phase, trading sideways near all-time highs. This kind of price action often precedes major breakouts, especially with macro tailwinds building — the Fed is expected to cut rates this week, adding liquidity to the market.
🔍 Technical Setup
ETH is currently attempting a breakout from a symmetrical triangle — a bullish continuation pattern in trending markets.
✅ Uptrend confirmed by:
Higher highs
Higher lows
Strong support structure
🎯 Key Levels to Watch
Immediate target zone: $5,700 – $5,800
Macro rally potential: $7,000 – $8,000
Crucial support: $4,000 – $4,200
As long as ETH holds above $4,000, there’s no technical reason to be bearish.

HARD SHORTMy former analysis successfully landed to target zone. And now market wants a pull back.
1-Above there is low liqudation
2-Next week we will probably see a rate cut. thats why I am a little nervous abot open short
3-Till that day I think whales will chase cheap asset that is where my courage come from
4-Market wants to see a pull back
be careful about short you may just want to open long at the below
Always manage your own risks this is not a investment advise I am not responsible neither your loss nor profit.

This is the graph I showed stream of our 2 possible scenarios Tbh im pretty new to this whole thing, however certainly put in hours of research into all sorts of techniques. However 2 things interest me in these scenarios. 1. Where everyone makes money. And 2. Only the big market makers make money.
For the first one we would need that dump before tomorrow starts. Then a small pump late Monday early Tuesday. Then a drawback Tuesday night into Wednesday. Then providing space on rsi and macD for a wave 3. However theres the chance that all of unclesams friends aunts and uncles could come together and say, we'll here's your rate cuts but we're gonna dump it on you. Cause "fear of reccesion" after dropping a 50 pt rate cuts. So it's anyone's game. But food for thought.
#ETH/USDT Testing Wedge Breakout Amid Key Support#ETH
The price is moving within a descending channel on the 1-hour frame, adhering well to it, and is heading for a strong breakout and retest.
We have a bearish trend on the RSI indicator that is about to be broken and retested, which supports the upward move.
There is a major support area in green at 4480, which represents a strong support point.
For inquiries, please leave a comment.
We are in a consolidation trend above the 100 Moving Average.
Entry price: 4524
First target: 4585
Second target: 4645
Third target: 4715
Don't forget a simple matter: capital management.
When you reach the first target, save some money and then change your stop-loss order to an entry order.
For inquiries, please leave a comment.
Thank you.

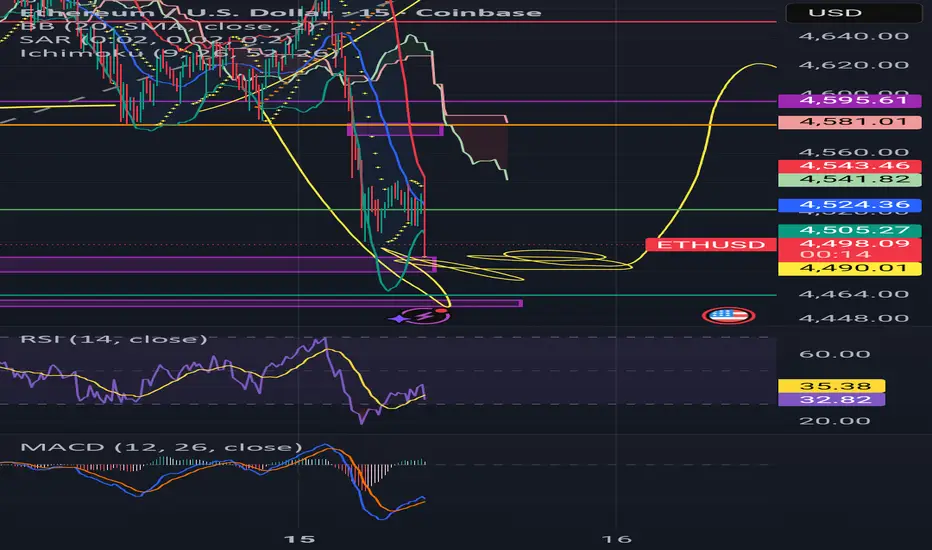
ETH/USD 2h chart with Ichimoku cloud.ETH/USD 2h chart with Ichimoku cloud, resistance zone, and two marked "Target Points."
Based on the chart I have shared:
Immediate resistance: Around $4,650 – $4,750 (yellow zone).
Breakdown confirmed (BOS): Price rejected from resistance and broke down through the cloud.
Targets marked on chart:
1. First target zone: Around $4,440 – $4,450
2. Second target zone: Around $4,230 – $4,250
🔻 So, if bearish momentum continues, ETH has downside targets near $4,450 first, then possibly $4,250.

ETH/USD (1H timeframe, Coinbase):ETH/USD (1H timeframe, Coinbase):
Price has broken out above the descending trendline.
It has cleared the resistance zone around 4,365 – 4,380 (yellow box).
Ichimoku cloud is supportive of a bullish move i have already marked two "Target Points" on your chart.
📍 Targets shown on my chart:
1. First Target Zone: around 4,680 – 4,690
2. Second Target Zone: around 4,720 – 4,730
⚠ Notes:
Watch for a retest of the breakout zone (4,365 – 4,380) for confirmation.
If price fails to hold above 4,365, momentum may weaken.

Where Is ETH Going This Cycle? (Educational Perspective)
Every cycle brings the same question:
Where is Ethereum heading next? Most look for price guesses, but that’s a distraction. The real advantage comes from knowing what factors will drive ETH’s direction. Understanding the drivers doesn’t require prediction, it requires planning.
A Look Back: ETH in Previous Cycles
Ethereum has repeatedly proven its resilience and innovation leadership:
2016–2017: Breakout fueled by ICO boom—ETH became the token-launch backbone.
2018–2019: Bear market and ICO collapse—but builders persisted.
2020–2021: DeFi and NFT surge—Ethereum powered the blockchain economy as “digital oil.”
2022–2023: Post-Merge era—transition to PoS and reduced issuance amid regulatory uncertainty.
Through every phase, ETH stayed central to crypto’s evolution.
On-Chain Metrics to Watch
Ethereum’s transparency lets us monitor structural strength in real time:
Active addresses gauge real network use.
Staking levels shrink available supply—over 35M ETH (≈30%) staked by mid-2025.
ETH locked in DeFi reflects collateral demand.
Gas fee burn continues to tighten supply post-EIP-1559.
Macro & Narrative Drivers (2024–2025 Upgrades & ETF Momentum)
Stories move markets, and Ethereum has some strong ones now:
Spot ETH ETF Launch: Nearly $500M in institutional inflows since mid-2024.
Staking Supply Constraint: Record ETH locked → tighter supply.
Technical Enhancements: Dencun (2024) and Pectra (2025) improving scalability and validator usability.
Regulatory & Macro Tailwinds: GENIUS Act, institutional adoption, favorable policies.
The Real Question Traders Should Ask
Price targets are clickbait. The real question is:
“Which factors will move ETH this cycle?”
By tracking ETF flows, staking ratios, upgrades, and macro conditions, traders avoid being surprised.

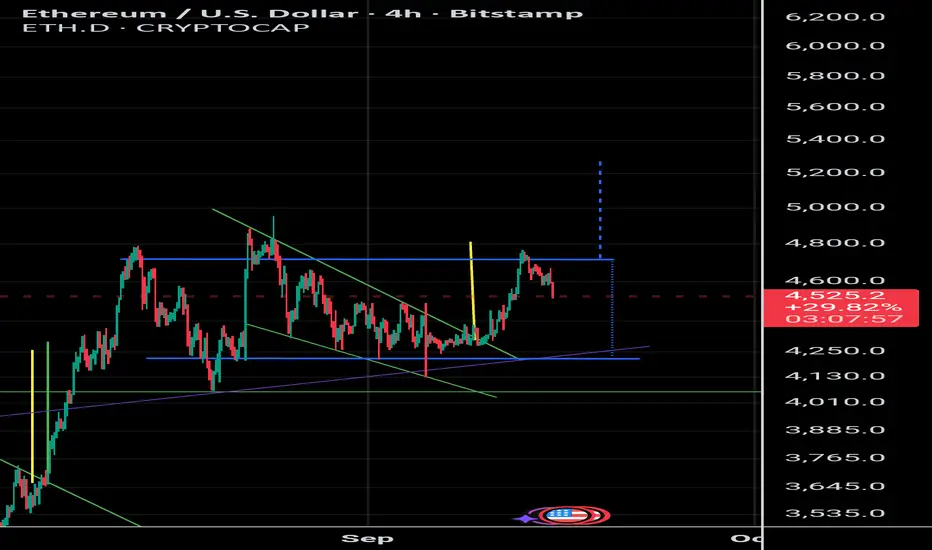
ETH Bullish Trend The chart shows a potential "ABC" corrective wave pattern, often seen as part of a larger bullish trend.
Wave (A): The initial strong upward move from around $3,000 to over $4,800.
Wave (B): A subsequent correction or consolidation phase, where the price pulled back and appears to be finding support around the $4,200 - $4,300 area (highlighted by the yellow line and the brown box). This area seems to have acted as both previous resistance and now potential support.
Wave (C): If the bullish trend continues, the expectation is for a new impulse wave upward, potentially targeting the area between $5,600 and $6,000, as indicated by the white box and the projected line. This would represent a breakout above the previous high of Wave (A).
In essence, the idea is: The recent pullback (Wave B) has found support, and if this support holds, the cryptocurrency could be poised for another significant upward move (Wave C) towards new highs.
Please note that this is a technical analysis interpretation based on the provided chart and is not financial advice.

ETH/USD – Sharp Breakdown🔴 SHORT below $4,650 – target $4,500
Ethereum trades at $4,520, plunging below SMA200 ($4,651). Resistance at $4,680–4,650, support at $4,500. RSI collapsed to 21, oversold but trend sharply bearish.

Adam&Eve pattern $5200 target!!ETH still bullish ling term.
Thus 4hr chart shows and adam and eve pattern, target to reach $5200....imo
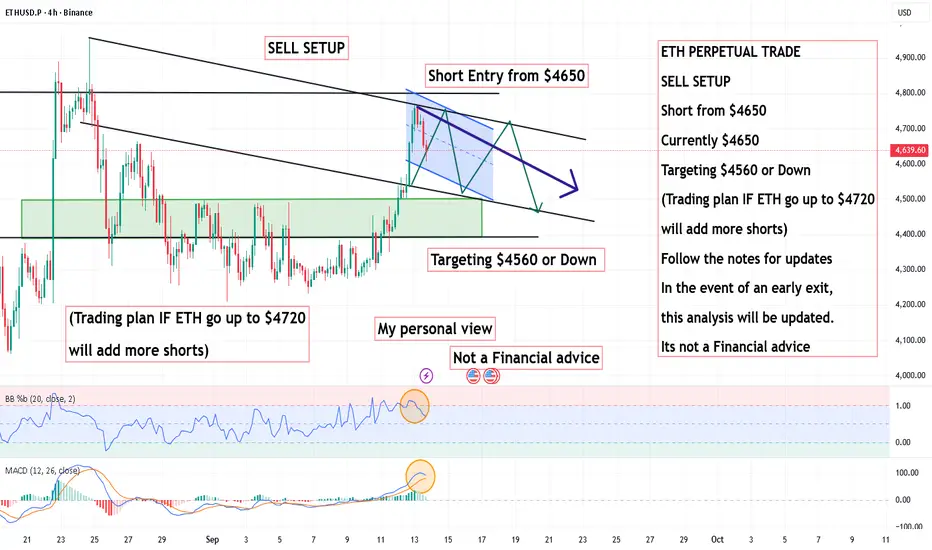
ETH PERPETUAL TRADE SELL SETUP Short from $4650ETH PERPETUAL TRADE
SELL SETUP
Short from $4650
Currently $4650
Targeting $4560 or Down
(Trading plan IF ETH go up to $4720
will add more shorts)
Follow the notes for updates
In the event of an early exit,
this analysis will be updated.
Its not a Financial advice
ETH head and shoulders?I hope I am wrong but it looks like ETH is forming a head and shoulders pattern. This coming week is decisive in determining if ETH will break out past $5k and reach new ATH's or if it will decline into a bear market.
The supply zone appears to begin at $4.6k and the nearest real demand zone is down at $2.5k.
I will be price watching closely this week as it is a decisive one. Best of luck, be careful.
Thoughts?
