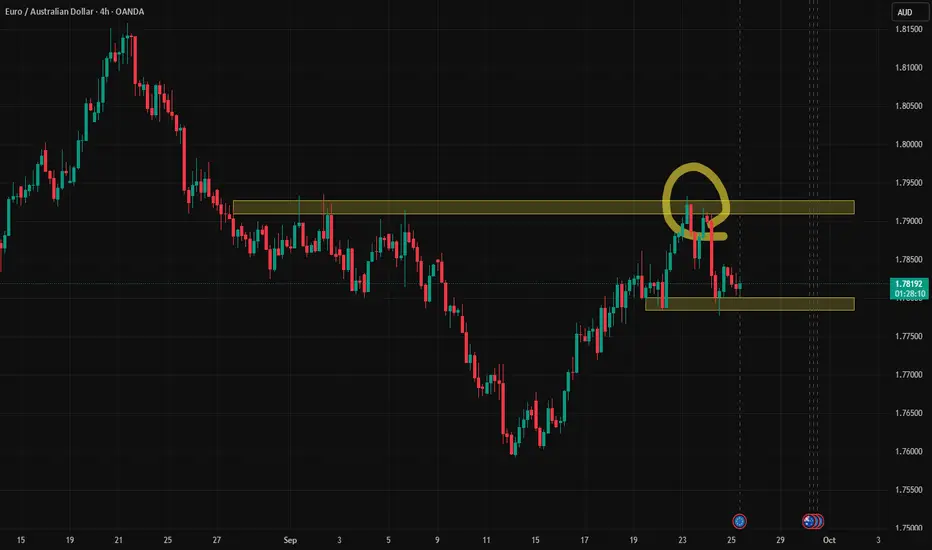
EUR/AUD - Breakout Pattern|Buy Opportunity (26.09.2025)The EUR/AUD pair has been trading inside a descending wedge formation and is now showing a potential breakout to the upside.
🔹 Price successfully tested the trendline resistance and is gaining bullish momentum.
🔹 Buyers are stepping in after multiple rejections near the lower boundary (A–C trendline).
🔹 Breakout above 1.7860 zone opens the path toward higher resistance levels.
📊 Trading Plan:
Buy above breakout zone confirmation
1st Resistance: 1.7929
2nd Resistance: 1.7966
Maintain risk management and wait for candle confirmation.
✨ Trade safe & stay disciplined!
#EURAUD #Forex #Breakout #TradingView #FXAnalysis #PriceAction #ForexTrading #SwingTrading #TechnicalAnalysis #Kabhi_TA_Trading
✅ If you find this analysis helpful, don’t forget to like 👍, comment 💬, and follow 🔔 for more updates.
📌 Disclaimer: This analysis is for educational purposes only. Not financial advice. Trade at your own risk.
EURAUD trade ideas

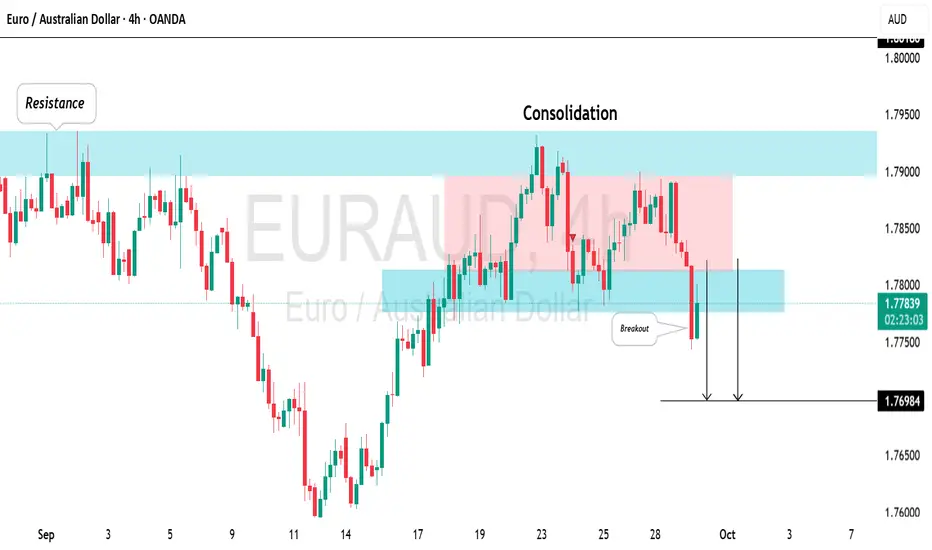
EUR/AUD: Another Bearish Forex Pair to TradeAnother pair that appears to be showing a strong bearish trend, in my assessment, is 📉EURAUD.
Based on price action analysis:
The market had been experiencing a positive trend, but it began to lose momentum as it approached a significant horizontal resistance level.
Subsequently, the price began to consolidate before declining, ultimately violating a horizontal support level within the trading range.
The market will probably continue to decline. The next support level is anticipated to be at 1.7698.
26.09.25 Morning ForecastPairs on Watch -
FX:EURAUD
A short overview of the instruments I am looking at for today, multi-timeframe analysis down to what I will be looking at for an entry. Enjoy!

EUR/AUD - Selling Pressure Below 1.7850 (22.09.2025)#EURAUD #Forex #Trading #TechnicalAnalysis
EUR/AUD – Channel Breakout Pattern (30M)
EUR/AUD has broken below the rising channel, confirming a bearish reversal after completing a Head & Shoulders pattern at the top.
🔹 Market Structure:
Clear rejection from the resistance zone (1.7850 – 1.7860)
Breakdown of the bullish channel support
Head & Shoulders formation adding to bearish momentum
🔹 Key Levels:
1st Support: 1.7715
2nd Support: 1.7710
📉 Trading Idea:
As long as EUR/AUD stays below the channel resistance, selling pressure could drive price toward the support levels.
🎁 Please hit the like button and
🎁 Leave a comment to support for My Post !
Your likes and comments are incredibly motivating and will encourage me to share more analysis with you.
Best Regards, KABHI_TA_TRADING
Thank you.

EUR/AUD: Bullish Trend ContinuesI spotted a promising bullish signal on the 📈EURAUD, following a recent price correction.
The price action has established a double bottom formation, subsequently surpassing its neckline, along with a resistance line associated with a falling wedge pattern.
It seems highly probable that the market will experience an upward movement. The target is set at 1.7933.

EUR/AUD: Confirmed Bearish Reversal?!EURAUD appears to be providing significant bearish signals, Following a test of a strong daily horizontal resistance,
I have observed both a double top and a rising parallel channel pattern.
The price has broken below the horizontal neckline and a trend line, closing below both.
I anticipate a continued bearish movement towards 1.7730.

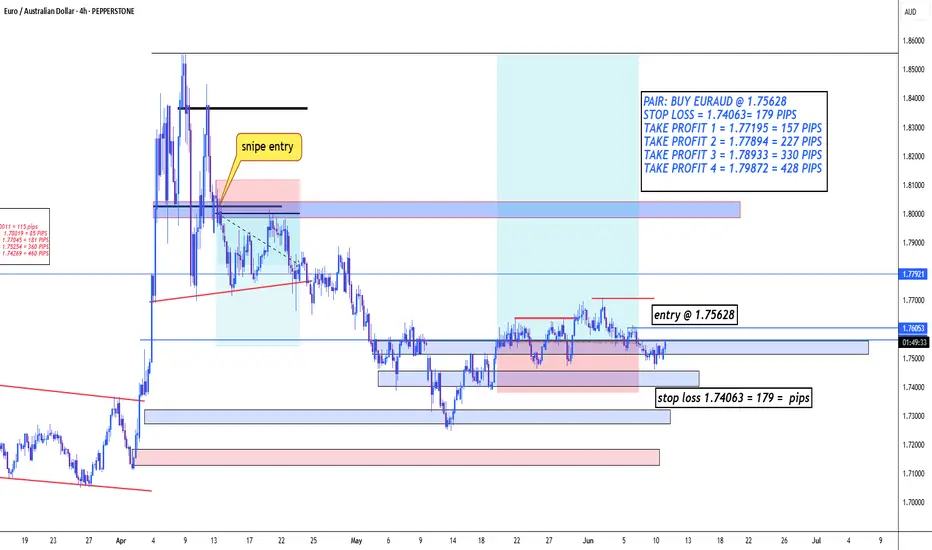
EURAUD--LONG--Bullish cont.
--Bullish in M,W,D timeframes
--tp and entry levels are as shown on chart

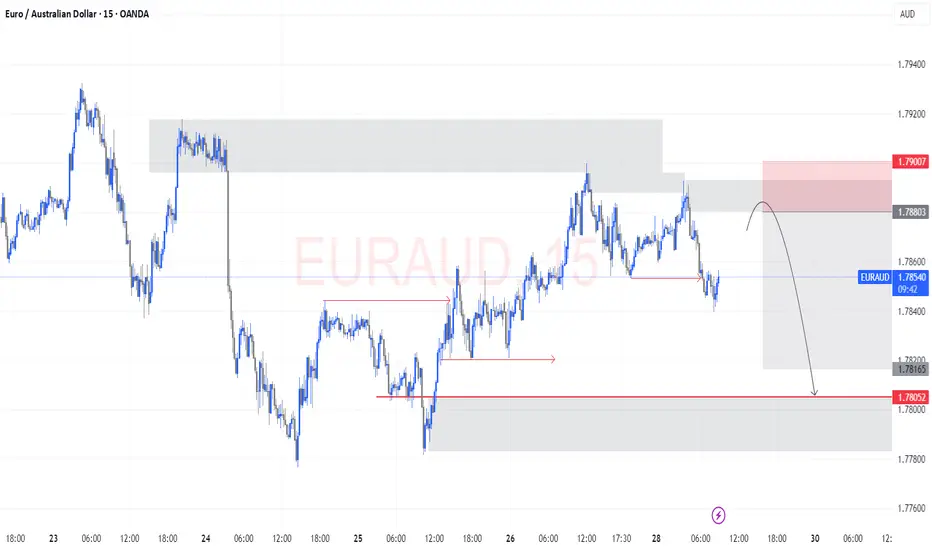
EURAUD Short Setup (M15)Price recently swept liquidity above the previous high and mitigated into a supply zone, aligning with the bearish order flow from higher timeframes. After the displacement to the downside, we now anticipate a retracement back into the supply area (POI) before continuation lower.
Market Structure:
Clear break of structure (BOS) to the downside after liquidity grab.
Lower highs forming, maintaining bearish order flow.
Supply Zone (POI):
Price is expected to retrace back into the refined M15 supply zone (highlighted in red).
This is the optimal entry area for a short, with stop loss just above the zone.
Liquidity:
Buy-side liquidity above the recent highs has been taken.
Sell-side liquidity resting below 1.78052 becomes the next target.
Targets:
First TP: 1.78052 (resting liquidity level).
Extended TP: Deeper demand zone around 1.77800.
Trade Idea:
Wait for price to retrace into supply.
Execute short entry within the POI.
Manage trade by scaling out at liquidity levels and holding partials for extended target.
EURAUD to find buyers at current support?EURAUD - 24H expiry
Price action looks to be forming a bottom.
Short term RSI has turned positive.
Risk/Reward would be poor to call a buy from current levels.
A move through 1.7859 will confirm the bullish momentum.
The measured move target is 1.7975.
We look to Buy at 1.7800 (stop at 1.7725)
Our profit targets will be 1.7950 and 1.7975
Resistance: 1.7850 / 1.7900 / 1.7950
Support: 1.7825 / 1.7800 / 1.7750
Risk Disclaimer
The trade ideas beyond this page are for informational purposes only and do not constitute investment advice or a solicitation to trade. This information is provided by Signal Centre, a third-party unaffiliated with OANDA, and is intended for general circulation only. OANDA does not guarantee the accuracy of this information and assumes no responsibilities for the information provided by the third party. The information does not take into account the specific investment objectives, financial situation, or particular needs of any particular person. You should take into account your specific investment objectives, financial situation, and particular needs before making a commitment to trade, including seeking, under a separate engagement, as you deem fit.
You accept that you assume all risks in independently viewing the contents and selecting a chosen strategy.
Where the research is distributed in Singapore to a person who is not an Accredited Investor, Expert Investor or an Institutional Investor, Oanda Asia Pacific Pte Ltd (“OAP“) accepts legal responsibility for the contents of the report to such persons only to the extent required by law. Singapore customers should contact OAP at 6579 8289 for matters arising from, or in connection with, the information/research distributed.

euraudnice little asian play on euraud.. we have a nice inverted h and s
nice 4hr swing to the upside. retracement phase complete. two nice breaker blocks to confirm our entry for the buy..
EURAUDToday’s Elliott Wave outlook for EURAUD suggests the pair is completing its corrective structure, with potential for a bullish continuation if key support levels hold. Traders should monitor closely for confirmation signals.

EURAUD EURAUD PRICEACTION AND STRUCTURE ON WEEKLY TIMEFRAME.
KEY SELL zone @1.97255
key sell zone @ 1.88396
key buy @1.76469
ECB RATE ECB RATE =Deposit Facility: 2.00% · Main refinancing operations (Fixed Rate Tender): 2.15% · Marginal Lending: 2.40%.
EU10Y @2.744%
ECB HEAD @Christine Lagarde.
The Reserve Bank of Australia (RBA) current cash rate as of September 2025 is 3.60%. The RBA has held the cash rate steady at this level in their September meeting, following three rate cuts earlier this year. Market expectations indicate the next possible rate cut could come in November 2025, potentially lowering the rate to around 3.35%.
RBA Governor
The current Governor of the Reserve Bank of Australia is Michele Bullock. She took office as the first female Governor in September 2023. Michele Bullock emphasizes sustainable control of inflation within the target band and balancing economic growth and employment in her policy approach.
Inflation recently eased but remains within the target range, prompting the RBA to pause rate changes to monitor sustained price stability.
The RBA’s focus is maintaining low and stable inflation while considering the broader impact on households and businesses.
RBA CASH RATE = 3.60%
AU10Y = 4.355%
INTEREST RATE DIFFERENTIAL =2.0%-3.60%= -1.60%
BOND YIELD DIFFERENTIAL = 2.744%-4.33%= 1.58%
FROM INTEREST RATE AND BOND YILED PERSPECTIVE AUD HAVE A TECHNICAL ADVANTAGE .
BUT THE EURZONE ECONOMIC OUTLOOK IS STRONGER THAN AUSTRALIA ECONOMIC OUTLOOK,AUSTRALIA A COMMODITIES RELIANT ECONOMY IS NOT ALAWAY STABLE .
TARRIF IS HURTING COMMODITIES MARKET BACKED BY CHINA TRADE RELATION.
CARRY TRADER ARE CAUTOUS AND TRADERS WILL HAVE BATTER TRADING OPPORTUNITY SCALPING EURAUD ,LOOKING FOR FEW PIPS 30-40PIPS IS BETTER
THE TREND STRENGTH WILL HINGE ON RBA AND ECB POLICY SHIFT.
#EURAUD #AU10Y #EU10Y

How to place your SL & TP levels according to your R:RAll the information you need to find a high probability trade are in front of you on the charts so build your trading decisions on 'the facts' of the chart NOT what you think or what you want to happen or even what you heard will happen. If you have enough facts telling you to trade in a certain direction and therefore enough confluence to take a trade, then this is how you will gain consistency in you trading and build confidence. Check out my trade idea!!
www.tradingview.com

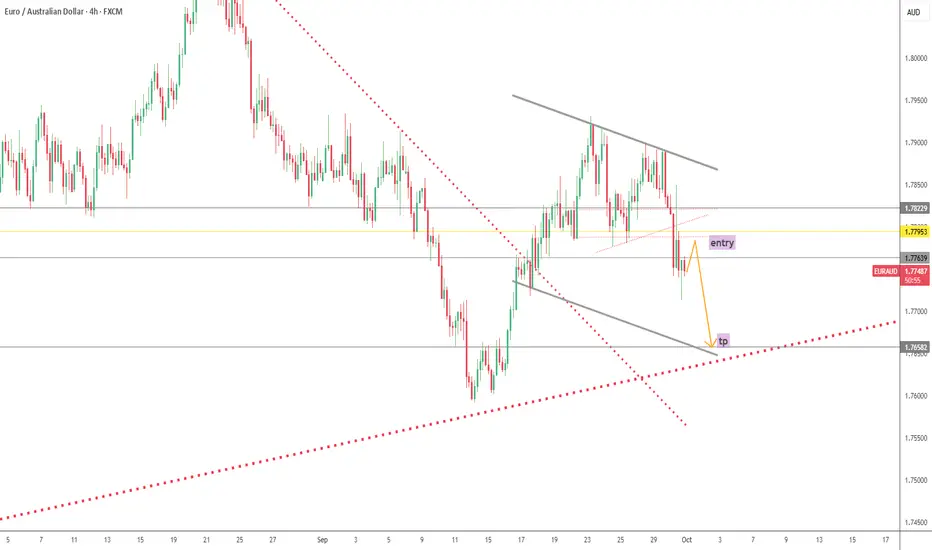
Drop Expectation for EURAUDExpectation drop for EURAUD. Already drop 1st attempt which mean clearing a buy order, and now price approach to drop for 2nd attempt. because at 1st attempt the drop less 'energy', so on the 2nd attempt will take a few time to reaching the target. sorry for bad english.

EUR/AUD LongReasons for long :
Double bottom on 4h timeframe
Price floating on the support zone
Decent candle pattern for bullish engulfing

Possible entry setupThe price had reached an important resistance level (which I didn’t post the analysis for) and reacted well, giving a decent profit. Now it has reached support, and a break of this support could also be a good entry point if you missed the previous move. ✅
EURAUD buy !EURAUD buy trade. Price is at a strong demand area and rejection from strong support at well. It is time to buy this pair with 2% risk. 1:2 risk rewards. I will risk 2% for this trade and expecting 4% return. Always respect money management. Good luck. !

EUR/AUD — Timeframe H1EUR/AUD — H1 Timeframe
Titik Sona Community — update: 24 Sep 2025
Setup BUY 1
Demand Rebound
Setup BUY 2
Continuation to Supply
Setup SELL
Trend Following
Reference chart: view charts on TradingView
Setup BUY 1 (Demand Rebound)
Entry: 1.76773
Stop Loss: 1.76573
Target: 1.77288
Risk/Reward: ± 1 : 5
Rebounding from the H1 demand zone, the chances of a correction are rising in the short term.
Setup BUY 2 (Continuation to Supply)
Entry: 1.77954
Stop Loss: 1.77754
Target: 1.80057
Risk/Reward: ± 1 : 10.5
Further buying towards the above supply zone, following the potential for a large pullback.
Setup SELL (Trend Following)
Entry: 1.77816
Stop Loss: 1.78016
Target: 1.76337
Risk/Reward: ± 1 : 7.4
Sell in the supply area near the trendline channel, in the direction of the main bearish trend.
Technical Reasons
The big structure is still in the channel downtrend.
BUY 1 for a short correction of the nearest demand.
BUY 2 as a continuation to the upper supply area.
SELL remains valid because it follows the main bearish trend.
Pre-Entry Checklist
Wait for confirmation of price action in the zone (rejection / engulfing).
Pay attention to the EUR/AUD high impact news before entry.
Use a maximum risk of 1–2% of the account.
Choose one of the directions according to the market confirmation.
Analyst: Titik Sona Community — 24 Sep 2025

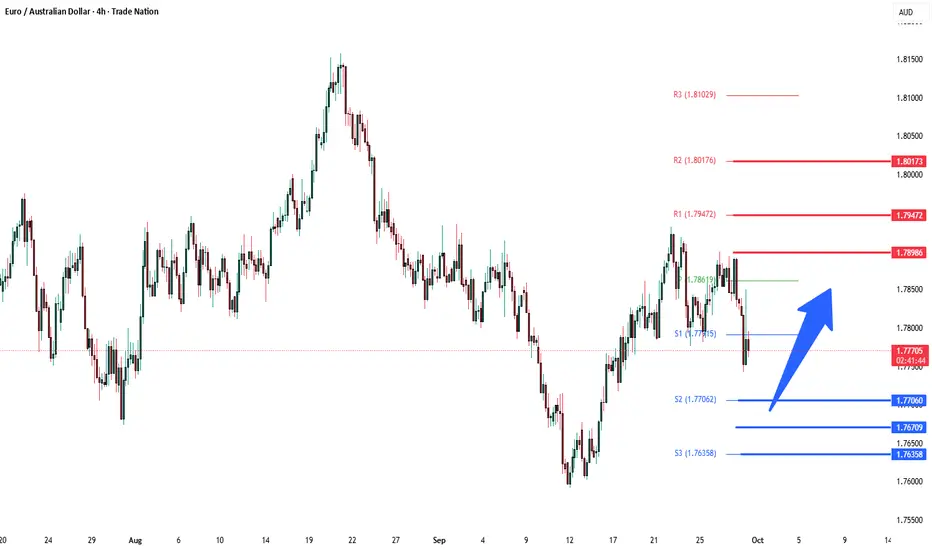
EURAUD corrective pullback supported at 1.7700The EURAUD remains in a bullish trend, with recent price action showing signs of a corrective pullback within the broader uptrend.
Support Zone: 1.7700 – a key level from previous consolidation. Price is currently testing or approaching this level.
A bullish rebound from 1.7700 would confirm ongoing upside momentum, with potential targets at:
1.7900 – initial resistance
1.7950 – psychological and structural level
1.8020 – extended resistance on the longer-term chart
Bearish Scenario:
A confirmed break and daily close below 1.7700 would weaken the bullish outlook and suggest deeper downside risk toward:
1.7670 – minor support
1.7635 – stronger support and potential demand zone
Outlook:
Bullish bias remains intact while the EURAUD holds above 1.7700. A sustained break below this level could shift momentum to the downside in the short term.
This communication is for informational purposes only and should not be viewed as any form of recommendation as to a particular course of action or as investment advice. It is not intended as an offer or solicitation for the purchase or sale of any financial instrument or as an official confirmation of any transaction. Opinions, estimates and assumptions expressed herein are made as of the date of this communication and are subject to change without notice. This communication has been prepared based upon information, including market prices, data and other information, believed to be reliable; however, Trade Nation does not warrant its completeness or accuracy. All market prices and market data contained in or attached to this communication are indicative and subject to change without notice.
EURAUD ON 4H , AFTER THE BOUNCE FROM 1.7506⚠️ Disclaimer:
I’m still a beginner in technical analysis. The reason why I share this chart is mainly to educate myself and learn through practice. I would be very happy to hear reviews, corrections, or advice from more professional traders here on TradingView.
🙏 Every feedback helps me improve as a trader.
📌 EURAUD – 4H Analysis after Bounce from 1.7506
After bouncing strongly from the 1.7506 support zone, EURAUD has been trading inside a rising channel on the 4H timeframe. Currently, the pair is testing the upper boundary of this channel, around the 1.7810 – 1.7830 region, which also aligns with the Fibonacci 0.382 retracement of the previous bearish leg.
This area represents a confluence of resistance, including:
The upper channel trendline
1.7830 supply zone
Short-term overbought signals on oscillators
📉 Bearish Scenario:
If price fails to break above 1.7830 – 1.7860 and rejection candles appear, a correction move toward the mid-channel or Fibonacci 0.5 (1.7729) and 0.618 (1.7695) levels can be expected. A deeper retracement could retest the 1.7600 demand zone if bearish momentum grows.
📈 Bullish Scenario:
A confirmed breakout and 4H close above 1.7860 would invalidate the short-term bearish view and may open the door toward 1.7950 – 1.8000 resistance levels.

EURAUD - Short Term Sell IdeaM15 - Strong bearish move.
No opposite signs.
Currently it looks like a pullback is happening.
Expecting bearish continuation until the two Fibonacci resistance zones hold.
If you enjoy this idea, don’t forget to LIKE 👍, FOLLOW ✅, SHARE 🙌, and COMMENT ✍! Drop your thoughts and charts below to keep the discussion going. Your support helps keep this content free and reach more people! 🚀
-------------------------------------------------------------------------------------------------------------------

Bearish reversal off major resistance?EUR/AUD has rejected off the pivot and could fall to the pullback support.
Pivot: 1.79173
1st Support: 1.77007
1st Resistance: 1.80540
Disclaimer:
The above opinions given constitute general market commentary, and do not constitute the opinion or advice of IC Markets or any form of personal or investment advice.
Any opinions, news, research, analyses, prices, other information, or links to third-party sites contained on this website are provided on an "as-is" basis, are intended only to be informative, is not an advice nor a recommendation, nor research, or a record of our trading prices, or an offer of, or solicitation for a transaction in any financial instrument and thus should not be treated as such. The information provided does not involve any specific investment objectives, financial situation and needs of any specific person who may receive it. Please be aware, that past performance is not a reliable indicator of future performance and/or results. Past Performance or Forward-looking scenarios based upon the reasonable beliefs of the third-party provider are not a guarantee of future performance. Actual results may differ materially from those anticipated in forward-looking or past performance statements. IC Markets makes no representation or warranty and assumes no liability as to the accuracy or completeness of the information provided, nor any loss arising from any investment based on a recommendation, forecast or any information supplied by any third-party.
