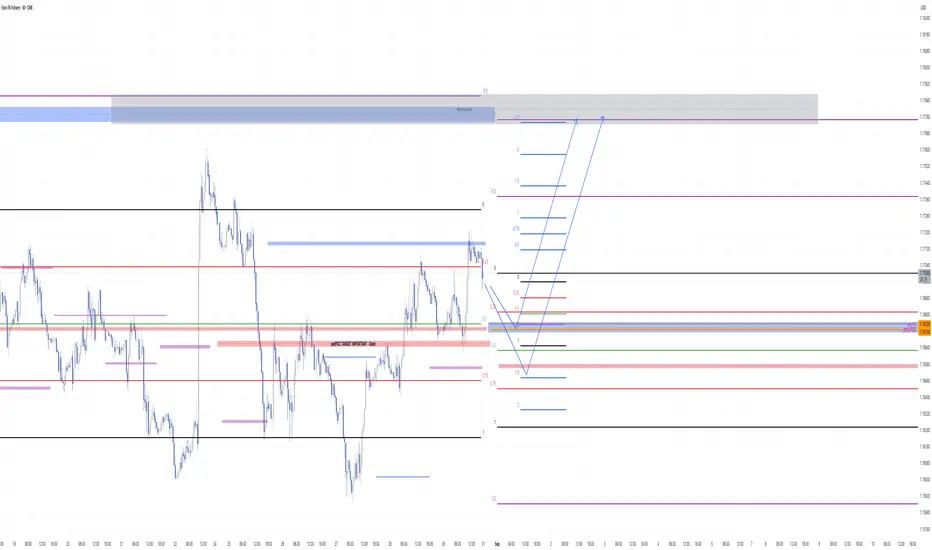
EUR Futures analysis I am looking for to continuing compression at EUR futures (EurUsd) chart
According to Engulf of the lower flag limit; i am waiting for continue drop.
This analysis could mean that US inflation could spike again on Thursday's news.
We'll just have to wait and see.
FCEUX2026 trade ideas

Volatility at rock bottom: is a straddle the right move?Markets often fall into a familiar seasonal pattern. As summer advances, trading volumes thin out, implied volatility fades, and investors drift into a sense of calm. Yet history shows that this period of tranquility rarely lasts. September and October have traditionally been months of renewed turbulence, often catching complacent investors off guard.
With implied volatility currently trading at depressed levels, option premiums are effectively “on sale.” This creates an attractive window for strategies that do not rely on predicting direction but instead position for the return of volatility. Chief among them is the straddle.
What exactly is a straddle?
A straddle is one of the simplest volatility strategies in options markets. It involves buying both a call and a put option with the same strike price and expiration date. The payoff structure is straightforward:
If the underlying asset rises sharply, the call option gains.
If the underlying falls, the put option benefits.
If the market stagnates, the loss is limited to the combined premium.
This makes the straddle an efficient way of “buying volatility.” The key appeal is that it does not require choosing a direction, only anticipating that the market will eventually move.
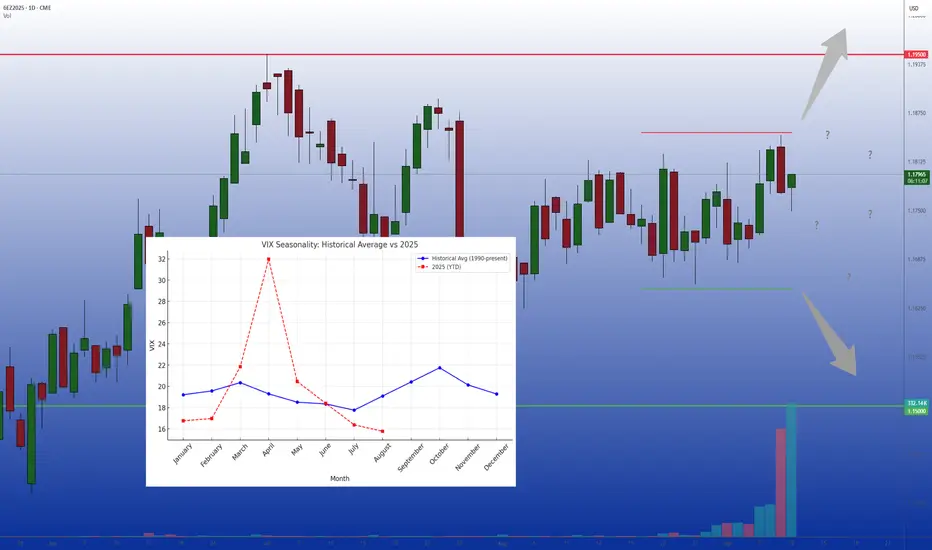
The calm before the storm
History provides a strong case for seasonality in volatility. Since 1990, the VIX has tended to bottom in June and July before rebounding in September and peaking in October.
The year 2025 has so far mirrored this cycle. After a turbulent spring, summer brought an unusually long stretch of calm. By July, implied volatility had retreated to some of the lowest comfort levels in years. But if history is any guide, such stability is more a pause than a new equilibrium.
Foreign exchange markets show a similar pattern. The CVOL G5 FX index, tracking implied volatility on Euro, Pound, Yen, Australian Dollar, and Canadian Dollar futures, often displays sharp bursts of activity around macro or geopolitical shocks, followed by prolonged lulls. The current quiet looks very much like another such lull.
Why low IV matters
Implied volatility is the primary input in option pricing. When IV is low, option premiums fall; when IV rises, those same contracts become far more expensive. This makes timing important.
An August straddle is usually cheaper than one initiated in September. Buying optional exposure now means paying a “discounted” premium while retaining the potential to benefit from a rebound in volatility during the fall.
No need for directional bets
One of the main attractions of the straddle is that it removes the need to guess direction.
For example, an investor might think: “I am unsure whether the euro will rise or fall against the dollar, but I doubt that the summer calm will last.” In such a scenario, a straddle is more appropriate than a directional trade. It captures volatility regardless of the outcome and provides insurance against unexpected moves.
FX as a natural playground
Equity markets tend to see volatility spikes alongside price declines, but in FX, volatility is far more symmetric. Currency pairs often experience sharp swings in either direction, sometimes triggered by small catalysts such as a central banker’s remark or a surprise data print.
Let’s take the Euro FX contract, December expiry. The price has remained close to 1.175 throughout the summer, but several catalysts could easily break the range in the fall: diverging central bank policies, U.S. protectionist measures, or geopolitical events. Any of these could quickly shift the balance between currencies and force institutional rebalancing.
Because FX markets often move from extended ranges to sudden breakouts, they provide fertile ground for straddle strategies. The investor is not required to predict the breakout direction, only to position for its likelihood.
Another important consideration: listed FX options, such as those traded on CME, generally offer more transparency, standardization, and often lower costs compared with over-the-counter (OTC) FX options. Exchange-traded contracts provide clearer pricing and robust clearing, which makes them particularly well-suited for volatility strategies where premium efficiency matters.
Lessons from seasonality
Volatility is cyclical. Calm phases almost always give way to periods of agitation, sometimes even panic. Over the past 35 years, September has consistently marked a turning point, as investors return from summer breaks and refocus on economic data, central bank policy, and geopolitical events.
The summer of 2025 is no exception. Option premiums are unusually cheap, reflecting a market that assumes the calm will last. But history suggests otherwise. For those who believe turbulence will return, strategies like the straddle offer a simple and cost-efficient way to prepare.
Final thoughts
Complacency is one of the market’s most dangerous traps. While quiet markets encourage investors to lower their guard, volatility rarely stays low for long. With option premiums currently discounted, the coming weeks present an attractive window to position for a return of market movement.
By emphasizing magnitude over direction and by favoring listed options for their transparency and efficiency, the straddle remains one of the most compelling ways to approach the seasonal shift.
---
When charting futures, the data provided could be delayed. Traders working with the ticker symbols discussed in this idea may prefer to use CME Group real-time data plan on TradingView: tradingview.com/cme/ .
This consideration is particularly important for shorter-term traders, whereas it may be less critical for those focused on longer-term trading strategies.
General Disclaimer:
The trade ideas presented herein are solely for illustrative purposes forming a part of a case study intended to demonstrate key principles in risk management within the context of the specific market scenarios discussed. These ideas are not to be interpreted as investment recommendations or financial advice. They do not endorse or promote any specific trading strategies, financial products, or services. The information provided is based on data believed to be reliable; however, its accuracy or completeness cannot be guaranteed. Trading in financial markets involves risks, including the potential loss of principal. Each individual should conduct their own research and consult with professional financial advisors before making any investment decisions. The author or publisher of this content bears no responsibility for any actions taken based on the information provided or for any resultant financial or other losses.
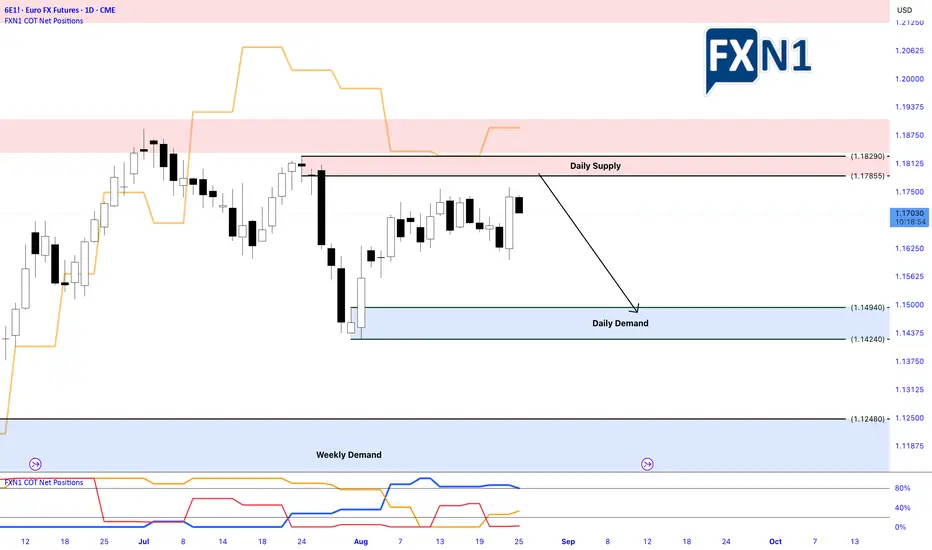
Money on the table ahead of the FedEUR/USD is once again in the spotlight as the Federal Reserve prepares to meet this week. The backdrop is a perceived convergence between Fed and ECB rate paths, narrowing a differential that had long favored the dollar. The euro has regained lost ground after the summer, trading around strategic levels supported by a more balanced macro environment and relative eurozone resilience. A combined reading of fundamentals, technicals, sentiment, and options flows helps refine potential scenarios for the weeks ahead.
Fundamental Analysis
Two main narratives drive EUR/USD. On the U.S. side, inflation has remained stickier than expected. The August CPI rose +0.4% m/m, pushing headline inflation to 2.9% and the core to 3.1%. This persistence reflects tariff- and food-driven pressures, leaving the Fed juggling inflation control with signs of weakening in the labor market. Job creation has slowed, and unemployment claims have edged higher, complicating the policy mix.
Markets expect a 25bp rate cut in September, which would mark the start of a cautious easing cycle. Beyond that, uncertainty dominates: some see another move before year-end, others expect a pause as the Fed reassesses inflation and growth dynamics.
In Europe, the ECB has held its deposit rate steady at 2%, underscoring that disinflation is in progress while acknowledging inflation will remain slightly above target in 2025 (2.1% forecast). President Christine Lagarde described the economy as “in a good place,” lowering the likelihood of aggressive cuts. As a result, the policy spread between the Fed and ECB is shrinking, undermining the dollar’s yield advantage and lending structural support to the euro.
Technical Analysis
The December 2025 Euro FX futures contract (6EZ5) is currently challenging resistance at the upper boundary of a tight 1.1650–1.1850 range. The volume profile highlights a dense cluster between 1.1775 and 1.1800, forming key short-term support. As long as this zone holds, the technical bias leans higher.
A clean break above 1.1850 would likely accelerate momentum toward the psychological 1.20–1.2050 zone, already cited by technical analysts as the next upside target.
On the downside, 1.1670 is the pivot for validation. A sustained move below would undermine the bullish scenario and risk a return toward sub-1.1600 levels. For now, however, support continues to attract buyers, keeping the uptrend intact.
Sentiment Analysis
Broker positioning data shows retail traders remain heavily short EUR/USD, a contrarian indicator favoring further gains. Importantly, the rally is not built on a fragile short squeeze but on steady accumulation, which makes it more sustainable.
Commitments of Traders (COT) reports reinforce this: asset managers remain long euro, dealers are short for hedging, and leveraged funds sit closer to neutral. Institutional flows, in other words, lean supportive.
Low implied volatility further highlights the lack of market conviction in a sharp downside break. Investors appear more concerned with missing an upside move than with protecting against euro weakness, which strengthens the bullish tilt.
Options Activity
In the OTC market, risk reversals are slightly skewed in favor of euro calls, suggesting more demand for upside protection. This fits neatly with both fundamentals and positioning.
At the CME, open interest paints a similar picture:
A Put/Call ratio tilted toward calls
Heavy concentrations at 1.1800 and 1.1850 strikes, creating upward magnetism
Limited put interest between 1.1650–1.1700, only relevant if spot weakens sharply
Low implied volatility, signaling no expectation of outsized moves before the Fed meeting
Altogether, this suggests that 1.1850 is the immediate gravitational level, with room for extension toward 1.20 if momentum persists.
Trade Idea: Long 6EZ5
Directional setup:
Entry: Buy on dips toward 1.1775
Invalidation: Close below 1.1670
Take Profit: 1.1975–1.2000 (psychological milestone and measured target)
This strategy combines institutional support visible in COT reports, option flows skewed toward the upside, strong technical zones, and narrowing Fed–ECB spreads that erode the dollar’s advantage.
Final Thoughts
The Fed’s September decision is more than a routine policy update. It could mark a turning point for global FX dynamics. U.S. inflation remains uncomfortably sticky, but weakening jobs data points toward gradual easing. In contrast, the ECB is signaling stability and relative confidence. This policy convergence narrows the rate gap, historically a pillar of dollar strength, and bolsters the medium-term case for euro appreciation.
Technically, the market is consolidating above robust support levels, while sentiment indicators and option positioning both lean bullish. The December 2025 contract captures this balance: a market with strong foundations, low volatility expectations, and option flows pointing toward a breakout higher.
The key tactical question is whether the Fed provides enough dovish tone to unlock the upside. If EUR/USD breaks decisively above 1.1850, momentum toward 1.20 could unfold quickly. In the short term, caution is warranted heading into the FOMC, but unless an external shock emerges, the combined weight of fundamentals, technicals, and sentiment continues to argue for a stronger euro in the weeks ahead.
---
When charting futures, the data provided could be delayed. Traders working with the ticker symbols discussed in this idea may prefer to use CME Group real-time data plan on TradingView: tradingview.com/cme/ .
This consideration is particularly important for shorter-term traders, whereas it may be less critical for those focused on longer-term trading strategies.
General Disclaimer:
The trade ideas presented herein are solely for illustrative purposes forming a part of a case study intended to demonstrate key principles in risk management within the context of the specific market scenarios discussed. These ideas are not to be interpreted as investment recommendations or financial advice. They do not endorse or promote any specific trading strategies, financial products, or services. The information provided is based on data believed to be reliable; however, its accuracy or completeness cannot be guaranteed. Trading in financial markets involves risks, including the potential loss of principal. Each individual should conduct their own research and consult with professional financial advisors before making any investment decisions. The author or publisher of this content bears no responsibility for any actions taken based on the information provided or for any resultant financial or other losses.
Euro Futures (6E) - Technical Analysis Report - 20250908Analysis Date: September 8, 2025
Current Price: 1.1742
Market Session: Post-Market Analysis
---
Executive Summary
Euro Futures presents the strongest technical setup among analyzed markets, with exceptional execution chart alignment despite moderate institutional positioning. The currency pair has emerged from a major bottoming pattern with validated bullish momentum signals across all timeframes. While institutional accumulation is less pronounced than in commodity markets, the technical breakout quality and central bank policy divergence create compelling risk/reward opportunities.
---
Quarterly Volume Profile Analysis
Institutional Positioning Intelligence
The quarterly volume profile (Q3 2025) reveals moderate but strategically positioned institutional activity in the Euro:
Primary Institutional Activity Zone: 1.1550-1.1700
Moderate blue volume concentration representing institutional positioning during major low formation
Current price (1.1742) trades at upper boundary of institutional accumulation zone
Volume profile shows classic bottoming pattern with accumulation at major support levels
Institutional activity concentrated around key technical support levels from previous cycles
Volume Profile Architecture:
Core Accumulation: 1.1580-1.1650 (primary institutional positioning)
Extended Support: 1.1450-1.1550 (secondary institutional interest)
Breakout Level: 1.1700-1.1750 (current resistance/breakout zone)
Void Zone: Above 1.1800 (minimal resistance, potential acceleration territory)
Resistance Structure Analysis:
1.1750-1.1800: Initial resistance with mixed volume activity
1.1850-1.1900: Moderate yellow volume indicating previous distribution
1.1950+: Historical distribution zones from earlier 2025 highs
Price Structure Context
Historical Pattern Recognition:
The current Euro setup displays textbook currency reversal characteristics following a major multi-month decline. The institutional accumulation at 1.1550-1.1700 represents strategic positioning by smart money during the formation of a significant low, typical of major currency cycle turning points.
Critical Structure Validation:
Institutional Floor: 1.1450 represents absolute lower boundary of smart money positioning
Volume Point of Control: 1.1620 shows peak institutional activity within accumulation zone
Breakout Validation: Current price above institutional accumulation confirms technical breakout
Risk Definition: Clear institutional boundaries provide precise risk management parameters
Central Bank Policy Context
Policy Divergence Supporting Euro Strength:
European Central Bank maintaining restrictive policy stance
Federal Reserve approaching policy pivot with potential dovish shift
Interest rate differential dynamics favoring Euro in medium term
Quantitative tightening policies supporting European currency fundamentals
---
Execution Chart Technical Analysis
Current Technical Configuration - EXCEPTIONAL BULLISH ALIGNMENT
DEMA Analysis - STRONGEST BULLISH SIGNAL IN ANALYZED MARKETS:
Black Line (Fast DEMA 12): Currently at 1.1742
Orange Line (Slow DEMA 20): Currently at 1.1712
Configuration: Perfect bullish crossover with expanding gap
Trend Bias: Strongest technical momentum across all analyzed markets
DMI/ADX Assessment - CONFIRMED TRENDING CONDITIONS:
ADX Level: 35+ indicating strong directional movement
+DI vs -DI: +DI clearly dominant over -DI with expanding spread
Momentum Direction: Confirming sustained bullish bias with conviction
Trend Strength: ADX rising confirms institutional and technical alignment
Stochastic Analysis - HEALTHY MOMENTUM STRUCTURE:
Tactical Stochastic (5,3,3): Bullish configuration with room for extension
Strategic Stochastic (50,3,3): Confirming longer-term bullish momentum shift
Divergence Analysis: No negative divergences, clean momentum structure throughout
Support and Resistance Levels
Immediate Technical Levels:
Current Support: 1.1710 (DEMA 20 orange line)
Key Support: 1.1680 (recent breakout consolidation)
Major Support: 1.1620 (institutional accumulation core)
Immediate Resistance: 1.1780 (near-term extension target)
Key Resistance: 1.1820 (major resistance zone)
Major Resistance: 1.1900 (significant distribution zone)
---
Trading Scenarios and Setup Criteria
Scenario 1: Continuation Long Setup (PRIMARY)
Optimal Conditions for Long Entry:
DEMA bullish maintenance: Black line remaining above orange line with gap expansion
DMI confirmation: +DI sustaining dominance over -DI with strengthening ADX
Breakout validation: Price holding above 1.1700 breakout level
Volume confirmation: Increased volume supporting upward momentum
Policy support: Central bank divergence maintaining fundamental backdrop
Entry Protocol:
Primary Entry: Current levels 1.1740-1.1760 (validated breakout zone)
Secondary Entry: 1.1710-1.1720 on any pullback to DEMA support
Position Sizing: Aggressive 2.5% account risk given exceptional technical setup
Stop Loss: Below 1.1680 (breakout failure)
Profit Targets:
Target 1: 1.1820 (first major resistance) - Take 40% profits
Target 2: 1.1900 (distribution zone approach) - Take 30% profits
Target 3: 1.1980-1.2000 (major resistance complex) - Trail remaining 30%
Scenario 2: Pullback Accumulation Setup (SECONDARY)
Conditions for Pullback Entry:
Price retracement to 1.1700-1.1720 breakout support zone
DEMA holding bullish configuration during pullback
Stochastic oversold providing tactical entry signal
Volume profile respect at breakout support levels
Pullback Setup Parameters:
Entry Range: 1.1700-1.1720 (breakout support zone)
Stop Loss: Below 1.1680 (breakout invalidation)
Targets: Same as primary scenario with enhanced risk/reward
Position Sizing: Maximum allocation given superior entry point
Scenario 3: Acceleration Breakout Setup (AGGRESSIVE)
Breakout Trading Framework:
Acceleration Level: Above 1.1800 (void zone entry)
Volume Confirmation: Significant volume expansion supporting breakout
Technical Validation: DEMA gap expansion with ADX above 40
Momentum Persistence: +DI expanding dominance over -DI
Acceleration Parameters:
Entry: 1.1805-1.1820 on confirmed acceleration
Stop: Below 1.1750 (failed acceleration)
Extended Targets: 1.1950, 1.2000, 1.2050+
Position Management: Trail stops using 0.004 structure levels
---
Risk Management Protocols
Position Sizing Guidelines
Aggressive Approach (Recommended for 6E):
Maximum Risk: 2.5% of account (increased allocation due to exceptional technical quality)
Contract Calculation: Account Size × 0.025 ÷ (Stop Distance × $12.50 per pip)
Example: $100,000 account with 60-pip stop = 33 contracts maximum
Rationale: Strongest technical setup justifies aggressive allocation
Stop Loss Hierarchy
Tactical Stop: 1.1710 (DEMA support)
Strategic Stop: 1.1680 (breakout support)
Emergency Stop: 1.1650 (institutional accumulation boundary)
Profit Management Framework
Systematic Profit Taking:
First Target (40%): Lock in profits at initial resistance zone
Second Target (30%): Capture extended move through distribution areas
Final Position (30%): Trail for potential acceleration beyond 1.2000
Trail Stop Method: Use 0.004 structure chart levels once in profit
---
Market Context and External Factors
Fundamental Catalysts Supporting Euro Strength
Central Bank Policy Dynamics:
ECB maintaining restrictive stance longer than Fed
Interest rate differential shifting in favor of Euro
Quantitative tightening supporting currency fundamentals
Inflation dynamics favoring European monetary policy
Economic Factors:
European energy security improvements reducing volatility
Manufacturing sector stabilization supporting economic outlook
Current account dynamics favoring Euro strength
Political stability improving investor confidence
Technical Market Structure
Currency Market Positioning:
Speculative positioning showing Euro oversold conditions reversing
Commercial hedger activity supporting Euro strength
Cross-currency relationships confirming Dollar weakness
Volatility patterns suggesting sustained directional move
---
Monitoring Checklist and Alert Levels
Daily Monitoring Requirements
DEMA Configuration: Maintain bullish black above orange relationship
Breakout Respect: Confirm price behavior above 1.1700 breakout level
Volume Analysis: Monitor for volume expansion on upward moves
Central Bank Events: ECB and Fed policy statements, economic data releases
Dollar Correlation: Monitor relationship with DXY and other major currency pairs
Critical Alert Levels
Bullish Escalation Alerts:
Break above 1.1800 with volume expansion
DEMA gap expansion beyond 30 pips
+DI moving above 40 with ADX persistence above 40
ECB hawkish policy statements supporting fundamental backdrop
Risk Management Alerts:
DEMA bearish crossover (black below orange)
Break below 1.1700 breakout support level
ADX declining below 25 indicating momentum loss
Fed policy pivot announcements affecting interest rate differential
---
Strategic Outlook and Conviction Assessment
Risk/Reward Analysis
Exceptional Setup Characteristics:
Risk: 60 pips to breakout support (1.1680)
Reward: 150+ pips to first major resistance (1.1900+)
Risk/Reward Ratio: 2.5:1 minimum, potential 4:1+
Probability Assessment: High (80%+) based on technical breakout quality
Portfolio Allocation Recommendation
Maximum Technical Conviction Positioning
Euro Futures represents the highest quality technical setup in the current market environment. The exceptional alignment of DEMA crossover, DMI momentum, and validated breakout above institutional accumulation creates optimal conditions for aggressive positioning. While institutional accumulation is less pronounced than in commodities, the technical execution quality and central bank policy support justify maximum allocation within risk parameters.
Allocation Framework:
Primary Portfolio Weight: 20-25% (maximum technical conviction)
Entry Method: Immediate positioning with scale-in capability on pullbacks
Hold Period: Expect 3-8 week position duration
Exit Strategy: Systematic profit-taking at technical resistance levels
---
Conclusion and Strategic Assessment
Euro Futures presents the strongest technical setup among all analyzed markets, with exceptional DEMA crossover quality and validated breakout above institutional accumulation. While the institutional positioning is less dramatic than commodity accumulation patterns, the technical execution signals are pristine and supported by favorable central bank policy dynamics. Current positioning above breakout support offers superior risk/reward characteristics with clearly defined parameters for both profit-taking and risk management.
Implementation Priority: Immediate aggressive positioning recommended - this technical setup quality represents the gold standard for momentum-based entries with institutional validation.
Next Review: Daily monitoring of DEMA configuration and breakout level respect
Position Management: Systematic profit-taking protocol with trailing stops at technical levels
---
Important Disclaimer
Risk Warning and Educational Purpose Statement
This analysis is provided for educational and informational purposes only and does not constitute financial advice, investment recommendations, or trading signals. All trading and investment decisions are solely the responsibility of the individual trader or investor.
Key Risk Considerations:
Futures trading involves substantial risk of loss and is not suitable for all investors
Past performance does not guarantee future results
Market conditions can change rapidly, invalidating any analysis
Leverage can amplify both profits and losses significantly
Individual financial circumstances and risk tolerance vary greatly
Professional Guidance: Before making any trading decisions, consult with qualified financial advisors, conduct your own research, and ensure you fully understand the risks involved. Only trade with capital you can afford to lose.
Methodology Limitations: Volume profile analysis and technical indicators are tools for market assessment but are not infallible predictors of future price movement. Market dynamics include numerous variables that cannot be fully captured in any single analytical framework.
The views and analysis presented represent one interpretation of market data and should be considered alongside other forms of analysis and individual judgment.
Euro for week 15-20/09/2025Mixed signals here. We can go either way but I favour the bearish side due to "unfinished business down there. Have to watch Monday and Tuesday to give me a clearer direction else I'm not interested.
Neutral for now!
Always remember, Caution, Patience and Risk!
GL!
If you like the content give me a follow on X!
Check Bio. Cheers!

Euro ShortThis is my Analysis for Euro/USD, price has Consolidated a lot at this point and there was a break out trapping a lot of Positions now we should see a break lower

return to proven buyers provides entry at market edge 1->3 : buyers number 2 proven
next ?
* obv break bb lower deviation = bullish
* hidden divergence +oversold : rsi + mfi
* rejection from vwap
*test and push above vpoc
*number 4 BB lower deviation break =bullish

London Session EUR/USD Short Short mapped out on my chart shows EUR taking out highs and sweeping the prev high OB and targeting lower levels of liq and prev session lows.

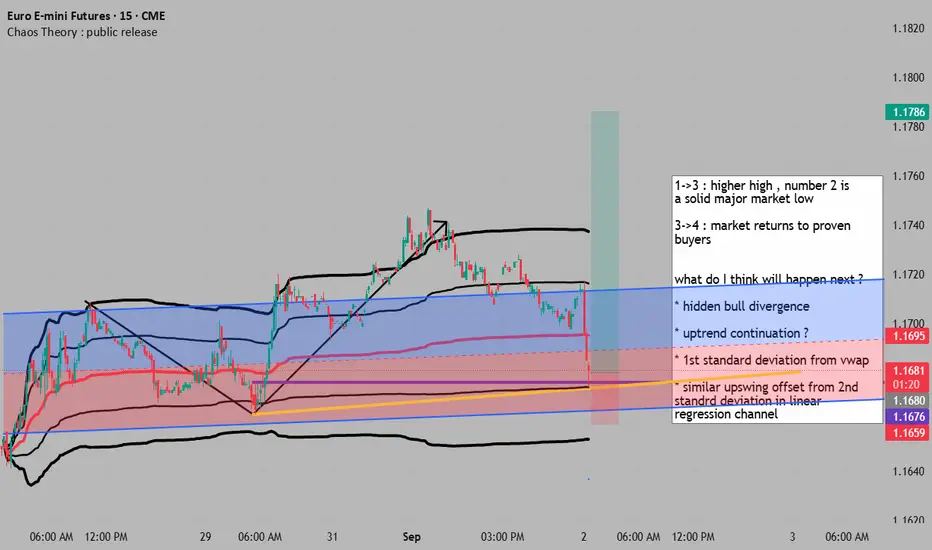
return to solid buyers presents a continuation play 1->3 : higher high , number 2 is
a solid major market low
3->4 : market returns to proven buyers
what do I think will happen next ?
* hidden bull divergence
* uptrend continuation ?
* 1st standard deviation from vwap
* similar upswing offset from 2nd standrd deviation in linear regression channel
EUR LONGDXY
2 main SELL directional confirmations - 12hr ascending flag with 3day & 8hr descending trend lines
1 supportive SELL direction - higher high & higher low on smaller 2hr time frame
2 entry confirmations - Support turned Resistance and flag retest at the same level.
EURO
1 main BUY directional confirmation - 2hr ascending trend
1 supportive BUY directional confirmation - Higher High & Higher Low
1 entry BUY confirmation - 2hr Resistance turned Support
Also a future crossover on the RSI indicating a reversal + weaker euro on currency strength.
EURUSD entered @2pm GMT
entry - 1.1710, SL - 1.695, TP - 1.1755
EUROFUTURES entered @2pm GMT
entry - 1.1720, SL - 1.705, TP 1.765

Bullish on EU for week 1-7/09 2025I have to targets lower that I want to see price reach and show willingness to turn bullish!
Price might even go higher than my target!
EURUSD SetUp-Market Analysis
Areas of Interest and Macroeconomic Context
The EUR/USD pair highlights two key technical areas of interest that warrant attention for short- and medium-term trading strategies.
With the start of a new month, caution is advised, as initial price movements may involve significant pullbacks toward areas of higher liquidity or relevant support/resistance zones.
The latest Commitment of Traders (COT) report indicates an increase in long positions by large speculators, suggesting a bullish bias in institutional sentiment . This positioning should be evaluated within the context of both technical and fundamental analysis to anticipate potential market movements. Fundamental Factors Influencing Market Sentiment
Recent U.S. economic data has had a notable impact on the EUR/USD pair, reinforcing expectations of a weakening U.S. dollar : Weak Economic Data: The Chicago PMI and the University of Michigan Consumer Confidence Index fell short of expectations, fueling speculation about a potential interest rate cut by the Federal Reserve (Fed).
Pressure on the Dollar: Recent inflation data, combined with dovish remarks from the Fed, has heightened expectations of a more accommodative monetary policy, weakening the dollar against the euro.
EUR/USD Movement: As a result, the pair has approached the upper end of its recent range, driven primarily by dollar weakness.
#EURUSD #Forex #MarketAnalysis #Trading #Dollar #Euro #CurrencyMarket #COT

EURUSDEUR/USD is looking heavy. COT shows traders leaning too short the dollar while price action keeps favoring USD strength. Add in weakening eurozone data, and this pair looks ripe for a deeper move lower. Momentum favors the bears.

EUR: Waiting for Clarity in DXY and DirectionLast week, the 6E1! (Euro Futures / EUR/USD) closed with a solid bullish candle, successfully breaking through a key supply zone, signaling strong upward momentum. However, as the new week begins, the market has shifted to bearish pressure, indicating some uncertainty and potential consolidation.
The current situation across currency pairs against the USD remains ambiguous. The DXY dollar index shows mixed signals: on one hand, there is an increase in bullish positions among non-commercial traders, while on the other hand, there’s a decrease in bearish bets. Meanwhile, for the EUR and other currencies, non-commercial traders are increasing their bullish positions, suggesting a possible shift toward dollar weakness or euro strength. Despite these mixed signals, the major supply and demand zones highlighted on my charts remain unchanged.
Given the conflicting data and the current market volatility, I believe it’s prudent to wait until the end of August before making any significant trading decisions. The upcoming weeks should provide clearer insights into the market’s direction, especially as traders and institutions reassess their positions. For now, I will refrain from opening new trades or considering any currency pairs until the overall trend and the direction of the DXY dollar index become more evident. Patience and careful observation will be key in navigating the upcoming market movements.
✅ Please share your thoughts about EUR in the comments section below and HIT LIKE if you appreciate my analysis. Don't forget to FOLLOW ME; you will help us a lot with this small contribution.
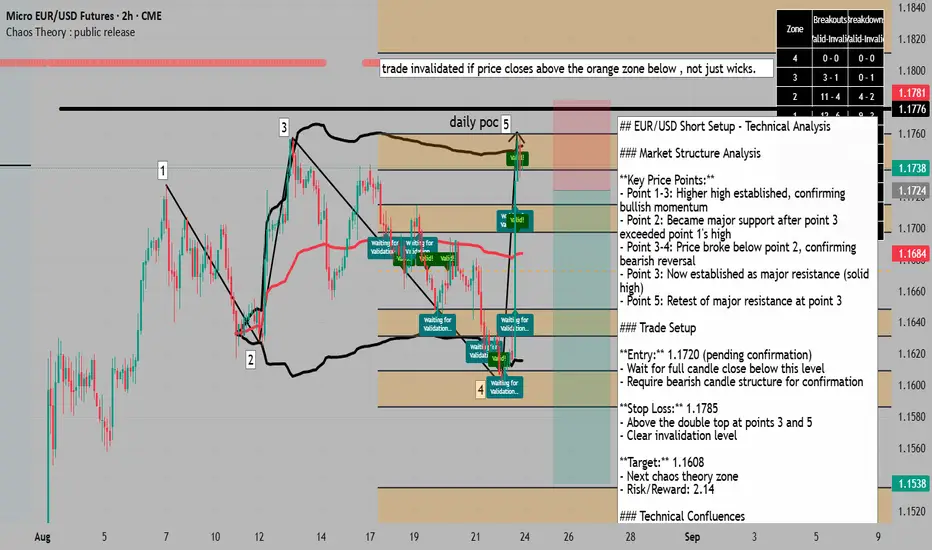
support broken, lower TF potentially joining major =SELL trend## EUR/USD Short Setup - Technical Analysis
### Market Structure Analysis
**Key Price Points:**
- Point 1-3: Higher high established, confirming bullish momentum
- Point 2: Became major support after point 3 exceeded point 1's high
- Point 3-4: Price broke below point 2, confirming bearish reversal
- Point 3: Now established as major resistance (solid high)
- Point 5: Retest of major resistance at point 3
### Trade Setup
**Entry:** 1.1720 (pending confirmation)
- Wait for full candle close below this level
- Require bearish candle structure for confirmation
**Stop Loss:** 1.1785
- Above the double top at points 3 and 5
- Clear invalidation level
**Target:** 1.1608
- Next chaos theory zone
- Risk/Reward: 2.14
### Technical Confluences
1. **Market Structure:** Lower highs and lower lows established on 4H and Daily timeframes
2. **RSI:** Price at second standard deviation (overbought zone)
3. **Elliott Wave:** Potential wave 3 completion, expecting wave 4 decline
4. **Chaos Theory Indicator:** 67% probability of reaching lower zone once triggered (based on 2,400 candle sample)
5. **Dow Theory:** Trend alignment across multiple timeframes
### Risk Management
- Position Size: 2% of account maximum
- Breakeven: Move stop to entry at 1.1700
- Partial Profit: Consider taking 50% at 1.1650
### Entry Criteria
1. Price must close below 1.1720 (full candle body)
2. Increased volume on breakdown preferred
3. No entry on wicks alone
### Current Status
Alert set at 1.1720. Waiting for bearish confirmation before entry.
### Notes
- If price reaches 1.1780-1.1790 first, expect potential liquidity sweep before reversal
- No trade if proper confirmation doesn't occur
- Setup invalidated above 1.1785
**Setup Narrative (educational)**1. **Context Prep:** We tagged the 12 AM bias—watching for a liquidity sweep into London (2–5 AM). Right on cue, the price trapped early movers.
2. **Price Reaction:** That trap sets the stage—when New York opens, price drives the opposite direction.
3. **Sniper Lesson:** Don’t react. Anticipate. Use bias, structure, and frames to position ahead of the move—and let the market run into your trigger.
This is *teaching, not calling*. Learn how to align bias + price structure in real time.

EURO Building for next move Today's Jackson Hole Conference is going to be explosive i believe in one way or another , with either the doves or hawks getting hold of the markets and this will impact Treasuries, equities and the $ so prepare

Trap Day Example – 12AM Bias, London Trap & New York Silver BullThis schematic illustrates how price action often sets up around key time windows and liquidity pools, independent of the actual news release.
• 12AM Candle Bias: The 12AM (NY) hourly candle often sets the directional framework for the day. A red candle can sometimes indicate the opposite bias (bullish) as liquidity is engineered around retail positioning.
• London Trap (1AM–5AM): Liquidity is typically built in the early session, where clean-looking structures entice traders to place stops just beyond obvious highs or lows. These stops become fuel later in the session.
• Reset Window (5AM–7AM): Price consolidates and repositions, chopping up retail orders. Patience here is essential.
• 7:38AM Liquidity Sweep: A sharp move often clears out positions, targeting extreme levels such as the 4th standard deviation (~68 pips in this example). This is not random — it’s part of the day’s liquidity cycle.
• 10AM Silver Bullet Zone: A major move frequently coincides with scheduled news events. However, the setup is often already “baked in” to the algorithms well before the announcement, providing a precise time/price confluence for high-probability trades.
Key Takeaway:
Markets are not driven by randomness. Time, liquidity, and structure work together to engineer traps and sweeps before directional moves unfold. By studying these repeatable cycles — from the London trap to the New York Silver Bullet — traders can better understand how the market truly operates.

EURUSD: Potential Bullish liquidity after liqudity grabHello traders here's my point of view about CME_MINI:E71! CMCMARKETS:EURUSD
For the past months we've seen massive bullish momentum. The overall trend remains bullish specially if TVC:DXY continue bearish.
Yesterday, price retested a solid H4 ORDERBLOCK around the 1.6500 area. This was some sort of liquidity collection mouvement.. Price re-integrated the area leaving places for intraday BUY opportunities. As you can se price now is filling those intraday imabalces/FVGS
If we see clearly bearish signs in THE US DOLLAR INDEX DXY
by negative correlation EURUUSD can move up.
All eyes on today's 20 of august 2025 FOMC meeting!. We are traders, we adapt. if things change the idea will be totally invalidated!
Markets might wait for end of the week Jackson Hole Symposium toO.
You may find more details in the chart!
Thank you and Good Luck!
PS: Please support with a like or comment if you find this analysis useful for your trading day.

EUR: COT Data Indicates Dollar ResilienceThe EURUSD pair closed the previous week with a bullish weekly candle, positioned within the bounds of a significant two-week-old bearish candle. This pattern suggests a potential pause or consolidation phase after a strong downtrend, but traders should remain cautious as the overall trend still bears the mark of the larger bearish candle.
Recent COT (Commitment of Traders) data provides additional insights into market sentiment. Retail traders have increased their long positions, indicating a more bullish outlook among individual traders. Conversely, both commercial and non-commercial traders are shifting towards bearish positions, signaling a potential underlying strength in the US dollar and a cautious stance among large market participants.
Given these dynamics, there is a high probability that the EURUSD may retest the recent daily supply zone, which has already been touched during the week. If the price moves down from this level, it could signal a continuation of the overall bearish trend, especially considering the COT data's favor towards dollar strength.
What are your thoughts on this setup? Do you see a potential reversal, or will the bullish weekly candle lead to further upside?
✅ Please share your thoughts about 6E1! in the comments section below and HIT LIKE if you appreciate my analysis. Don't forget to FOLLOW ME; you will help us a lot with this small contribution.
Euro Bearish PredictionEuro Bearish Prediction.
Reversal point on multiple high volume nodes paired with previous month naked POC.
weekly and daily VA extensions.

EURUSDEURUSD Weekly/Upcoming Monthly Closure Out Look.
With the current signs of dollar weakness on the macro outlook I believe we can maintain the bullish stance on EU.
Trade Smart Trade Safe.

Morning Market Brief 15.08.2025TF - W
Today is packed with high-impact news, and both France and Italy are observing bank holidays. Ideally, I’d like to see the market provide a clear signal during the session that could indicate the direction for next week’s movement.
TF - D
Yesterday’s bearish close introduced a new variable in the form of a Rejection Block at 1.17305. This block may serve both as a potential area of interest for sellers and as an initial signal that selling at these price levels is favorable for them. Selling pressure continues.
TF - h4
H4 shows quite a lot of changes during the Asian session.
1) An intraday target has appeared in the form of a fractal low inside the buyers’ area of interest at 1.16545.
2) The price is moving in a compressed manner, without impulses, towards a bearish imbalance, which could send the price into the newly formed fractal at 1.16545 — a scenario I described yesterday evening.
3) Considering the formation of the daily Rejection Block, inside it there is an inducement in the form of an H4 fractal (1.17395). In the event of an upward impulse, it could serve both as a profit-taking target and as potential liquidity sufficient to send the price lower, forming a new trading range.
TF - h1
The 1H movement is highly compressed, with the price climbing slowly in small candles. The appearance of sellers during the test of the H4 imbalance could send this drawn-out move down to retest the local low.
