EURNZD — Channel Breakdown Signals Potential Bearish Continuatio📉 EURNZD — Channel Breakdown Signals Potential Bearish Continuation
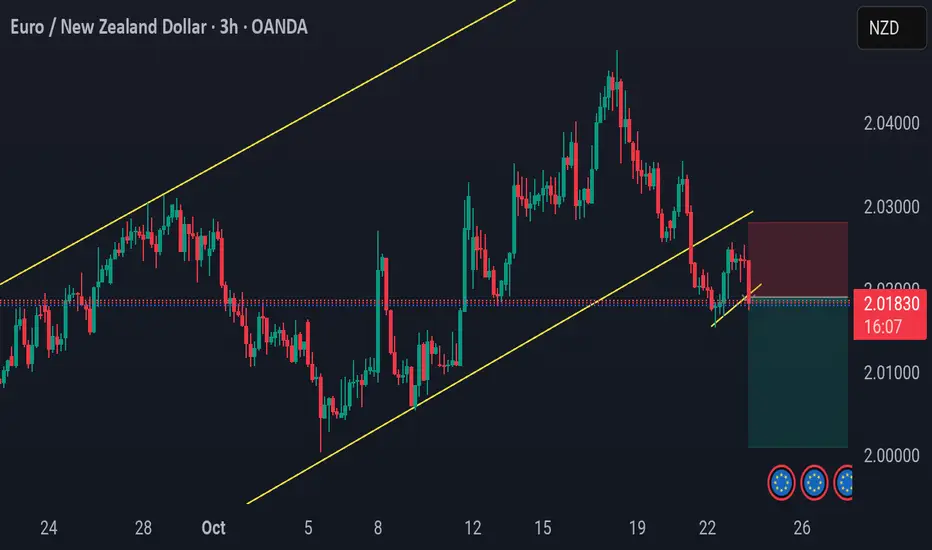
After a clean break below the ascending channel, EURNZD is now retesting the underside of structure. The pair has also rejected the lower time frame resistance zone, hinting at renewed downside momentum.
As long as price holds below 2.0220, bears remain in control with potential continuation toward the 2.0100 region. A daily close back above the broken channel would invalidate this setup.
Watching for confirmation on lower timeframes before continuation.
#EURNZD #ForexAnalysis #TradingView #PriceAction #TechnicalAnalysis #SwingTrading #ForexSetups #SmartMoney #FXInsights #MarketStructure
Precision setups. Smart execution. PulseTradesFX.
Trade ideas
EURNZDPrice is retesting recently broken daily resistance zone. We have H4 support trendline and 50EMA which price is also approaching. if bullish confirmation is given then upward continuation is possible. Overall price looks to be heading to the monthly resistance around 2.10000

EURNZD trend breakout and start of correctionEURNZD has broken below the ascending channel and confirmed the breakout under 2.0350. This indicates the start of a corrective phase. Downside targets are 2.0190, 2.0020, and 1.9860. As long as the price stays below the confirmation zone, sellers dominate the market. A return above 2.0370 would cancel the bearish outlook and restore the upward trend.
The New Zealand dollar remains supported by stable macroeconomic data and expectations that the RBNZ will maintain tight policy longer than the ECB. Meanwhile, the euro faces pressure from weak industrial performance and sluggish recovery across the eurozone. These factors favor further downside for EURNZD.
Following the breakout and confirmation, EURNZD is likely to continue its correction. As long as the price remains below 2.0350, the bias stays bearish with targets at 2.0190, 2.0020, and 1.9860.

EURNZD Looks Trend Bearish ReactEURNZD has been consolidating after a previous bullish leg. However, recent price action shows signs of exhaustion on the upside, suggesting that the pair could be preparing for a bearish continuation.
The overall structure remains in a declining trend, with lower highs forming on the H4/Daily chart Despite short-term bullish candles, the momentum is weakening, indicating a potential shift back to sellers’ control. The (NZD) has been relatively weak for an extended period, but if sentiment improves even slightly, it could strengthen the bearish move on EURNZD.
If price fails to break above resistance and rejection with strong bearish candles, expect continuation to the downside toward 2.0200 → 2.0110.
You may find more details in the chart.
Trade wisely best of Luck.
Ps; Support with like and comments for better analysis Thanks for Supporting.

EURNZD: Trend Long-term bullish trend with room to move higher. Currently in a shallow bearish retracment, but adding a fib we are already into the 79.5 level (deep discount). Watch out for NZD CPI Monday 20th.

EURNZD: buy setupEURNZD: buy setup. I see a possible scenario for EURNZD. Wait for a clear breakout.
Cheers


EURNZD potential for the upside.Currently taking long positions upon the retest of the 1h low that formed after retesting the 4h broken structure.Use proper risk management should you decide to join me.

EURNZD – Short-Term Buy Opportunity
EURNZD is currently trading within a range, with 2.02600 acting as resistance and 2.01700 as support. The price has recently closed above the 50-period moving average, and the MACD momentum has shifted to the bullish side on the H1 timeframe.
This setup suggests a potential short-term buying opportunity to capture some upside movement.
However, once the current bullish move completes, I’ll be watching for short setups, as the market appears to be forming a bear flag pattern, indicating that further selling pressure may follow in the next phase.

EURNZD Under Pressure! SELL!
My dear subscribers,
My technical analysis for EURNZD is below:
The price is coiling around a solid key level - 2.0233
Bias - Bearish
Technical Indicators: Pivot Points High anticipates a potential price reversal.
Super trend shows a clear sell, giving a perfect indicators' convergence.
Goal - 2.0208
My Stop Loss - 2.0248
About Used Indicators:
By the very nature of the supertrend indicator, it offers firm support and resistance levels for traders to enter and exit trades. Additionally, it also provides signals for setting stop losses
Disclosure: I am part of Trade Nation's Influencer program and receive a monthly fee for using their TradingView charts in my analysis.
———————————
WISH YOU ALL LUCK


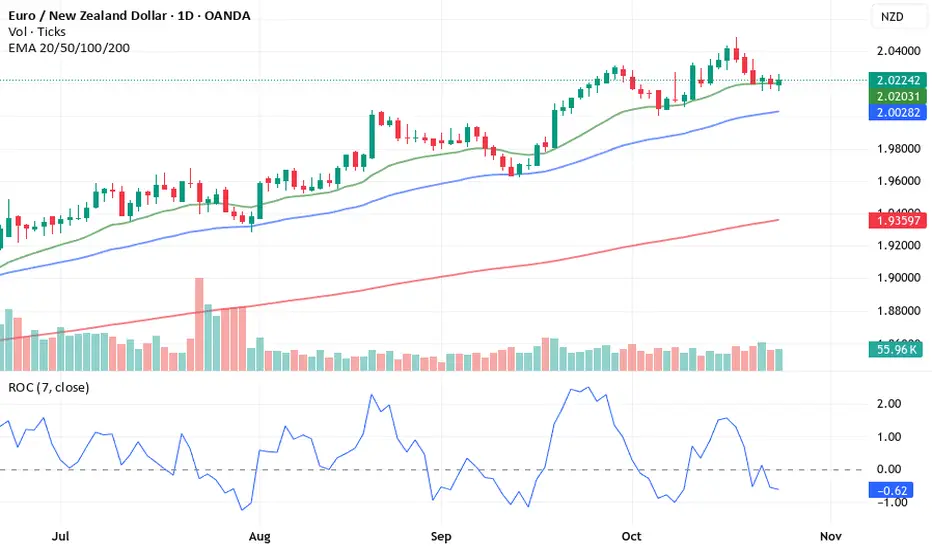
Trading Secrets #3-EURNZD – Bullish Signal Forming at 20 EMA 📈 EURNZD – Bullish Signal Forming at 20 EMA Support
EURNZD is showing a potential bullish continuation setup:
Price is trading above the 20 EMA, 50 EMA,
and 200 EMA, confirming a bullish market structure.
The latest candle is a spinning white top (small
body, upper & lower shadows) that
has touched the 20 EMA support zone.
This indicates temporary indecision,
but buyers are still defending the moving
average, suggesting strength.
🟢 Bullish Bias:
As long as the price stays above the 20 EMA,
buyers remain in control.
A break above the high of this spinning
top candle could confirm momentum to the upside.
⚠️ Invalidation Level:
A strong close below the 20 EMA would
invalidate this bullish setup and could open
the door for a deeper pullback toward the 50 EMA.
Key Levels to Watch:
Support: 20 EMA dynamic zone
Resistance: Recent swing high
Trend: Bullish above 50 EMA and 200 EMA
💬 For educational purposes only, not financial advice.
EURNZD BEARISH BREAKOUT|SHORT|
✅EURNZD pair has confirmed a clean breakout below the key level, signaling potential continuation toward the 2.0240 target area. Price has already taken out internal liquidity and is now likely to expand further as sellers remain in control. Time Frame 2H.
SHORT🔥
✅Like and subscribe to never miss a new idea!✅

EUR NZD - H1EUR NZD has been in a Bullish trend making Higher Highs & Higher Lows.
Price is currently pulling back down to the Fib golden zone of 0.5-0.618 levels while also being in an ascending channel. Price has also formed a hidden divergence potentially signalling an upward movement from here.
Confluences for the trade:
- Higher Highs & Higher Lows being formed, signalling an uptrend.
- Price Pulling back to the 0.5-0.618 Fib Levels.
- Currently in an ascending channel.
- Hidden divergence being formed indicating an upward movement.

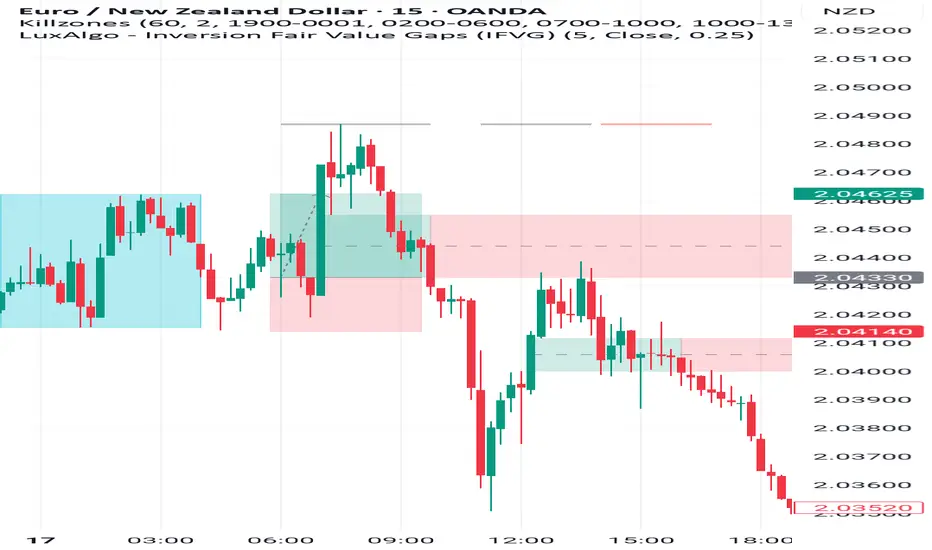
Asia sweep then 15 minute inversion fair value gap I waited for Asia session high/low to be swept
Then waited for an inversion fair value gap
Looked for candle closure to place the trade
Partial TP at internal liquidity and set to break even. Leave the rest for Asia high or low
Stop loss below the candle body before the ifvg
EURNZD 15.10.2025+ Policy divergence & latest RBNZ cut
~ Political uncertainty in the EU is shrugged off
*Beautiful technical setup

EUR/NZD BEARISH BIAS RIGHT NOW| SHORT
EUR/NZD SIGNAL
Trade Direction: short
Entry Level: 2.042
Target Level: 2.007
Stop Loss: 2.066
RISK PROFILE
Risk level: medium
Suggested risk: 1%
Timeframe: 1D
Disclosure: I am part of Trade Nation's Influencer program and receive a monthly fee for using their TradingView charts in my analysis.
✅LIKE AND COMMENT MY IDEAS✅

EN Sell🆓 Sell Entry: 2.03300
⏹️ Stop Loss: 2.04100
*️⃣ Take Profit-1: 2.02690
*️⃣ Take Profit-2: 2.02170

EURNZD: Intraday Confirmation?! 🇪🇺🇳🇿
A quick follow-up for EURNZD.
I see some intraday bullish confirmation on an hourly time frame
after a retest of a broken structure.
A double bottom pattern on that provides a strong bullish clue.
I expect a rise now at least to 2.0375
❤️Please, support my work with like, thank you!❤️
I am part of Trade Nation's Influencer program and receive a monthly fee for using their TradingView charts in my analysis.
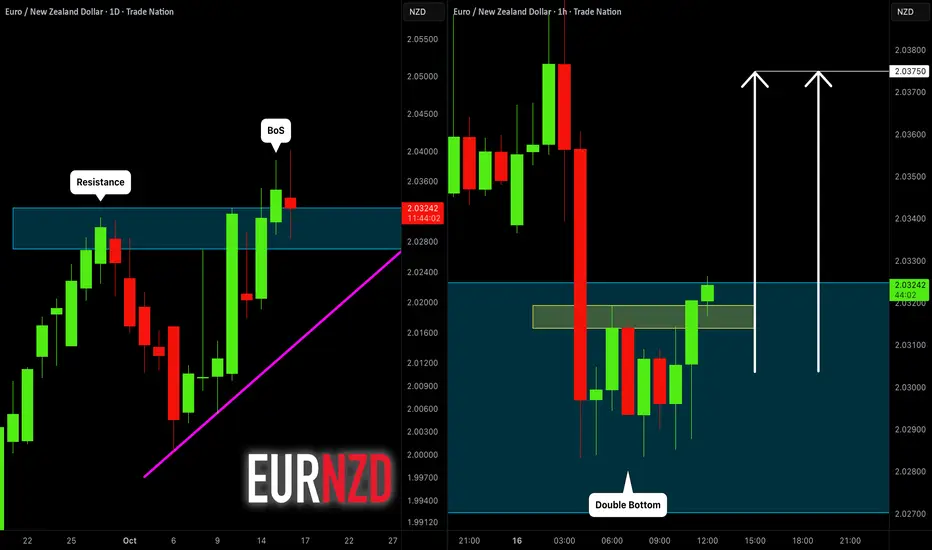
EURNZD: High Growth Potential 🇪🇺🇳🇿
EURNZD broke and closed above a significant daily
structure resistance, updating a Higher High.
It suggests a highly probable bullish trend continuation after a pullback.
Next resistance - 2.043
❤️Please, support my work with like, thank you!❤️
I am part of Trade Nation's Influencer program and receive a monthly fee for using their TradingView charts in my analysis.

EURNZDPrice Action Trading is a method of financial market analysis where traders make buying and selling decisions solely based on the asset's price movements over time, without relying on technical indicators.
It's essentially the art of reading a "naked" or clean chart to understand the psychology and behavior of market participants.

Bullish rise?EUR/NZD is reacting off the support level, which serves as a pullback support and could potentially rise from this level to our take-profit target.
Entry: 2.03005
Why we like it:
There is a pullback support level.
Stop loss: 2.01833
Why we like it:
There is a pullback support level which aligns with hte 50% Fibonacci retracement.
Takeprofit: 2.05502
Why we like it:
There is a resistance level that lines up with the 78.6% Fibonacci projection.
Enjoying your TradingView experience? Review us!
Please be advised that the information presented on TradingView is provided to Vantage (‘Vantage Global Limited’, ‘we’) by a third-party provider (‘Everest Fortune Group’). Please be reminded that you are solely responsible for the trading decisions on your account. There is a very high degree of risk involved in trading. Any information and/or content is intended entirely for research, educational and informational purposes only and does not constitute investment or consultation advice or investment strategy. The information is not tailored to the investment needs of any specific person and therefore does not involve a consideration of any of the investment objectives, financial situation or needs of any viewer that may receive it. Kindly also note that past performance is not a reliable indicator of future results. Actual results may differ materially from those anticipated in forward-looking or past performance statements. We assume no liability as to the accuracy or completeness of any of the information and/or content provided herein and the Company cannot be held responsible for any omission, mistake nor for any loss or damage including without limitation to any loss of profit which may arise from reliance on any information supplied by Everest Fortune Group.

EURNZD Evening Forecasat 15/10/2025Hello, this is my evening foreacst on EURNZD. Curious for your feedback and guidance
