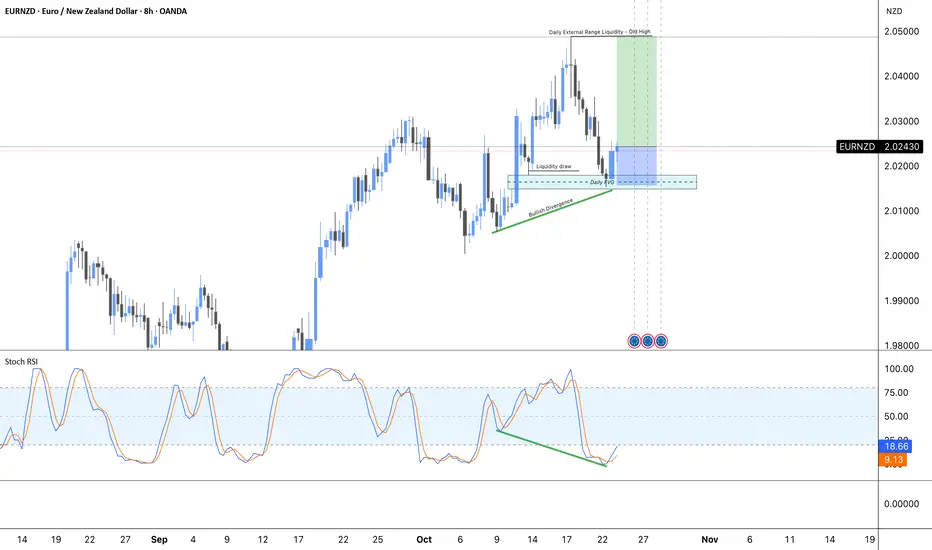
EURNZD: Daily FVG reversal?Price has pulled back into the 50EMA (not shown here) and is supported with hidden bullish divergence. Trade setting up nicely for a Daily FVG reversal set-up.
I like:
- The volume of buyers at the Daily FVG
- Hidden bullish divergence (continuation of trend)
- Fib level 70.50% retracement
I don't like:
- Daily RSI hasn't crossed and is still technically bearish.
Action:
- Monitor Euro session for lower timeframe breaks of structure.
Trade ideas
Bearish reversal off major resistance?EUR/NZD is rising towards the resistance level which is an overlap resistance that lines up with the 50% Fibonacci retracement and could reverse from this level to our take profit.
Entry: 2.03005
Why we like it:
There is an overlap resistance level that lines up with the 50% Fibonacci retracement.
Stop loss: 2.04813
Why we like it:
There is a swing high resistance level.
Take profit: 2.00466
Why we like it:
There is a pullback support level that aligns with the 50% Fibonacci retracement.
Enjoying your TradingView experience? Review us!
Please be advised that the information presented on TradingView is provided to Vantage (‘Vantage Global Limited’, ‘we’) by a third-party provider (‘Everest Fortune Group’). Please be reminded that you are solely responsible for the trading decisions on your account. There is a very high degree of risk involved in trading. Any information and/or content is intended entirely for research, educational and informational purposes only and does not constitute investment or consultation advice or investment strategy. The information is not tailored to the investment needs of any specific person and therefore does not involve a consideration of any of the investment objectives, financial situation or needs of any viewer that may receive it. Kindly also note that past performance is not a reliable indicator of future results. Actual results may differ materially from those anticipated in forward-looking or past performance statements. We assume no liability as to the accuracy or completeness of any of the information and/or content provided herein and the Company cannot be held responsible for any omission, mistake nor for any loss or damage including without limitation to any loss of profit which may arise from reliance on any information supplied by Everest Fortune Group.

EURNZD: Well positioned again for another bearish moveEURNZD: Well positioned again for another bearish move
From our previous analysis of EURNZD, the price has transformed the picture to bullish and now it has changed back to bearish.
The pattern is strong and bearish, the main problem lies in NZD. It has been very weak for a long time without any clear reason. I can’t say that the GDP data is good, but we have seen many countries with bad economic indicators and their currencies are strong.
Simply put, we are not at a clear moment. The pattern is bearish, but NZD is still very weak. However, we cannot ignore the chart that shows a downward movement, however it may develop later.
You may find more details in the chart!
Thank you and Good Luck!
❤️PS: Please support with a like or comment if you find this analysis useful for your trading day❤️
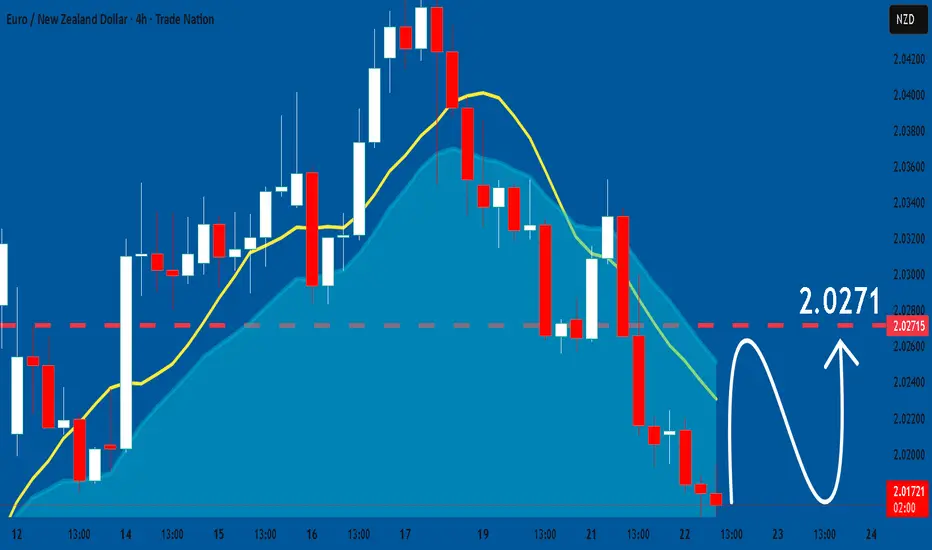
EURNZD: Expecting Bullish Continuation! Here is Why:
Looking at the chart of EURNZD right now we are seeing some interesting price action on the lower timeframes. Thus a local move up seems to be quite likely.
Disclosure: I am part of Trade Nation's Influencer program and receive a monthly fee for using their TradingView charts in my analysis.
❤️ Please, support our work with like & comment! ❤️
Bearish drop off?EUR/NZD has reacted off the pivot and could drop to the 1st support which acts as an overlap support that aligns with the 50% Fibonacci retracement.
Pivot: 2.02316
1st Support: 2.00328
1st Resistance: 2.03475
Disclaimer:
The above opinions given constitute general market commentary, and do not constitute the opinion or advice of IC Markets or any form of personal or investment advice.
Any opinions, news, research, analyses, prices, other information, or links to third-party sites contained on this website are provided on an "as-is" basis, are intended only to be informative, is not an advice nor a recommendation, nor research, or a record of our trading prices, or an offer of, or solicitation for a transaction in any financial instrument and thus should not be treated as such. The information provided does not involve any specific investment objectives, financial situation and needs of any specific person who may receive it. Please be aware, that past performance is not a reliable indicator of future performance and/or results. Past Performance or Forward-looking scenarios based upon the reasonable beliefs of the third-party provider are not a guarantee of future performance. Actual results may differ materially from those anticipated in forward-looking or past performance statements. IC Markets makes no representation or warranty and assumes no liability as to the accuracy or completeness of the information provided, nor any loss arising from any investment based on a recommendation, forecast or any information supplied by any third-party.

EUR/NZD Daily AnalysisPrice is moving within a bullish trend and has pulled back to the 20 EMA (blue line).
This could potentially act as support, as it did on more than one occasion during the last correction earlier this month.
Look for a trade setup that meets your strategy rules.

EURNZD – Elliott Wave Roadmap2D Chart
Every swing continues to unfold with precision - true to Elliott Wave structure. We’re now in the final stages of Wave 5.
This structure is nearing completion, with price developing the final sub-wave (C) of (5) into the Sell Zone.
📍 The Sell Zone aligns with the upper channel resistance - where we’ll be watching closely for exhaustion and the start of the next major decline.
Trade Idea:
- Watch for price to complete Wave (5) inside the Sell Zone
- Aggressive short: Rejection within the zone
- Conservative short: Entry after trendline break / BOS
🎯 Targets:
- TP1: 1.8800 (1800 pips)
- TP2: 1.7600 (3100 pips)
We’re in the final stretch of this multi-month rally. Once Wave 5 completes, expect a sharp corrective drop to follow.
Plan the trade. Wait for confirmation. Execute with precision.
Goodluck, and as always, Trade Safe!

EURNZD trend breakout and start of correctionEURNZD has broken below the ascending channel and confirmed the breakout under 2.0350. This indicates the start of a corrective phase. Downside targets are 2.0190, 2.0020, and 1.9860. As long as the price stays below the confirmation zone, sellers dominate the market. A return above 2.0370 would cancel the bearish outlook and restore the upward trend.
The New Zealand dollar remains supported by stable macroeconomic data and expectations that the RBNZ will maintain tight policy longer than the ECB. Meanwhile, the euro faces pressure from weak industrial performance and sluggish recovery across the eurozone. These factors favor further downside for EURNZD.
Following the breakout and confirmation, EURNZD is likely to continue its correction. As long as the price remains below 2.0350, the bias stays bearish with targets at 2.0190, 2.0020, and 1.9860.

EURNZD BEARISH BREAKOUT|SHORT|
✅EURNZD pair has confirmed a clean breakout below the key level, signaling potential continuation toward the 2.0240 target area. Price has already taken out internal liquidity and is now likely to expand further as sellers remain in control. Time Frame 2H.
SHORT🔥
✅Like and subscribe to never miss a new idea!✅

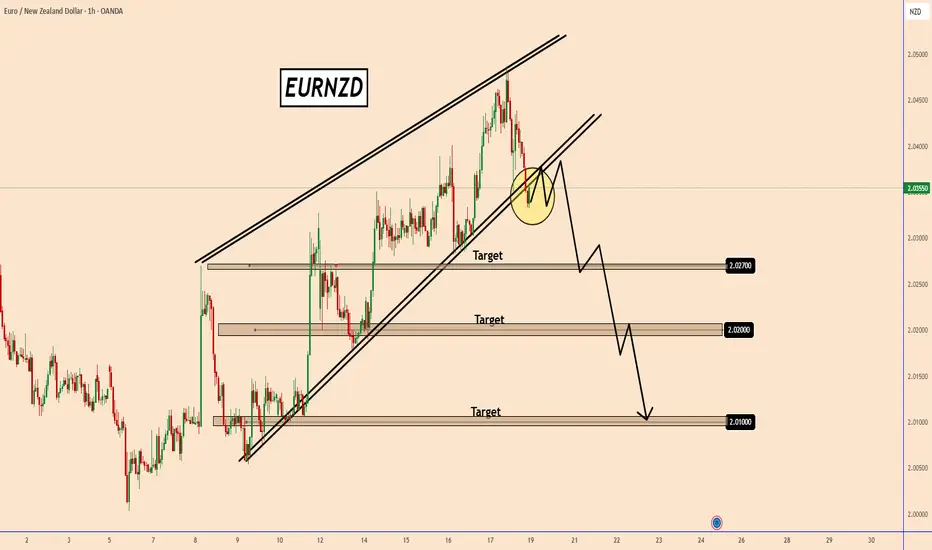
EURNZDEUR/NZD illustrating a potential bearish reversal setup. The price has been moving within an ascending channel, with two marked Breaks of Structure (BOS) indicating weakening bullish momentum. After a final push to the upside into a supply zone near 2.0400, price broke below the channel, signalling a possible trend shift. A minor pullback (retest) toward the broken structure is expected before a continuation downward toward the demand zone around 2.0150. Overall, the chart suggests a shift from bullish to bearish momentum.
"Thank you for your support! If you found this idea valuable or learned something new, please consider liking and leaving a comment. I’d really appreciate hearing your feedback and thoughts."

EURNZD Looks Trend Bearish ReactEURNZD has been consolidating after a previous bullish leg. However, recent price action shows signs of exhaustion on the upside, suggesting that the pair could be preparing for a bearish continuation.
The overall structure remains in a declining trend, with lower highs forming on the H4/Daily chart Despite short-term bullish candles, the momentum is weakening, indicating a potential shift back to sellers’ control. The (NZD) has been relatively weak for an extended period, but if sentiment improves even slightly, it could strengthen the bearish move on EURNZD.
If price fails to break above resistance and rejection with strong bearish candles, expect continuation to the downside toward 2.0200 → 2.0110.
You may find more details in the chart.
Trade wisely best of Luck.
Ps; Support with like and comments for better analysis Thanks for Supporting.

Daily Trade Idea: Looking To SELL EURNZD @ 2.039??Today I am looking to short the EURNZD down towards the daily trendline @ 2.025.

EURNZDPrice is retesting recently broken daily resistance zone. We have H4 support trendline and 50EMA which price is also approaching. if bullish confirmation is given then upward continuation is possible. Overall price looks to be heading to the monthly resistance around 2.10000

EUR NZD - H1EUR NZD has been in a Bullish trend making Higher Highs & Higher Lows.
Price is currently pulling back down to the Fib golden zone of 0.5-0.618 levels while also being in an ascending channel. Price has also formed a hidden divergence potentially signalling an upward movement from here.
Confluences for the trade:
- Higher Highs & Higher Lows being formed, signalling an uptrend.
- Price Pulling back to the 0.5-0.618 Fib Levels.
- Currently in an ascending channel.
- Hidden divergence being formed indicating an upward movement.

EURNZD: Trend Long-term bullish trend with room to move higher. Currently in a shallow bearish retracment, but adding a fib we are already into the 79.5 level (deep discount). Watch out for NZD CPI Monday 20th.

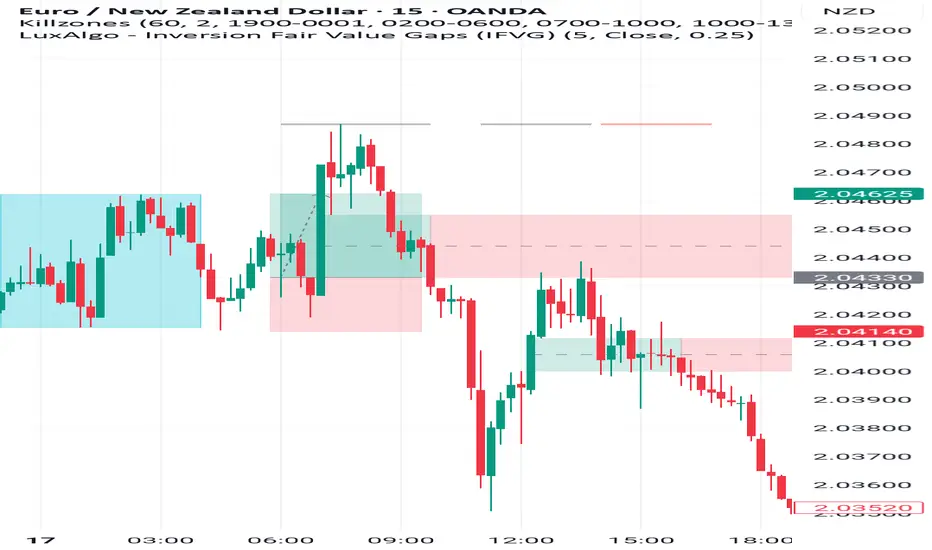
Asia sweep then 15 minute inversion fair value gap I waited for Asia session high/low to be swept
Then waited for an inversion fair value gap
Looked for candle closure to place the trade
Partial TP at internal liquidity and set to break even. Leave the rest for Asia high or low
Stop loss below the candle body before the ifvg
EURNZD 15.10.2025+ Policy divergence & latest RBNZ cut
~ Political uncertainty in the EU is shrugged off
*Beautiful technical setup

EUR/NZD BEARISH BIAS RIGHT NOW| SHORT
EUR/NZD SIGNAL
Trade Direction: short
Entry Level: 2.042
Target Level: 2.007
Stop Loss: 2.066
RISK PROFILE
Risk level: medium
Suggested risk: 1%
Timeframe: 1D
Disclosure: I am part of Trade Nation's Influencer program and receive a monthly fee for using their TradingView charts in my analysis.
✅LIKE AND COMMENT MY IDEAS✅

EN Sell🆓 Sell Entry: 2.03300
⏹️ Stop Loss: 2.04100
*️⃣ Take Profit-1: 2.02690
*️⃣ Take Profit-2: 2.02170

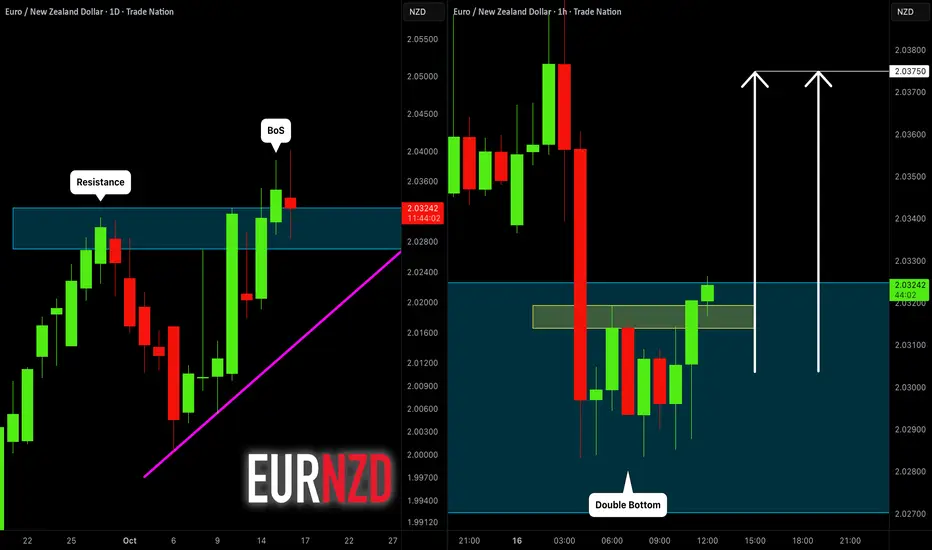
EURNZD: Intraday Confirmation?! 🇪🇺🇳🇿
A quick follow-up for EURNZD.
I see some intraday bullish confirmation on an hourly time frame
after a retest of a broken structure.
A double bottom pattern on that provides a strong bullish clue.
I expect a rise now at least to 2.0375
❤️Please, support my work with like, thank you!❤️
I am part of Trade Nation's Influencer program and receive a monthly fee for using their TradingView charts in my analysis.
EURNZD: High Growth Potential 🇪🇺🇳🇿
EURNZD broke and closed above a significant daily
structure resistance, updating a Higher High.
It suggests a highly probable bullish trend continuation after a pullback.
Next resistance - 2.043
❤️Please, support my work with like, thank you!❤️
I am part of Trade Nation's Influencer program and receive a monthly fee for using their TradingView charts in my analysis.

EURNZDPrice Action Trading is a method of financial market analysis where traders make buying and selling decisions solely based on the asset's price movements over time, without relying on technical indicators.
It's essentially the art of reading a "naked" or clean chart to understand the psychology and behavior of market participants.

Bullish rise?EUR/NZD is reacting off the support level, which serves as a pullback support and could potentially rise from this level to our take-profit target.
Entry: 2.03005
Why we like it:
There is a pullback support level.
Stop loss: 2.01833
Why we like it:
There is a pullback support level which aligns with hte 50% Fibonacci retracement.
Takeprofit: 2.05502
Why we like it:
There is a resistance level that lines up with the 78.6% Fibonacci projection.
Enjoying your TradingView experience? Review us!
Please be advised that the information presented on TradingView is provided to Vantage (‘Vantage Global Limited’, ‘we’) by a third-party provider (‘Everest Fortune Group’). Please be reminded that you are solely responsible for the trading decisions on your account. There is a very high degree of risk involved in trading. Any information and/or content is intended entirely for research, educational and informational purposes only and does not constitute investment or consultation advice or investment strategy. The information is not tailored to the investment needs of any specific person and therefore does not involve a consideration of any of the investment objectives, financial situation or needs of any viewer that may receive it. Kindly also note that past performance is not a reliable indicator of future results. Actual results may differ materially from those anticipated in forward-looking or past performance statements. We assume no liability as to the accuracy or completeness of any of the information and/or content provided herein and the Company cannot be held responsible for any omission, mistake nor for any loss or damage including without limitation to any loss of profit which may arise from reliance on any information supplied by Everest Fortune Group.
