Fertilizers & Chemicals Travancore LtdStock Price is well inside Accumulation Zone and also RSI Divergence can be seen on the daily time frame, Stock has very good fundamentals, Price may reverse from here to hit the Targets as shown in the diagram.
Fundamentals Snap Shot :-
Short Overall View on These Metrics
Sales / Revenue growth:
1.60 INR
412.32 M INR
24.40 B INR
9.31 M
About Fertilizers & Chemicals Travancore Ltd.
Sector
Industry
CEO
Shriniwas C. Mudgerikar
Website
Headquarters
Kochi
Founded
1943
ISIN
INE188A01015
FIGI
BBG000CR4X36
Fertilizers & Chemicals Travancore Ltd. engages in the manufacturing and marketing of fertilizers and petrochemicals. It also focuses on engineering consultancy and design, and the fabrication and erection of industrial equipment. It operates through the Fertilizer and Petrochemical segments. The Fertilizer segment includes ammonium phosphate, NPK 15:15:15, and organic manure. The Petrochemical segment refers to caprolactam. The company was founded in 1943 and is headquartered in Kochi, India.
Related stocks

Inverse head and shoulder BULLISHPros
Bullish Inverse head and shoulder pattern forming on weekly and daily chart.
Good fundamentals - 90% holding in strong hands
Potential breakout expected above 1080 level
Cons
Follow strict stop loss, trailing stop loss if required
Keep eye on China export restrictions (sensitive)

FACT - Rising Wedge ( BEAR )Disclaimer:
I am not a SEBI-registered investment advisor. The information provided here is for educational and informational purposes only and should not be construed as financial or investment advice. Please do your own research or consult with a SEBI-registered financial advisor before making an

Fact: After a Buy Signal,sitting at a major Red Band Resistance Fact: After a Buy Signal,sitting at a major Red Band Resistance.
1112/1187 are major resistance levels to watch out for.
( Not a Buy / Sell Recommendation
Do your own due diligence ,Market is subject to risks, This is my own view and for learning only .)

Fact :After a Buy Signal, Sitting at a major Red Band ResistanceFact :After a Buy Signal, Sitting at a major Red Band Resistance.
1112/1187 are major resistance levels to watch out for.
( Not a Buy / Sell Recommendation
Do your own due diligence ,Market is subject to risks, This is my own view and for learning only .)

FACT : Although a Buy Signal, sitting at a major Red Band ResistFACT :
Although a Buy Signal, sitting at a major Red Band Resistance.
It crossed an important level of 1000 and just managing to stay afloat above 1000.
1112 is another resistance to watch out for.
( Not a Buy / Sell Recommendation
Do your own due diligence ,Market is subject to risks, Th

FACT : Approaching a major Red Band Resistance FACT : Approaching a major Red Band Resistance .
Important Level to watch for is 1112 .
( Not a Buy / Sell Recommendation
Do your own due diligence ,Market is subject to risks, This is my own view and for learning only .)

FACT : Sitting at the Major Red Band Resistance
FACT : Sitting at the Major Red Band Resistance
MACD is also Negative
( Not a Buy / Sell Recommendation
Do your own due diligence ,Market is subject to risks, This is my own view and for learning only .)
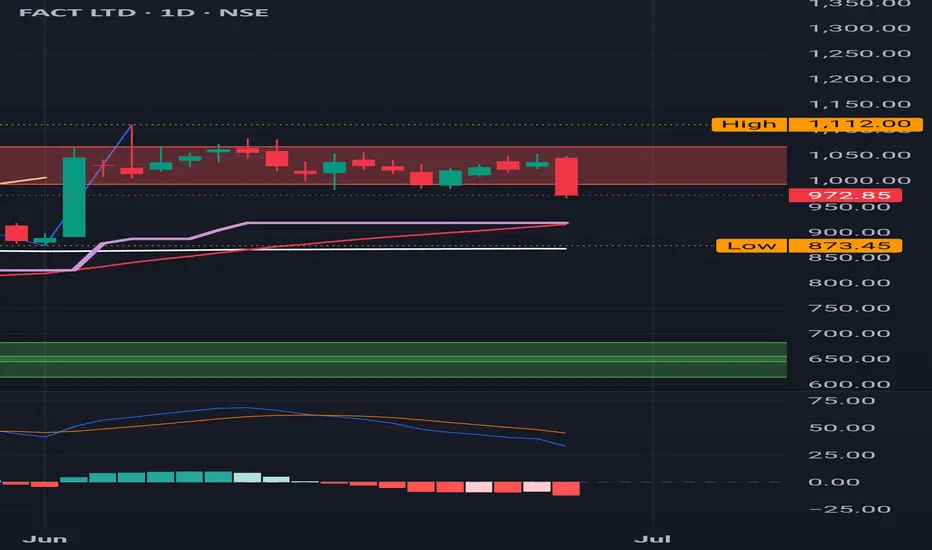
FACT : Sitting at the Red Band resistance
FACT : Sitting at the Red Band Resistance
Got a pull back from 1112 which will be an important level to test moving forward..
( Not a Buy / Sell Recommendation
Do your own due diligence ,Market is subject to risks, This is my own view and for learning only .)

See all ideas
Summarizing what the indicators are suggesting.
Oscillators
Neutral
SellBuy
Strong sellStrong buy
Strong sellSellNeutralBuyStrong buy
Oscillators
Neutral
SellBuy
Strong sellStrong buy
Strong sellSellNeutralBuyStrong buy
Summary
Neutral
SellBuy
Strong sellStrong buy
Strong sellSellNeutralBuyStrong buy
Summary
Neutral
SellBuy
Strong sellStrong buy
Strong sellSellNeutralBuyStrong buy
Summary
Neutral
SellBuy
Strong sellStrong buy
Strong sellSellNeutralBuyStrong buy
Moving Averages
Neutral
SellBuy
Strong sellStrong buy
Strong sellSellNeutralBuyStrong buy
Moving Averages
Neutral
SellBuy
Strong sellStrong buy
Strong sellSellNeutralBuyStrong buy
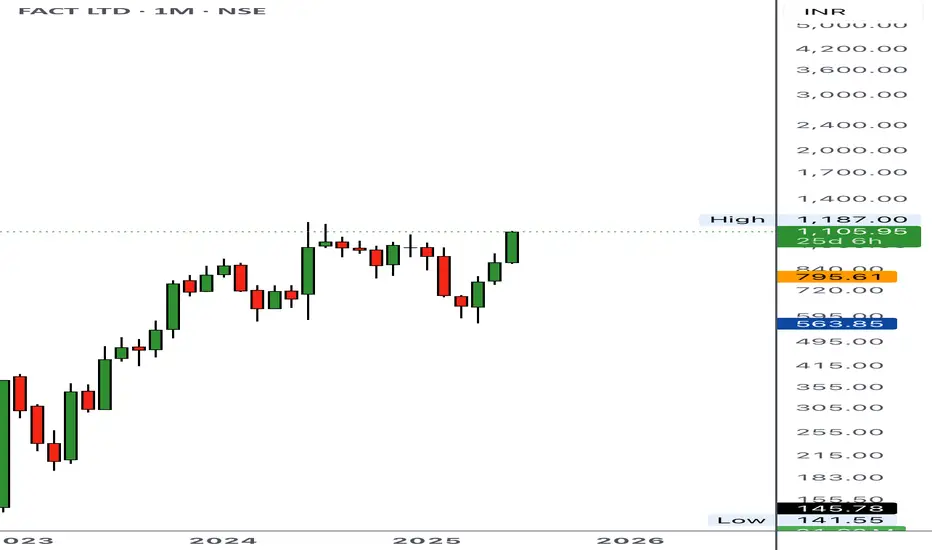
Displays a symbol's price movements over previous years to identify recurring trends.
MIDCAPETF
Mirae Asset Nifty Midcap 150 ETF Exchange Traded Fund UnitsWeight
0.15%
Market value
210.39 K
USD
MID150CASE
Zerodha Nifty Midcap 150 ETF Exchange Traded Fund UnitsWeight
0.15%
Market value
23.26 K
USD
ELM250
Edelweiss Nifty LargeMidcap 250 ETF Units Exchange Traded FundWeight
0.07%
Market value
6.92 K
USD
MULTICAP
Mirae Asset Nifty500 Multicap 502525 ETF Exchange Traded Fund UnitsWeight
0.04%
Market value
2.17 K
USD
Explore more ETFs
Frequently Asked Questions
The current price of FACT is 866.50 INR — it has decreased by −0.03% in the past 24 hours. Watch Fertilizers & Chemicals Travancore Ltd. stock price performance more closely on the chart.
Depending on the exchange, the stock ticker may vary. For instance, on NSE exchange Fertilizers & Chemicals Travancore Ltd. stocks are traded under the ticker FACT.
FACT stock has fallen by −4.99% compared to the previous week, the month change is a −2.35% fall, over the last year Fertilizers & Chemicals Travancore Ltd. has showed a 3.23% increase.
FACT reached its all-time high on Jun 21, 2024 with the price of 1,187.00 INR, and its all-time low was 3.50 INR and was reached on Nov 23, 2001. View more price dynamics on FACT chart.
See other stocks reaching their highest and lowest prices.
See other stocks reaching their highest and lowest prices.
FACT stock is 1.74% volatile and has beta coefficient of 2.13. Track Fertilizers & Chemicals Travancore Ltd. stock price on the chart and check out the list of the most volatile stocks — is Fertilizers & Chemicals Travancore Ltd. there?
Today Fertilizers & Chemicals Travancore Ltd. has the market capitalization of 560.43 B, it has increased by 2.28% over the last week.
Yes, you can track Fertilizers & Chemicals Travancore Ltd. financials in yearly and quarterly reports right on TradingView.
FACT net income for the last quarter is 208.60 M INR, while the quarter before that showed 42.80 M INR of net income which accounts for 387.38% change. Track more Fertilizers & Chemicals Travancore Ltd. financial stats to get the full picture.
Yes, FACT dividends are paid annually. The last dividend per share was 0.39 INR. As of today, Dividend Yield (TTM)% is 0.05%. Tracking Fertilizers & Chemicals Travancore Ltd. dividends might help you take more informed decisions.
Fertilizers & Chemicals Travancore Ltd. dividend yield was 0.06% in 2024, and payout ratio reached 61.21%. The year before the numbers were 0.15% and 48.93% correspondingly. See high-dividend stocks and find more opportunities for your portfolio.
As of Nov 25, 2025, the company has 2.19 K employees. See our rating of the largest employees — is Fertilizers & Chemicals Travancore Ltd. on this list?
EBITDA measures a company's operating performance, its growth signifies an improvement in the efficiency of a company. Fertilizers & Chemicals Travancore Ltd. EBITDA is 1.80 B INR, and current EBITDA margin is −61.69%. See more stats in Fertilizers & Chemicals Travancore Ltd. financial statements.
Like other stocks, FACT shares are traded on stock exchanges, e.g. Nasdaq, Nyse, Euronext, and the easiest way to buy them is through an online stock broker. To do this, you need to open an account and follow a broker's procedures, then start trading. You can trade Fertilizers & Chemicals Travancore Ltd. stock right from TradingView charts — choose your broker and connect to your account.
Investing in stocks requires a comprehensive research: you should carefully study all the available data, e.g. company's financials, related news, and its technical analysis. So Fertilizers & Chemicals Travancore Ltd. technincal analysis shows the strong sell today, and its 1 week rating is sell. Since market conditions are prone to changes, it's worth looking a bit further into the future — according to the 1 month rating Fertilizers & Chemicals Travancore Ltd. stock shows the buy signal. See more of Fertilizers & Chemicals Travancore Ltd. technicals for a more comprehensive analysis.
If you're still not sure, try looking for inspiration in our curated watchlists.
If you're still not sure, try looking for inspiration in our curated watchlists.