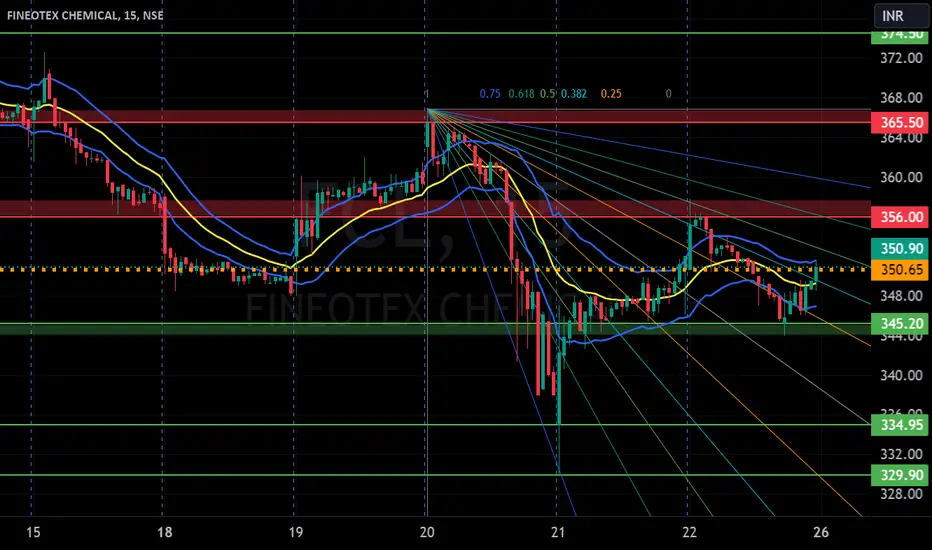
FCL : After the Split today , cleared the Major Red Band ResistaFCL : After the Split today , cleared the Major Red Band Resistance.
Split is 10/1
( Not a Buy / Sell Recommendation
Do your own due diligence ,Market is subject to risks, This is my own view and for learning only .)
Fineotex Chemical Limited
No trades
Next report date
—
Report period
—
EPS estimate
—
Revenue estimate
—
0.86 INR
1.08 B INR
5.32 B INR
380.23 M
About Fineotex Chemical Limited
Sector
Industry
CEO
Arindam Choudhuri
Website
Headquarters
Mumbai
Founded
1979
Identifiers
2
ISIN INE045J01034
Fineotex Chemical Ltd. engages in the manufacture of chemicals for textiles, construction, water-treatment, fertilizer, leather and paint industry. Its products include Textile, Water & Oil Based Drilling Fluid, and Cleaning & Hygiene chemicals. The company was founded by Surendra Kumar Tibrewala in 1979 and is headquartered in Mumbai, India.
Related stocks

FCL BUY FCL - Finotex chemicals Up view
Trade Reason :
1- Weekly support
2- Trendline 4th Touch
3- Day Trend reversal
Entry - 373 Rs
Target - 428 Rs
Stoploss - 330 Rs
Thank you ..

FINEOTEX CHEMICAL S/RSupport and Resistance Levels: In technical analysis, support and resistance levels are significant price levels where buying or selling interest tends to be strong. They are identified based on previous price levels where the price has shown a tendency to reverse or find support.
Support levels ar

FCL Limited Looks ready to move.FCL is looks like ready to move up. It's taking support on 20 MA.
Enter with a stop loss of 5%. Good small-cap Company fundamental is solid.

FCL Long PositionalBuy FCL above 380
Target of 404-447-474-500-550-600
SL 297
Strategy : SBO + RSI > 60 + EMA above 20 & 50
Duration few weeks to months
Please consult your financial advisor before investing
All research for educational purposes only.
Stock is ready to cross past barriers with good volumes

Accumulate at 400 levels400 levels are the good buying area. Once can start buying few quantities every month. Fibonacci levels and predicted price movements are as marked in chart. Next target would be 600.

Perfect breakout candidate with potential upside movement..This stock is Chemical sector has given a clear breakout on weekly Time frame with good volume sprout..

FCLStock name = Fineotex Chemical Limited.
Weekly chart setup
Chart is self explanatory. Levels of breakout, possible up-moves (where stock may find resistances) and support (close below which, setup will be invalidated) are clearly defined.
Master Score - B
Disclaimer: This is for demonstration and

FCL: Technical Triumph - Monthly Breakout Signals Bullish MoveFCL (Favorable Corporation Limited) is currently showcasing an impressive technical breakthrough on the monthly time frame, setting the stage for a compelling bullish trade opportunity. This breakout, coupled with robust trading volumes, highlights a significant shift in market dynamics, capturing t

FCL S/R for 26/12/23Support and Resistance Levels:
Based on the price action, you have to identify two significant levels: the red line acting as resistance and the green line acting as support. Additionally, there have marked red and green shades to represent resistance and support zones, respectively.
Support: The gr
See all ideas
Summarizing what the indicators are suggesting.
Neutral
SellBuy
Strong sellStrong buy
Strong sellSellNeutralBuyStrong buy
Neutral
SellBuy
Strong sellStrong buy
Strong sellSellNeutralBuyStrong buy
Neutral
SellBuy
Strong sellStrong buy
Strong sellSellNeutralBuyStrong buy
An aggregate view of professional's ratings.
Neutral
SellBuy
Strong sellStrong buy
Strong sellSellNeutralBuyStrong buy
Neutral
SellBuy
Strong sellStrong buy
Strong sellSellNeutralBuyStrong buy
Neutral
SellBuy
Strong sellStrong buy
Strong sellSellNeutralBuyStrong buy
Displays a symbol's price movements over previous years to identify recurring trends.
Frequently Asked Questions
The current price of FCL is 22.80 INR — it has decreased by −1.94% in the past 24 hours. Watch Fineotex Chemical Limited stock price performance more closely on the chart.
Depending on the exchange, the stock ticker may vary. For instance, on NSE exchange Fineotex Chemical Limited stocks are traded under the ticker FCL.
FCL stock has risen by 3.97% compared to the previous week, the month change is a −5.36% fall, over the last year Fineotex Chemical Limited has showed a −27.85% decrease.
We've gathered analysts' opinions on Fineotex Chemical Limited future price: according to them, FCL price has a max estimate of 28.00 INR and a min estimate of 28.00 INR. Watch FCL chart and read a more detailed Fineotex Chemical Limited stock forecast: see what analysts think of Fineotex Chemical Limited and suggest that you do with its stocks.
FCL stock is 2.25% volatile and has beta coefficient of 1.77. Track Fineotex Chemical Limited stock price on the chart and check out the list of the most volatile stocks — is Fineotex Chemical Limited there?
Today Fineotex Chemical Limited has the market capitalization of 26.67 B, it has increased by 0.13% over the last week.
Yes, you can track Fineotex Chemical Limited financials in yearly and quarterly reports right on TradingView.
Fineotex Chemical Limited is going to release the next earnings report on Feb 13, 2026. Keep track of upcoming events with our Earnings Calendar.
FCL net income for the last quarter is 259.85 M INR, while the quarter before that showed 248.11 M INR of net income which accounts for 4.73% change. Track more Fineotex Chemical Limited financial stats to get the full picture.
Fineotex Chemical Limited dividend yield was 0.35% in 2024, and payout ratio reached 8.40%. The year before the numbers were 0.43% and 14.79% correspondingly. See high-dividend stocks and find more opportunities for your portfolio.
As of Feb 7, 2026, the company has 284 employees. See our rating of the largest employees — is Fineotex Chemical Limited on this list?
EBITDA measures a company's operating performance, its growth signifies an improvement in the efficiency of a company. Fineotex Chemical Limited EBITDA is 1.12 B INR, and current EBITDA margin is 23.92%. See more stats in Fineotex Chemical Limited financial statements.
Like other stocks, FCL shares are traded on stock exchanges, e.g. Nasdaq, Nyse, Euronext, and the easiest way to buy them is through an online stock broker. To do this, you need to open an account and follow a broker's procedures, then start trading. You can trade Fineotex Chemical Limited stock right from TradingView charts — choose your broker and connect to your account.
Investing in stocks requires a comprehensive research: you should carefully study all the available data, e.g. company's financials, related news, and its technical analysis. So Fineotex Chemical Limited technincal analysis shows the sell today, and its 1 week rating is sell. Since market conditions are prone to changes, it's worth looking a bit further into the future — according to the 1 month rating Fineotex Chemical Limited stock shows the sell signal. See more of Fineotex Chemical Limited technicals for a more comprehensive analysis.
If you're still not sure, try looking for inspiration in our curated watchlists.
If you're still not sure, try looking for inspiration in our curated watchlists.