FFUSDT – 6H Falling Wedge Compression Near BreakoutOn the 6H timeframe, the larger structure is a clear falling wedge, formed by two converging downward trendlines. Price has been respecting this structure for months, printing lower highs and lower lows while volatility gradually compresses.
Now price is sitting near the upper boundary of the wedge
Related pairs

$FFUSDT (1H) Price AnalysisAt the moment, price has not yet retraced into the marked demand zone. A pullback into this area — or even a shallow retracement above it — will be crucial to confirm buyer strength. If instead FF price continues upward and taps the higher-timeframe (HTF) supply zone around $0.08465–$0.08527, this r

FFUSDT Forming Falling WedgeFFUSDT is forming a clear falling wedge pattern, a classic bullish reversal signal that often indicates an upcoming breakout. The price has been consolidating within a narrowing range, suggesting that selling pressure is weakening while buyers are beginning to regain control. With consistent volume

FF looks Bearish (4H)It appears that we have an ABC pattern in which wave B formed a triangle, and the final leg of this triangle | wave e of B | has now completed. The price is entering a larger wave C, which is a bearish wave.
A 4-hour candle closing above the invalidation level will invalidate this analysis.
The ta

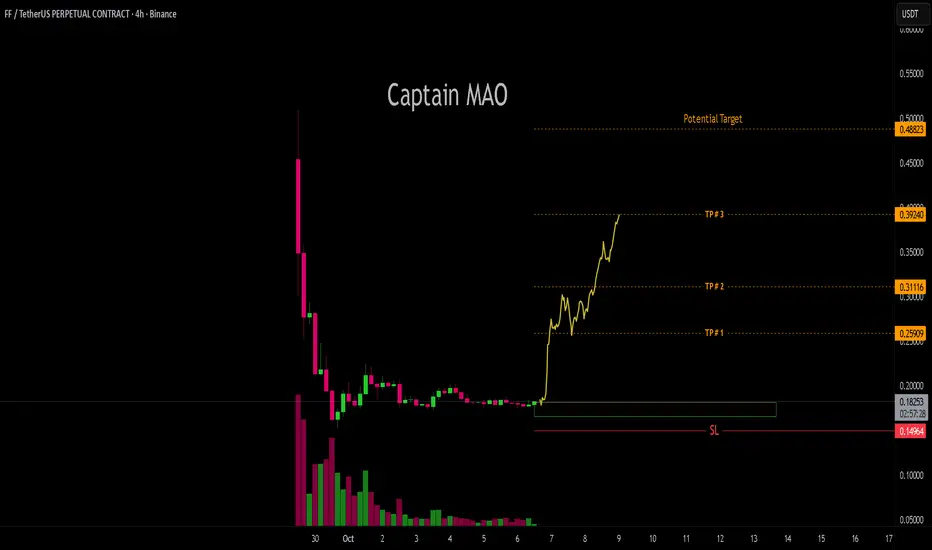
FF
...
Gray line - entry point
Red line - mandatory stop loss
Green line - approximate take profit
Black text above the green line - current data at the time of publication (volume/date/intraday price movement)

FF Looks Bullish (2H)FFUSDT has been ranging within a zone for a while, taking out both buyers’ and sellers’ stop-losses. After creating a large liquidity pool at the bottom and sweeping that lower pool, it now appears ready to move toward the key level.
On this timeframe, we have a bullish outlook on the FFUSDT pair.

FFUSDT Forming Bullish WaveFFUSDT is currently displaying a bullish wave pattern, indicating a potential continuation of its upward momentum. This technical formation often appears when a cryptocurrency consolidates after an accumulation phase, setting the stage for a significant move higher. The good trading volume confirms

FFUSDT UPDATE#FF
UPDATE
FF Technical Setup
Pattern: Symmetrical triangle breakout
Current Price: $0.157
Target Price: $0.215
Target % Gain: 155.46%
NYSE:FF has broken out of a symmetrical triangle pattern on the 4H timeframe, signaling a potential bullish continuation. With the current price at $0.157, the


FF/USDT – Stabilizing After 70% Drop, Base Formation Signals RecAfter a sharp 70% decline from its listing highs, FF is finally showing signs of stabilization and base formation. Price action has started to consolidate within a well-defined support zone, suggesting that sellers are exhausted and buyers are gradually stepping in to accumulate.
See all ideas
Summarizing what the indicators are suggesting.
Oscillators
Neutral
SellBuy
Strong sellStrong buy
Strong sellSellNeutralBuyStrong buy
Oscillators
Neutral
SellBuy
Strong sellStrong buy
Strong sellSellNeutralBuyStrong buy
Summary
Neutral
SellBuy
Strong sellStrong buy
Strong sellSellNeutralBuyStrong buy
Summary
Neutral
SellBuy
Strong sellStrong buy
Strong sellSellNeutralBuyStrong buy
Summary
Neutral
SellBuy
Strong sellStrong buy
Strong sellSellNeutralBuyStrong buy
Moving Averages
Neutral
SellBuy
Strong sellStrong buy
Strong sellSellNeutralBuyStrong buy
Moving Averages
Neutral
SellBuy
Strong sellStrong buy
Strong sellSellNeutralBuyStrong buy
Displays a symbol's price movements over previous years to identify recurring trends.
Frequently Asked Questions
The current price of FF / TetherUS (FF) is 0.08187 USDT — it has risen 1.77% in the past 24 hours. Try placing this info into the context by checking out what coins are also gaining and losing at the moment and seeing FF price chart.
FF / TetherUS price has risen by 0.35% over the last week, its month performance shows a −8.70% decrease, and as for the last year, FF / TetherUS has increased by 63.74%. See more dynamics on FF price chart.
Keep track of coins' changes with our Crypto Coins Heatmap.
Keep track of coins' changes with our Crypto Coins Heatmap.
FF / TetherUS (FF) reached its highest price on Sep 29, 2025 — it amounted to 0.58000 USDT. Find more insights on the FF price chart.
See the list of crypto gainers and choose what best fits your strategy.
See the list of crypto gainers and choose what best fits your strategy.
FF / TetherUS (FF) reached the lowest price of 0.04800 USDT on Oct 10, 2025. View more FF / TetherUS dynamics on the price chart.
See the list of crypto losers to find unexpected opportunities.
See the list of crypto losers to find unexpected opportunities.
The safest choice when buying FF is to go to a well-known crypto exchange. Some of the popular names are Binance, Coinbase, Kraken. But you'll have to find a reliable broker and create an account first. You can trade FF right from TradingView charts — just choose a broker and connect to your account.
FF / TetherUS (FF) is just as reliable as any other crypto asset — this corner of the world market is highly volatile. Today, for instance, FF / TetherUS is estimated as 6.42% volatile. The only thing it means is that you must prepare and examine all available information before making a decision. And if you're not sure about FF / TetherUS, you can find more inspiration in our curated watchlists.
You can discuss FF / TetherUS (FF) with other users in our public chats, Minds or in the comments to Ideas.