FIDAUSDT 2D#FIDA is moving inside a falling wedge pattern on the 2-day timeframe. Consider buying only after a solid breakout above the wedge and the SMA50. If that breakout confirms, the potential upside targets are:
🎯 $0.0662
🎯 $0.0765
🎯 $0.0872
🎯 $0.0978
🎯 $0.1130
🎯 $0.1323
⚠️ Always remember to use a tig

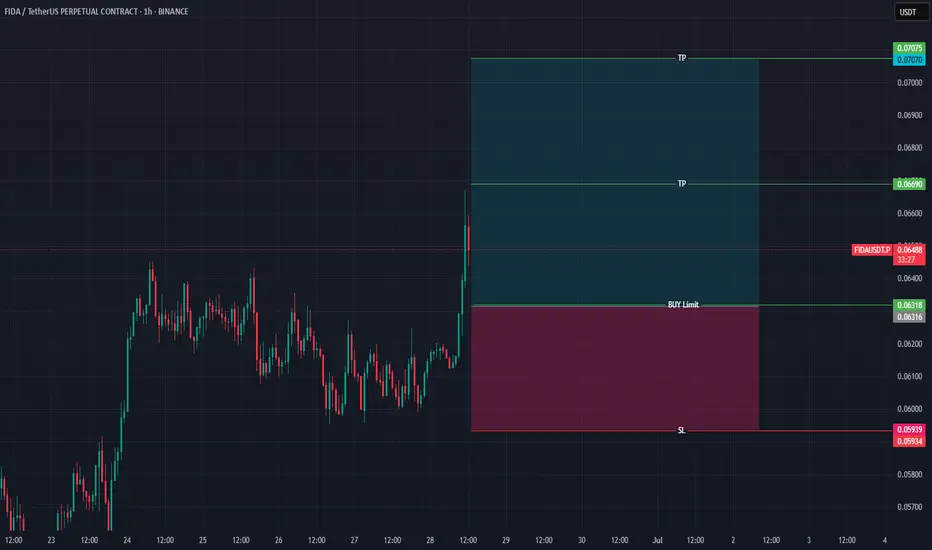
FIDA BREAKOUT CONFIRMEDFIDA Technicals look Bullish and it's sitting in strong liquidity demand zone. Use proper risk management. The total crypto market cap rose amid extreme fear sentiment (index 18), a contrarian signal that often precedes rebounds. FIDA’s shows technical oversold conditions with speculative volume

FIDAUSDT Trading Idea.Likely a reversal to the downside from $0.21650, $0.23700 OR $0.25900 provided the one week order block is not mitigated.
The preferred position should be a short position.

FIDAUSDT 1D#FIDA has broken above the falling wedge pattern on the daily timeframe, and a retest of the pattern is possible. The targets are:
🎯 $0.1111
🎯 $0.1202
🎯 $0.1293
⚠️ Always remember to use a tight stop-loss and follow proper risk management.

FIDAUSDT Forming Falling WedgeFIDAUSDT is emerging as a strong contender for mid-term bullish momentum as technical and fundamental indicators start aligning in favor of buyers. FIDA, the native token of the Bonfida ecosystem, has shown consistent development progress and increasing adoption, especially in the Solana-based DeFi

Bonfida —Solana Name Service Strong 900% Target MappedI have another one for you and this one we've been looking at for some time. Bonfida —Solana Name Service (FIDAUSDT).
This is a good project, based on the chart. The December 2024 high was set at 0.4277. This is a "mandatory" target, that is, an easy hit or must hit because the market tends to chal

Solana Name Service—Bonfida, Bull Market Volume (2,450% PP)Sometimes just one signal is enough. We have a clear bottom pattern and the highest volume ever. The interesting part is that trading volume started to rise significantly in September 2024, a long time ago. There is lots of interest for this pair.
Solana Name Service—Bonfida—FIDAUSDT is still early

Bonfida – The Sleeping Giant. A 1:17 Risk-Reward Setup!Current Situation:
Bonfida (FIDA) is showing signs of forming a long-term bullish trend after a correction. The price is holding above key support levels, and trading volume is increasing amid a broader crypto market recovery.
Trade Parameters:
Entry Price: $0.0660
Stop Loss: $0.0550 (~16.6% ri

FIDAUSDT 1D Analysis FIDA ~ 1D Analysis
#FIDA Buy incrementally on retesting this support block with a short term target of at least 10%+ from here.

See all ideas
Summarizing what the indicators are suggesting.
Oscillators
Neutral
SellBuy
Strong sellStrong buy
Strong sellSellNeutralBuyStrong buy
Oscillators
Neutral
SellBuy
Strong sellStrong buy
Strong sellSellNeutralBuyStrong buy
Summary
Neutral
SellBuy
Strong sellStrong buy
Strong sellSellNeutralBuyStrong buy
Summary
Neutral
SellBuy
Strong sellStrong buy
Strong sellSellNeutralBuyStrong buy
Summary
Neutral
SellBuy
Strong sellStrong buy
Strong sellSellNeutralBuyStrong buy
Moving Averages
Neutral
SellBuy
Strong sellStrong buy
Strong sellSellNeutralBuyStrong buy
Moving Averages
Neutral
SellBuy
Strong sellStrong buy
Strong sellSellNeutralBuyStrong buy
Displays a symbol's price movements over previous years to identify recurring trends.