Filecoin (FIL): Expecting Good Bounce From Here | Good R:R TradeFIL is sitting right at the support zone, where buyers continue to defend the level. As long as this zone holds, we are looking at the possibility of a bounce toward higher targets. The key for continuation will be breaking above the trendline resistance and reclaiming the EMAs, which would open the
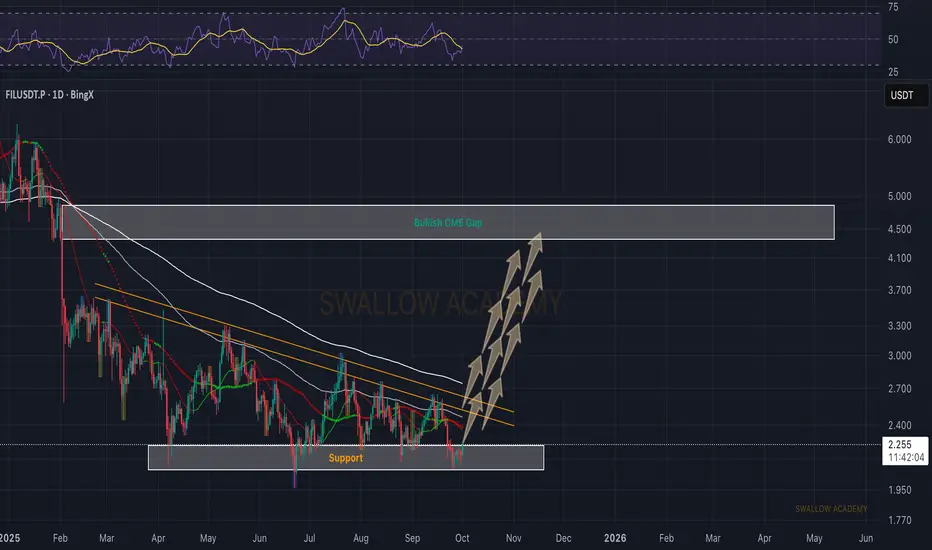
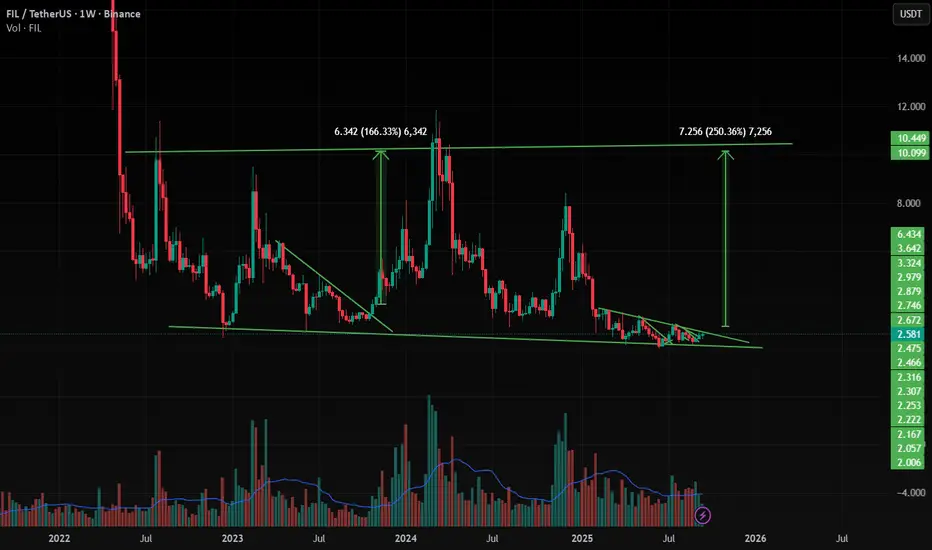
First TP 280%We need to address all the items in the chart. First, the target price is 280%, and after that, it should exceed 800%.
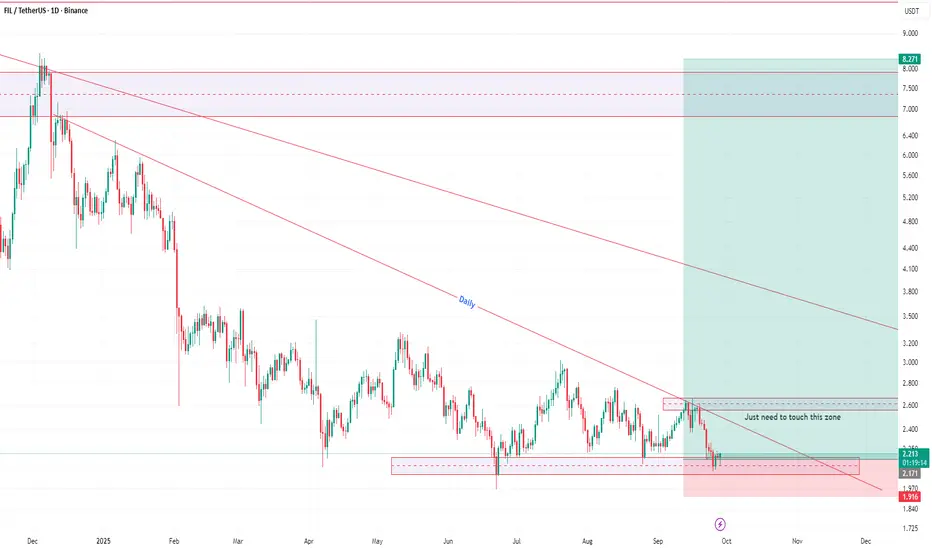
Filecoin (FIL): Easiest Prediction So Far | Risk:Reward 1:7 Our entry got triggered from last time when we were looking for the last liquidity sweep, which indicated that upcoming bullish movement might follow up, and that's exactly what has happened so far.
Buyers are dominating, and we are seeing good chances for our target to be filled; it is just a rep

FIL – Testing Post-Breakout Support📆 On the 3D timeframe, LSE:FIL broke out of a descending triangle but failed to sustain its upward momentum ⚠️. Price is now testing the lower horizontal support 🛡️.
This level is critical — holding here could stabilize the structure for another move up, while a break below may signal deeper down
TP HIT Yester I shared an idea about a position on BINANCE:FILUSDT
It went as planned hope you guys could take profit as well
Stay focused, stay hard see you on the next position.

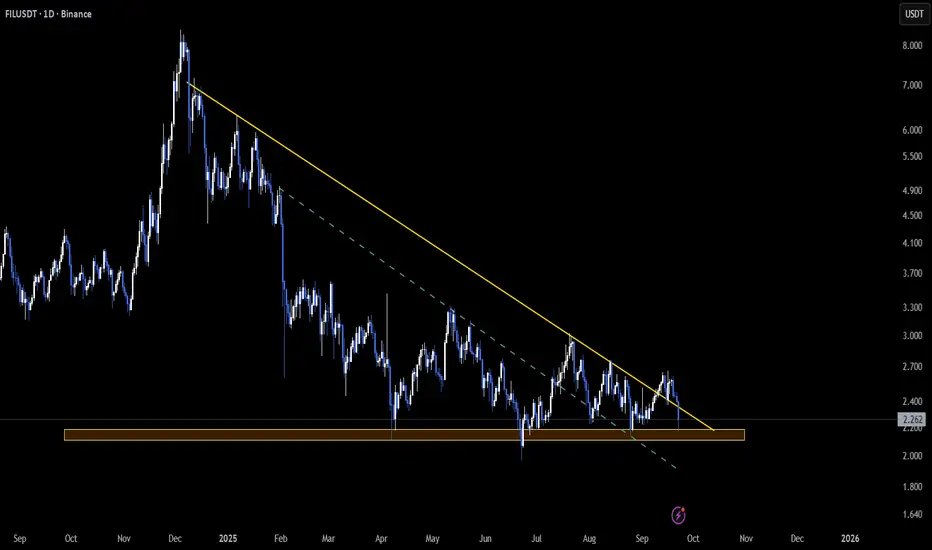
filusdtAfter the fil currency breaks out of the desired pattern and retests the resistance that was broken, I think the target of 3.3 and 3.7 is available.
FIL | Swing Trade Setup from Key Support ZoneFilecoin (FIL) is hovering near a major support zone between $2.47 and $2.55, offering a high-probability swing trade opportunity. The recent pullback has brought price action into a known demand area, and while momentum has cooled off, the broader market structure remains bullish. If the level hold


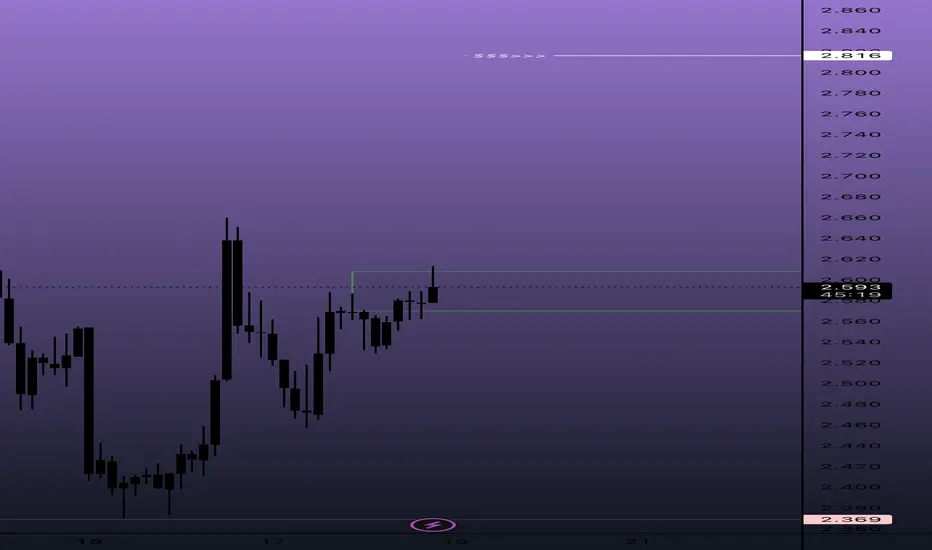
$fil updates Not much to say here, again, positives is we are ranging high end $2.50+ handle.
Crucial in this range ($2.570-$2.608)
If she can settle this nicely on closures the next hurdle before $4.20 will be $2.816 taking us back into the realms of $2.90 where it should play some major supp/res.
I really t
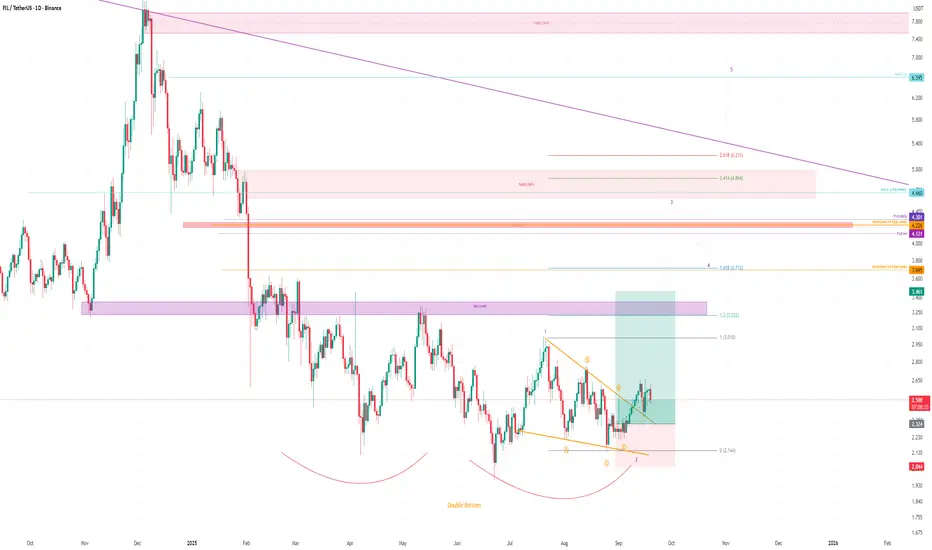
FIL is Ready to Move 200% + Up FIL is making a Triangle pattern at Support zone and It is Ready for Breakout from that pattern . and at the same time Altcoin Season Index is at 74 , when it is >75 it is sign of very bullish in altcoins and Breakouts will have very high potential to give a big move .
and at the same time Bitcoin
See all ideas
Summarizing what the indicators are suggesting.
Oscillators
Neutral
SellBuy
Strong sellStrong buy
Strong sellSellNeutralBuyStrong buy
Oscillators
Neutral
SellBuy
Strong sellStrong buy
Strong sellSellNeutralBuyStrong buy
Summary
Neutral
SellBuy
Strong sellStrong buy
Strong sellSellNeutralBuyStrong buy
Summary
Neutral
SellBuy
Strong sellStrong buy
Strong sellSellNeutralBuyStrong buy
Summary
Neutral
SellBuy
Strong sellStrong buy
Strong sellSellNeutralBuyStrong buy
Moving Averages
Neutral
SellBuy
Strong sellStrong buy
Strong sellSellNeutralBuyStrong buy
Moving Averages
Neutral
SellBuy
Strong sellStrong buy
Strong sellSellNeutralBuyStrong buy
Displays a symbol's price movements over previous years to identify recurring trends.