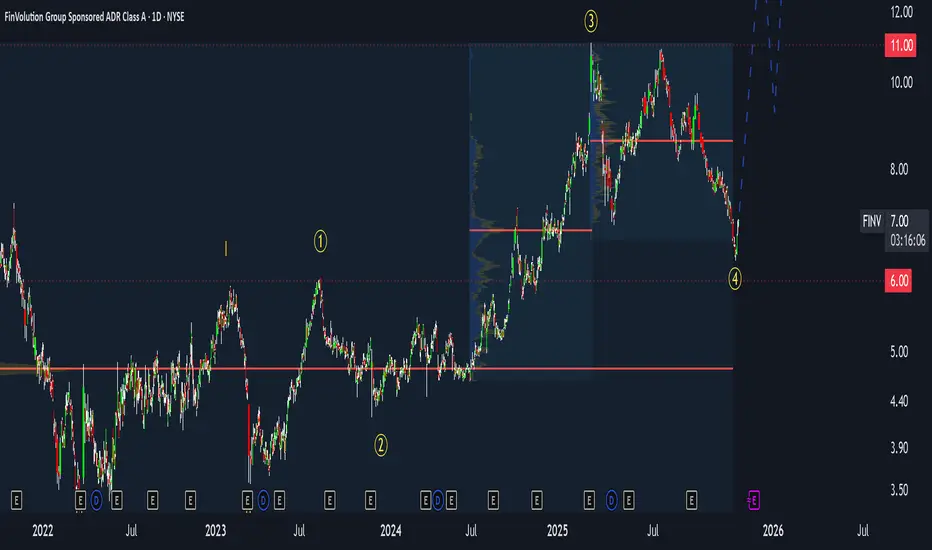
FinVolution (FINV)- Massive Selloff, Massive Opportunity?⚡ Market Context
FinVolution ( NYSE:FINV ) just went through one of its strongest selloffs in years.
After the recent earnings release, the stock dropped about 12 percent in one session and roughly 60 percent over the last six months.
What is surprising is that the earnings report itself was not b
FinVolution Group Sponsored ADR Class A
No trades
Next report date
—
Report period
—
EPS estimate
—
Revenue estimate
—
1.53 USD
331.14 M USD
1.83 B USD
140.02 M
About FinVolution Group Sponsored ADR Class A
Sector
Industry
CEO
Tie Zheng Li
Website
Headquarters
Shanghai
Founded
2007
IPO date
Nov 10, 2017
Identifiers
3
ISIN US31810T1016
FinVolution Group is an online consumer finance platform in China connecting underserved individual borrowers with financial institutions. It developed technologies and accumulated in-depth experience in the core areas of credit risk assessment, fraud detection, big data, and artificial intelligence. The company's platform empowered by proprietary cutting-edge technologies, features an automated loan transaction process, which enables superior user experience. The company was founded by Shao Feng Gu, Hong Hui Hu, Tie Zeng Li, and Jun Zhang in June 2007 and is headquartered in Shanghai, China.
Related stocks

FinVolution Group (FINV) - A Quiet Giant on the Edge of Breakout⚡ FinVolution Group (FINV) — A Quiet Giant on the Edge of Breakout
While everyone is chasing the inflated Big Tech bubble, a much quieter — and potentially far more explosive — opportunity is forming right now in the fintech and online lending space.
That opportunity is FinVolution Group (FINV) —
FINV on WatchLooking for a pullback to close the gap.
Why:
Rejected at 1.618 fib extension
Gap to close
High green volume
Bullish MACD

FINV (FinVolution Group) – 30-Min Short Trade Setup !📉🚨
🔹 Asset: FINV – NYSE
🔹 Timeframe: 30-Min Chart
🔹 Setup Type: Bearish Breakdown (Rising Wedge Pattern)
📊 Trade Plan (Short Position)
✅ Entry Zone: Below $10.65 (Breakdown Confirmation)
✅ Stop-Loss (SL): Above $11.27 (Key Resistance Level)
🎯 Take Profit Targets
📌 TP1: $10.05 (Support Level)
📌 TP2

Finvolution...weekly flag and a monthly compressionNYSE:FINV is setting up on the weekly chart, forming a flag
On the monthly chart you can see a descending trendline that has been tested and looks to be broken on the daily, if broken on the weekly & monthly can be significant
Stop loss choices are 6.6 (9EMA weekly) or 6.2 (21 EMA weekly)
Take pro

Long swingI'm deploying a multi-timeframe approach here, focusing on a swing trade setup that aligns with both trend and momentum indicators. Here's the core of the strategy:
Entry Criteria: I look to enter on a break above a recent higher high combined with a flat to rising 5-day moving average. Additionall


See all ideas
Summarizing what the indicators are suggesting.
Neutral
SellBuy
Strong sellStrong buy
Strong sellSellNeutralBuyStrong buy
Neutral
SellBuy
Strong sellStrong buy
Strong sellSellNeutralBuyStrong buy
Neutral
SellBuy
Strong sellStrong buy
Strong sellSellNeutralBuyStrong buy
An aggregate view of professional's ratings.
Neutral
SellBuy
Strong sellStrong buy
Strong sellSellNeutralBuyStrong buy
Neutral
SellBuy
Strong sellStrong buy
Strong sellSellNeutralBuyStrong buy
Neutral
SellBuy
Strong sellStrong buy
Strong sellSellNeutralBuyStrong buy
Displays a symbol's price movements over previous years to identify recurring trends.