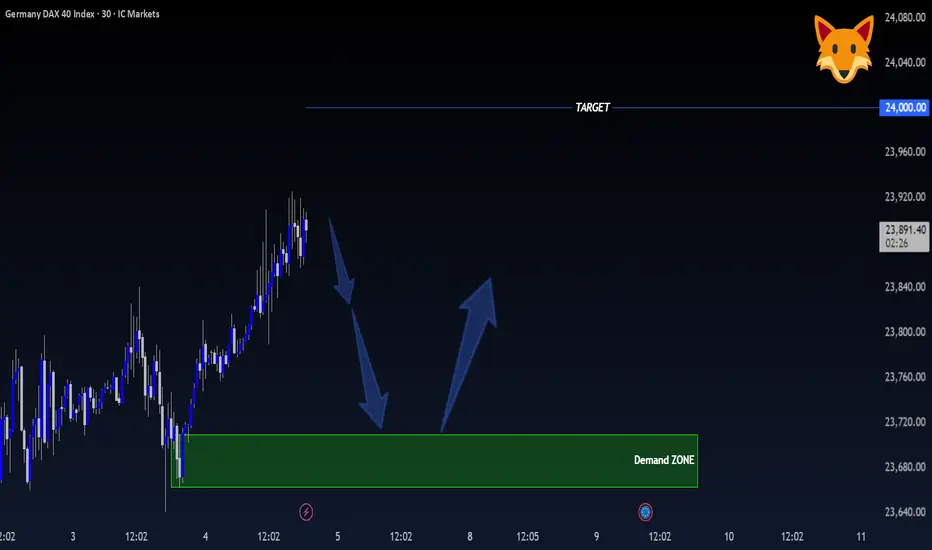
GER40 – 30-Minute Timeframe Tradertilki AnalysisGuys,
I have prepared a GER40 analysis for you.
On the 30-minute timeframe, if GER40 makes a pullback, I will open a buy position between 23,709 - 23,668.
My target will be the 24,000 level.
My friends, I share these analyses thanks to each like I receive from you.
Your likes increase my motivation and encourage me to support you in this way.🙏✨
Thank you to all my friends who support me with their likes.❤️
Trade ideas
Potential bullish rise?DAX40 (DE40) is reacting off the pivot which is a pullback resitance and could rise to the 1st resitance, which has been identified as a swing high resistance.
Pivot: 23,877.01
1st Support: 23,500.65
1st Resistance: 24,453.76
Disclaimer:
The opinions given above constitute general market commentary and do not constitute the opinion or advice of IC Markets or any form of personal or investment advice.
Any opinions, news, research, analyses, prices, other information, or links to third-party sites contained on this website are provided on an "as-is" basis, are intended to be informative only, and are not advice, a recommendation, research, a record of our trading prices, an offer of, or solicitation for, a transaction in any financial instrument and thus should not be treated as such. The information provided does not involve any specific investment objectives, financial situation, or needs of any specific person who may receive it. Please be aware that past performance is not a reliable indicator of future performance and/or results. Past performance or forward-looking scenarios based upon the reasonable beliefs of the third-party provider are not a guarantee of future performance. Actual results may differ materially from those anticipated in forward-looking or past performance statements. IC Markets makes no representation or warranty and assumes no liability as to the accuracy or completeness of the information provided, nor any loss arising from any investment based on a recommendation, forecast, or any information supplied by any third party.

DAX Hidden Sell Signal on this 4H Golden Cross?DAX (DE40) has been trading within a Channel Up (green) since its 1W MA50 (red trend-line) market bottom and yesterday it formed a 4H Golden Cross. That is technically a bullish pattern but in the past 5 months, every such formation (3 in total) has been an indication of a market Top, thus a bearish signal.
More specifically, the most it took for DAX to form a top after a 4H Golden Cross within this time-frame, has been 4 days. And as you can see it's also been similar Channel Up patterns that peaked after this Cross, on an identical Lower Highs trend-line like the one that the index is about to test.
What's even more striking is that every sell-off that followed the Tops was exactly -5.15%. Identical on all 3 occasions. As a result, it is possible for DAX to decline as low as 23050 following the upcoming top. Since however the 1W MA50 is involved this time as a Support, you may want to book profits there earlier, around 23300, if you see it acting as a Support with strong buying pressure.
---
** Please LIKE 👍, FOLLOW ✅, SHARE 🙌 and COMMENT ✍ if you enjoy this idea! Also share your ideas and charts in the comments section below! This is best way to keep it relevant, support us, keep the content here free and allow the idea to reach as many people as possible. **
---
💸💸💸💸💸💸
👇 👇 👇 👇 👇 👇


Dax to the upside!Hi
on the 4h TF. Dax bounced strongly from the bottom to break a critical resistance level then went to the next resistance then broke through it to the upside and even bounced up from after it settled on with a pin bar 4H candle and that is the big view of the DAX based on the 4H TF.
3 TPs are there, however, if you accept and tolerate the bearish pullbacks on the journey to TP3, as long the last support level or (the above line) will not be broken by a 4H candle (closing price not by a wick) then TP3 will be your main and real target on DAX.
Fundamentally the next week will offer the Fed interest rate decision which has strong expectations of another rate cut! and may we see currently the preparation on the chart for that move!
Note:
Please do not share or copy my own work! It reflects my own vision and view to that index and it is advertised to not be taken as a legal advice for traders to follow, however, it is not more than an own opinion and analysis to be shared with you!
Good luck ;)

DAX SELL 4HChart Analysis (DAX Index – 4H)
1. General Trend Context
The chart shows the DAX in a broad corrective structure, moving under a large descending curve (red dashed arc) indicating a medium-term bearish bias.
Price has recently rebounded from the lower support area, but it is still trading below major resistance zones.
2. Key Technical Zones
🔴 Resistance Areas
24,150 – 24,500
Strong resistance cluster made of Fibonacci levels and historical supply.
Also includes the stop zone for the planned short position.
24,825 region
Major swing high and top of the corrective arc.
Bears are expected to dominate here.
🟢 Support Areas
23,400 – 23,000
Important horizontal support (0.5 Fibonacci retracement).
First potential target for bearish movement.
22,300 – 22,000
Strong support zone aligned with deeper Fibonacci levels and historical demand.
21,250 – 21,150
Major long-term support zone.
The projected final bearish target (green target box).
3. Projected Price Path
🟠 Bearish Scenario (Main)
This is the main scenario illustrated by the orange/red movement:
Price rises slightly to the 24,300–24,450 area →
A short entry is triggered with stop at 24,790 →
A strong downward leg begins, targeting:
23,400
22,800
Final target around 21,250 (≈ -11.7%)
This aligns with the long-term descending curve and Fibonacci projections.
4. Alternative Scenario (Bullish Reversal)
🔵 Bullish Path
If the market reaches the 21,250 major support zone, a strong rebound is expected.
This is drawn as the blue arrow.
The bullish move could develop into a trend reversal, potentially pushing back toward:
22,800
23,800
and even higher if momentum strengthens.
5. Trade Setup Displayed
Short Position
Entry: ~24,150
Stop: 24,790
Take-Profit: 21,250
Risk/Reward ≈ 8.27 (very favorable)
This setup is based on hitting a strong resistance zone followed by a long corrective decline.
6. Momentum Indicators
The histogram at the bottom (Awesome Oscillator) shows recent weakening, supporting the bearish continuation scenario.

GER30 H4 | Bearish Reversal?Momentum: Bullish
The price is reacting off the sell entry which aligns with the 145% Fibonacci extension, which adds significant strength to this level.
Sell entry: 24,125.22
Pullback resistance
145% Fibonacci extension
Stop loss: 24,479.29
Swing high resistance
Take profit: 23,684.50
Pullback support.
38.2% Fibonacci retracement.
High Risk Investment Warning
Stratos Markets Limited (tradu.com ), Stratos Europe Ltd (tradu.com ):
CFDs are complex instruments and come with a high risk of losing money rapidly due to leverage. 70% of retail investor accounts lose money when trading CFDs with this provider. You should consider whether you understand how CFDs work and whether you can afford to take the high risk of losing your money.
Stratos Global LLC (tradu.com ): Losses can exceed deposits.
Please be advised that the information presented on TradingView is provided to Tradu (‘Company’, ‘we’) by a third-party provider (‘TFA Global Pte Ltd’). Please be reminded that you are solely responsible for the trading decisions on your account. Any information and/or content is intended entirely for research, educational and informational purposes only and does not constitute investment or consultation advice or investment strategy. The information is not tailored to the investment needs of any specific person and therefore does not involve a consideration of any of the investment objectives, financial situation or needs of any viewer that may receive it. Past performance is not a reliable indicator of future results. Actual results may differ materially from those anticipated in forward-looking or past performance statements. We assume no liability as to the accuracy or completeness of any of the information and/or content provided herein and the Company cannot be held responsible for any omission, mistake nor for any loss or damage including without limitation to any loss of profit which may arise from reliance on any information supplied by TFA Global Pte Ltd.

GER40I'll be looking out for sells this week. Currently approaching D OB and have already swept liquidity. Also there is a low trend-line break and retest.

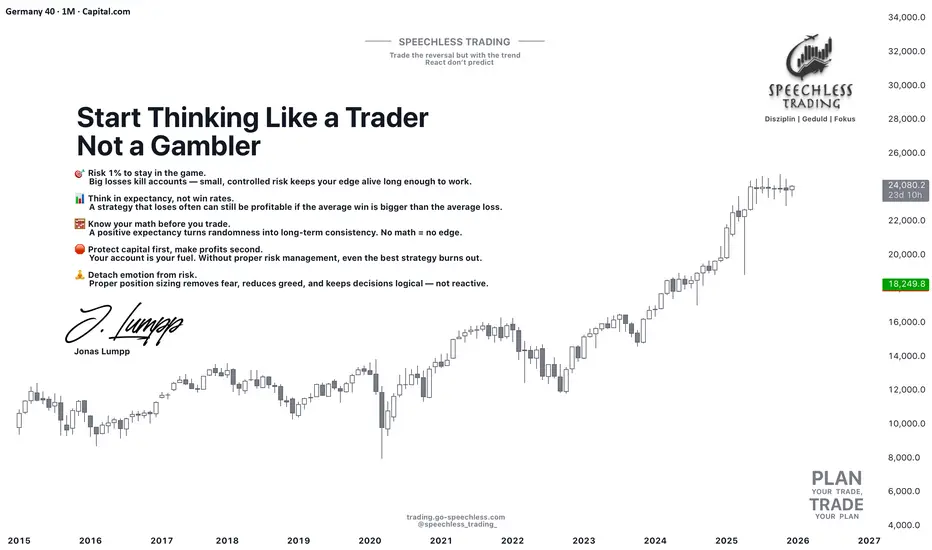
Risk Management Basics 95% of Traders IgnoreWhen traders try to improve their results, they often jump straight to indicators, new setups, or refined entries.
But here’s the uncomfortable truth:
Most traders don’t fail because of their strategy — they fail because they don’t control their risk.
Let’s break down the two fundamentals that separate professionals from the 95%:
1️⃣ The 1% Rule: Your Built-In Survival System
Most beginners risk 5–20% per trade.
Professionals risk a maximum of 1%. Why?
Because the goal isn’t to win every trade — the goal is to stay in the game long enough for your edge to play out.
Risking only 1% means:
✔ A losing streak won’t destroy your account
✔ Your emotions stay stable and rational
✔ Your system has room to unfold statistically
✔ You avoid the #1 account killer: overexposure
Here’s the key mindset shift:
Risk management is not about fear — it’s about increasing your probability of long-term profitability.
2️⃣ Positive Expectancy: The Math Behind Winning Traders
Most traders judge a setup based on the last one or two trades.
Professionals evaluate it based on expectancy — the average profit per trade across a large sample.
Here’s a simple example:
Win rate: 40%
Average win: +60 pips
Average loss: –30 pips
Expectancy =
(0.4 × 60) – (0.6 × 30) = +6 pips per trade
Meaning:
You can lose more trades than you win — and still be profitable.
This is the principle beginners never understand.
A system with positive expectancy + 1% risk per trade becomes extremely powerful.
You stop caring about individual losses and start thinking in probabilities, not emotions.
The Truth Most Traders Miss
➡️ Risk management is the strategy.
➡️ Expectancy matters more than your win rate.
➡️ Risking 1% won’t make you rich fast — but it will prevent you from blowing up.
➡️ Trading becomes easier when you remove the illusion of certainty.
If traders spent more time understanding expectancy and risk instead of chasing “perfect setups,” half of their frustration would disappear overnight.
Thanks for reading — and have a disciplined start to your trading week!
If you found this post valuable, let me know in the comments.
I might create a full series on applied risk management and expectancy modeling.
Jonas Lumpp
Speechless Trading
Disclaimer: This tutorial is for educational purposes only and does not constitute financial advice. Its goal is to help traders develop a professional mindset, improve risk management, and make more structured trading decisions.
07.12.25 Market AnalysisSorry for microphone, but i think i give you important levels of nasdaq, bitcoin, gold, usdjpy, wti and more.. Next week BOJ and FED will come with spicy news :) so be carefula about positions. Better smaller lots..
Thanks for now. Videos will come..
DYOR.
MEC

Long for DAX, GER40
We have a Bullish Bias on 1W
On daily we are now rejecting from FVG
On 4H we close above first daily rejection
Entry from FVA on 4H
Stop below bullish candle
TP = 2R

Bullish Setup for DAX or GER40- Bullish Bias on 1M TF
- Bullish Bias on 1D with BAG (Breakaway gap)
- Bullish Bias on 4h
We can set limit order on 4H or take an intraday trade from 4H FVG (any pattern on 15m - unicorn, rapid shift, FVG chain etc.)

DAX40 Momentum Shift: Layered Buy Setup for Clean Profit Flow🚀 DAX40 (GER40) BULLISH BREAKOUT ALERT! | Layer Strategy for MAX Gains 🚀
📈 DAX40 BULLISH BREAKOUT CONFIRMED! 🏆 (Swing/Day Trade Setup with Layer Entry)
📊 Idea: Strong bullish momentum on the GER40 / DAX 40 following a decisive breakout above key moving averages! Perfect setup for a structured "thief-style" layered entry to capitalize on the trend.
🔑 KEY LEVELS & PLAN:
Trend: Bullish (MA Breakout Confirmation)
Entry Strategy: "Thief" Layer Method 🎯
Use multiple BUY LIMIT orders at key dips: 23,600 | 23,700 | 23,800 | 23,900 (Add more layers based on your capital).
This averages your entry and maximizes opportunity on pullbacks.
Stop Loss (SL): 23,400 (Thief OG's Zone ⚠️).
IMPORTANT NOTE: Adjust your SL based on YOUR risk tolerance & strategy! This is a guide, not financial advice. Protect your capital.
Take Profit (TP): Target Zone: 24,500 🎯
Strong resistance & potential overbought trap area. Secure profits wisely!
REMINDER: Manage your own TP. Take money at your own risk.
💎 PRO TRADER NOTES:
This "thief" layer strategy requires patience & discipline. Let the market come to your orders. Never risk more than 1-2% per layer. Trade with a plan, not emotion!
🌍 RELATED PAIRS TO WATCH (KEY CORRELATIONS):
FX:EURUSD : INVERSE Correlation. A stronger Euro can pressure DAX (export-heavy index). Watch for USD weakness supporting DAX rallies.
CAPITALCOM:US30 (Dow Jones) / SP:SPX (S&P 500): POSITIVE Correlation. US market strength often lifts European indices. Key for overall risk sentiment.
ICMARKETS:STOXX50 (Euro Stoxx 50): HIGH Correlation. Broader European index performance.
BUND Futures (/FGBL): INVERSE Correlation. Rising German bond yields (falling prices) can signal economic optimism, often supporting DAX.
EUR/GBP ( OANDA:EURGBP ): UK/EU economic relative strength flows.
👇 LIKE & FOLLOW if you found this useful!
💬 COMMENT your entry levels or chart insights below!
🔔 Click the BELL on my profile for real-time idea alerts!
#DAX #GER40 #TradingView #Breakout #Bullish #SwingTrading #DayTrading #LayerStrategy #TradingPlan #Forex #Indices #Investing #Stocks #ThiefStrategy #EURUSD
Ger30We can see that price has restest the previous demand zone to be strong level of support, and more bullish momentumm still expected till the supply formed.

GER40🎙 Market Update – German DAX
The German DAX is showing clear bearish pressure, and in the coming period, we’re targeting the downside level at 23,890.
This bearish scenario becomes invalid if price reaches 24,250, as a move toward that level signals a potential shift in market structure.
Stay alert and trade with discipline.

DAX pivotal resistance at 23870The DAX remains in a bullish trend, with recent price action showing signs of a breakout within the broader uptrend.
Support Zone: 23870 – a key level from previous consolidation. Price is currently testing or approaching this level.
A bullish rebound from 23870 would confirm ongoing upside momentum, with potential targets at:
24300 – initial resistance
24450 – psychological and structural level
24560 – extended resistance on the longer-term chart
Bearish Scenario:
A confirmed break and daily close below 23870 would weaken the bullish outlook and suggest deeper downside risk toward:
23712 – minor support
23600 – stronger support and potential demand zone
Outlook:
Bullish bias remains intact while the DAX holds above 23870. A sustained break below this level could shift momentum to the downside in the short term.
This communication is for informational purposes only and should not be viewed as any form of recommendation as to a particular course of action or as investment advice. It is not intended as an offer or solicitation for the purchase or sale of any financial instrument or as an official confirmation of any transaction. Opinions, estimates and assumptions expressed herein are made as of the date of this communication and are subject to change without notice. This communication has been prepared based upon information, including market prices, data and other information, believed to be reliable; however, Trade Nation does not warrant its completeness or accuracy. All market prices and market data contained in or attached to this communication are indicative and subject to change without notice.

DAX40 resistance at 24300The DAX remains in a bullish trend, with recent price action showing signs of a breakout within the broader uptrend.
Support Zone: 23870 – a key level from previous consolidation. Price is currently testing or approaching this level.
A bullish rebound from 23870 would confirm ongoing upside momentum, with potential targets at:
24300 – initial resistance
24450 – psychological and structural level
24560 – extended resistance on the longer-term chart
Bearish Scenario:
A confirmed break and daily close below 23870 would weaken the bullish outlook and suggest deeper downside risk toward:
23712 – minor support
23600 – stronger support and potential demand zone
Outlook:
Bullish bias remains intact while the DAX holds above 23870. A sustained break below this level could shift momentum to the downside in the short term.
This communication is for informational purposes only and should not be viewed as any form of recommendation as to a particular course of action or as investment advice. It is not intended as an offer or solicitation for the purchase or sale of any financial instrument or as an official confirmation of any transaction. Opinions, estimates and assumptions expressed herein are made as of the date of this communication and are subject to change without notice. This communication has been prepared based upon information, including market prices, data and other information, believed to be reliable; however, Trade Nation does not warrant its completeness or accuracy. All market prices and market data contained in or attached to this communication are indicative and subject to change without notice.

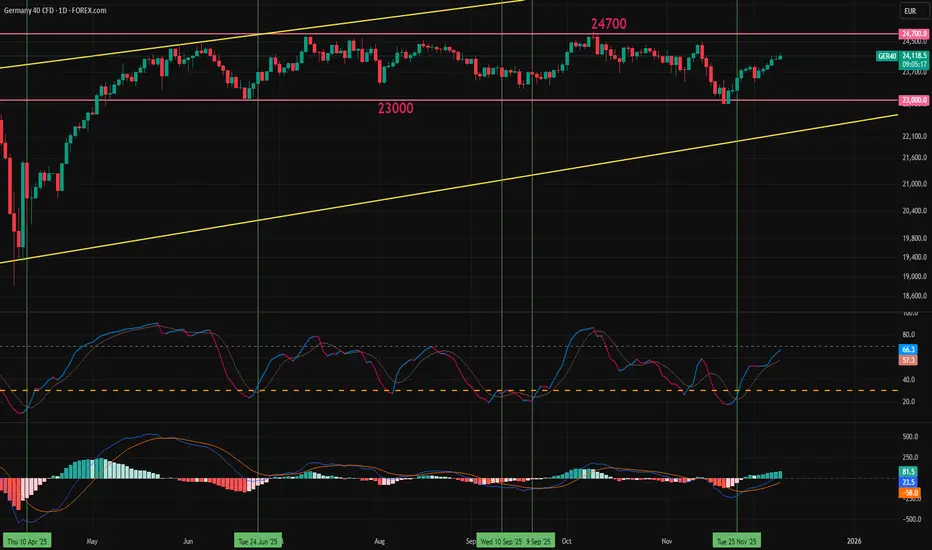
DAX Stuck in Sideways Grind, Year-End-Boost or Continued RangingThe DAX index has been moving sideways since May without any signs of a trend change. Weak German economic data, a struggling auto industry, ongoing Ukraine risks, and de-globalization moves from the US all limit the upside potential. However, with the new year approaching, incoming portfolio adjustments could provide a conservative boost to the index.
From the year start to the March top, the DAX rose more than 18% in a three-month period. After a big selloff and sharp recovery due to the April tariff announcement from Trump, returns from the start of the year reached over 23% by May. During this five-month period, the DAX positively diverged from the S&P 500, reaching above two standard deviations from the five-year average. Since then, the S&P 500 has continued to clinch gains while the DAX has been moving sideways in a 1,700-point-wide channel.
Germany's deep slump is expected to end in 2026, increasing GDP growth from 0.3% to 1% (market consensus). German CPI is expected to stay close to the 2% target like the rest of the EU, and lower ECB rates might give a conservative boost to investments. The changes are positive but not a significant boost for the DAX.
Now that the DAX/S&P 500 ratio has returned to its average, the correlation between the US stock market and the DAX might increase again. Currently, the relative momentum index (RMI) has generated a buy signal, similar to the MACD. Crossovers below “30” on the RMI and below “0” on the MACD usually provide decent bullish signals. However, the main focus will remain on the 24,700 resistance. Unless it is broken to the upside, the sideways move can be expected to continue.
Higher PMI, factory orders, and industrial production data have already shown a positive impact on the index, and post-COVID seasonality for December is historically bullish in December. The question is whether that will be enough to trigger a breakout.
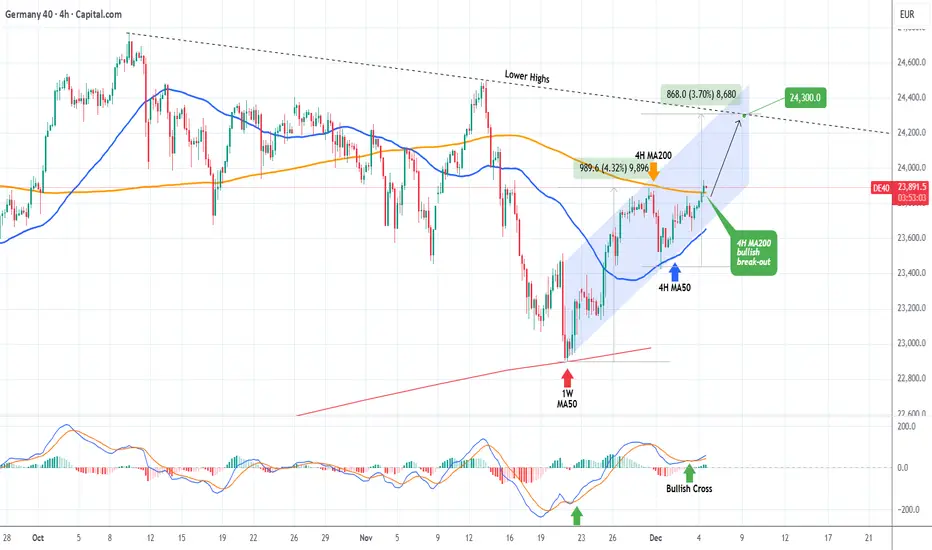
DAX Strong 4H break-out targeting 24300.DAX (DE40) has been trading within a Channel Up since the November 20 bottom on the 1W MA50 (red trend-line) and today it made a massive step upwards as it broke above its 4H MA200 (orange trend-line) for the first time in 3 weeks.
With the 4H MA50 (blue trend-line) established as the Support on the previous Higher Low, we expect this Bullish Leg to hit at least the 2-month Lower Highs trend-line at 24300.
---
** Please LIKE 👍, FOLLOW ✅, SHARE 🙌 and COMMENT ✍ if you enjoy this idea! Also share your ideas and charts in the comments section below! This is best way to keep it relevant, support us, keep the content here free and allow the idea to reach as many people as possible. **
---
💸💸💸💸💸💸
👇 👇 👇 👇 👇 👇
GER30 H4 | Potential Bullish RiseMomentum: Bullish
Price has bounced from the buy entry, which is acting as pullback support, and is currently trading above the 50% Fibonacci retracement level.
Buy Entry: 23,688.33
Pullback support
Stop Loss: 23,457.40
Strong overlap support
Take Profit: 24,112.40
Pullback resistance
145% Fibonacci extension
High Risk Investment Warning
Stratos Markets Limited (tradu.com ), Stratos Europe Ltd (tradu.com ):
CFDs are complex instruments and come with a high risk of losing money rapidly due to leverage. 70% of retail investor accounts lose money when trading CFDs with this provider. You should consider whether you understand how CFDs work and whether you can afford to take the high risk of losing your money.
Stratos Global LLC (tradu.com ): Losses can exceed deposits.
Please be advised that the information presented on TradingView is provided to Tradu (‘Company’, ‘we’) by a third-party provider (‘TFA Global Pte Ltd’). Please be reminded that you are solely responsible for the trading decisions on your account. Any information and/or content is intended entirely for research, educational and informational purposes only and does not constitute investment or consultation advice or investment strategy. The information is not tailored to the investment needs of any specific person and therefore does not involve a consideration of any of the investment objectives, financial situation or needs of any viewer that may receive it. Past performance is not a reliable indicator of future results. Actual results may differ materially from those anticipated in forward-looking or past performance statements. We assume no liability as to the accuracy or completeness of any of the information and/or content provided herein and the Company cannot be held responsible for any omission, mistake nor for any loss or damage including without limitation to any loss of profit which may arise from reliance on any information supplied by TFA Global Pte Ltd.

GER40 Trade Idea: The Perfect Pullback Before Liftoff!I enjoy trading GER40, especially during the London session, where we consistently see a phase of manipulation followed by a clean move toward the target. At the moment, the structure is showing a similar pattern.
Although the HTF suggests a broader correction toward the 22,000 area, I’m looking for a short-term setup for next week.
My scenarios:
1) Primary scenario:
A move lower into the first Daily FVG, which is also visible on the 4H and 1H timeframes—confirming its validity. After a test of this zone and a liquidity grab around the 23,700 area, I expect price to move upward toward the 0.70–0.79 Fibonacci retracement, where I will look to take profit.
2) Alternative scenario (less likely):
A deeper correction into the second Daily FVG, which is only visible on the Daily timeframe. Due to its limited confluence, this scenario has lower probability.
Execution plan:
I’ll wait for price to trade into one of these FVGs, then look for LTF reversal signals to execute a long position targeting the 0.70–0.79 Fibonacci zone.
If you enjoy this type of analysis, make sure to follow and like this idea.

DAX40 key support at 23466The DAX remains in a bullish trend, with recent price action showing signs of a breakout within the broader uptrend.
Support Zone: 23446 – a key level from previous consolidation. Price is currently testing or approaching this level.
A bullish rebound from 23446 would confirm ongoing upside momentum, with potential targets at:
23950 – initial resistance
24140 – psychological and structural level
24380 – extended resistance on the longer-term chart
Bearish Scenario:
A confirmed break and daily close below 23446 would weaken the bullish outlook and suggest deeper downside risk toward:
23350 – minor support
23200 – stronger support and potential demand zone
Outlook:
Bullish bias remains intact while the DAX holds above 23446. A sustained break below this level could shift momentum to the downside in the short term.
This communication is for informational purposes only and should not be viewed as any form of recommendation as to a particular course of action or as investment advice. It is not intended as an offer or solicitation for the purchase or sale of any financial instrument or as an official confirmation of any transaction. Opinions, estimates and assumptions expressed herein are made as of the date of this communication and are subject to change without notice. This communication has been prepared based upon information, including market prices, data and other information, believed to be reliable; however, Trade Nation does not warrant its completeness or accuracy. All market prices and market data contained in or attached to this communication are indicative and subject to change without notice.
