DE30 found the hidden buy zoneDE30 will bounce down for awhile then go back up to the moon for no reason
GER40 trade ideas

DE30 short, TP or TP+ you chooseIBD manipulation. A short term sell opportunity. For long term bias still uptrend

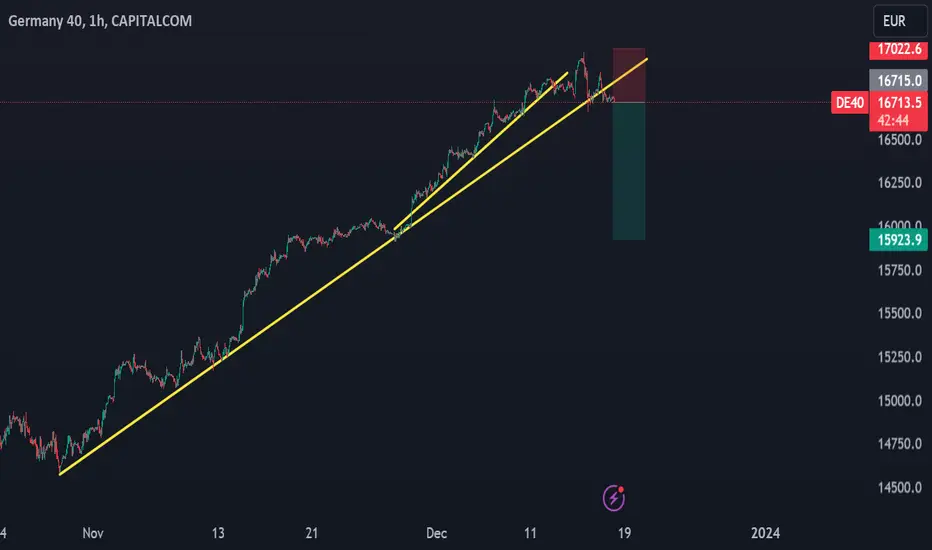
DAX: GER40 about to correctThe New Year might conclude the calm Christmas Rally with a correction. We currently see an ongoing Bull Flag formation for as long as the blue zone isn't left. Thickness of arrows marks their likelihood.
In general, the heated rally - which completely opposes last year's development - will call for an ongoing cooldown pretty soon.
Markets might overheat on the following events in Q1 2024:
- End of Ukraine War (short setback in Defense values, but staying high due altering world security situation)
- Mild China recession, return of production and high energy demand
Markets will react to these events in Q3 2024:
U.S. Presidential Election (GOP winning the house will lead to spikes in U.S. market and steep and stern corrections in the EU market, as the Ukraine War would end in Russia's favor and capital would flee the continent. Also Grain prices will spike tremendously, with Ukraine's grain production and export controlled by Russian occupation!)


DAX sell ideaSimilar to NAS100. Downward strength has entered the market. Look for fib retracements and use smart money concepts.

DAX Elliott Wave Analysis for Wednesday 20/12/2023In the higher time frame, it looks like we started a new upward cycle from the October low. This means the wave ((2)) low is in after an expanded flat. The alternative scenario assumes a wave (2) low of a lower degree. In the lower time frame, we are observing ending upward structures.

A powerful impulse with a small correction pattern!Hello!
I am a big fan of the Elliott wave principle, which I find very interesting and useful for market analysis. I have developed my analytical approach by combining this principle with my personal experience and considering various scenarios that could occur in the market.
While I would like to share my analysis with you, please note that I am not providing a buy or sell signal. My primary intention is to share my unbiased analysis so that you can utilize it as a guide to make an informed decision.
To build your confidence in my analysis, I always share my previous analysis from the same market so that you can compare and see the progress. All the details of my analysis are clearly labeled, which should make it easy for you to understand.
I hope that my analysis is useful to you in your business journey, and I wish you all the best.
I am looking forward to hearing from you. Lastly, I would like to mention that like-mindedness and support, comments, and likes are the most important pillars of progress, just like support points in the financial markets. They give me the energy to continue and share more ideas with you.
Sincerely

GER30 H4 | The price is rising toward our buy entry at 16721.96, which is an overlap resistance and could breakout and rise to our take profit at 16955.74, the swing high resistance level.
The stop loss will be placed at 16397.87, which is a pullback support level.
High Risk Investment Warning
Trading Forex/CFDs on margin carries a high level of risk and may not be suitable for all investors. Leverage can work against you.
Stratos Markets Limited (www.fxcm.com):
CFDs are complex instruments and come with a high risk of losing money rapidly due to leverage. 67% of retail investor accounts lose money when trading CFDs with this provider. You should consider whether you understand how CFDs work and whether you can afford to take the high risk of losing your money.
Stratos Europe Ltd, previously FXCM EU Ltd (www.fxcm.com):
CFDs are complex instruments and come with a high risk of losing money rapidly due to leverage. 72% of retail investor accounts lose money when trading CFDs with this provider. You should consider whether you understand how CFDs work and whether you can afford to take the high risk of losing your money.
Stratos Trading Pty. Limited (www.fxcm.com):
Trading FX/CFDs carries significant risks. FXCM AU (AFSL 309763), please read the Financial Services Guide, Product Disclosure Statement, Target Market Determination and Terms of Business at www.fxcm.com
Stratos Global LLC (www.fxcm.com):
Losses can exceed deposits.
Please be advised that the information presented on TradingView is provided to FXCM (‘Company’, ‘we’) by a third-party provider (‘TFA Global Pte Ltd’). Please be reminded that you are solely responsible for the trading decisions on your account. There is a very high degree of risk involved in trading. Any information and/or content is intended entirely for research, educational and informational purposes only and does not constitute investment or consultation advice or investment strategy. The information is not tailored to the investment needs of any specific person and therefore does not involve a consideration of any of the investment objectives, financial situation or needs of any viewer that may receive it. Kindly also note that past performance is not a reliable indicator of future results. Actual results may differ materially from those anticipated in forward-looking or past performance statements. We assume no liability as to the accuracy or completeness of any of the information and/or content provided herein and the Company cannot be held responsible for any omission, mistake nor for any loss or damage including without limitation to any loss of profit which may arise from reliance on any information supplied by TFA Global Pte Ltd.
The speaker(s) is neither an employee, agent nor representative of FXCM and is therefore acting independently. The opinions given are their own, constitute general market commentary, and do not constitute the opinion or advice of FXCM or any form of personal or investment advice. FXCM neither endorses nor guarantees offerings of third party speakers, nor is FXCM responsible for the content, veracity or opinions of third-party speakers, presenters or participants.

Weekly Technical Analysis 18/12/2023Start your week by identifying the key price levels and trends.
The SpreadEx Research team has analysed the most popular markets, including stocks, indices, commodities & forex.
----------------------------------------------------------------------------
Germany 40
The Germany 40 shows a bullish trend, near record highs with a rising VWAP at 16,535.
Current support is found at 15,927, with resistance seen at a higher 17,142.
The RSI is at 72, indicating strong bullish momentum but also in overbought territory.
UK 100
The UK 100 remains in an uptrend, marked by price above its VWAP of 7,533.
Support is established at 7,417, while resistance is anticipated at 7,649.
An RSI of 61 suggests continued bullish sentiment without immediate overbought concerns.
Wall Street
Wall Street's bullish stance is confirmed by price above the VWAP of 36,217.
The index is supported at 34,892, with resistance far above at 37,344.
A high RSI of 87 signals very strong upward momentum, although it suggests the market may be overextended.
Brent Crude Oil
Brent Crude oil exhibits a bearish trend, with price below its VWAP of 72.56.
Support is seen at 77.68, and resistance is at 82.82.
The RSI stands at 45, indicating a bearish but not oversold market condition.
Gold
Gold is on a bullish trajectory, with price above its VWAP calculated at 2,047.
It finds support at 1,985 and may face resistance at 2,109.
The RSI at 52 suggests a neutral to slightly bullish stance with room for upward movement.
EUR/USD
EUR/USD pair shows a bullish trend with price above the VWAP at 1.0869.
The support level is quite near at 1.0708, indicating potential for a strong base, while resistance is at 1.1032.
With an RSI of 55, the currency pair shows moderate bullish momentum.
GBP/USD
The GBP/USD is trending upwards, with price over its VWAP of 1.2629.
The support is set at 1.2500, and resistance is slightly higher at 1.2758.
The RSI is at 57, pointing to bullish momentum without immediate overbought concern.
USD/JPY
USD/JPY is experiencing a bearish trend, well under its VWAP of 145.68.
Support appears firm at 141.20, while resistance is much higher at 150.17.
An RSI of 31 indicates the potential for a bullish reversal as it approaches oversold levels.

DAX bullish trend continuation.Watching the DAX on a lower timeframe channel, which seems to be in consolidation as the downward momentum has slowed down. Looking for signs of accumulation in previous area of demand. Looking for price turn bullish and get a break & close above 16765 on 1H timeframe to hold long position to 17000. Price might shoot past it should it return to that level. Overall market sentiment is risk-on, which is positive for stocks and all round risk assets.

If we have confirmationTargeting 50% is a habit I will always go by and this is because 50% is always hit during wave 2. I would rather hold for something guaranteed instead of the other target.

DAX to breakdown at overbought extremes?GER40 - 24h expiry
Although the bulls are in control, the stalling positive momentum indicates a turnaround is possible.
Current prices have reacted from a low of 16662, however, we expect further losses to follow.
Price action resulted in a new all-time high at 17004.
An Evening Doji Star formation has been posted at the high.
A break of the recent low at 16662 should result in a further move lower.
Daily signals for sentiment are at overbought extremes.
We look to Sell a break of 16658 (stop at 16758)
Our profit targets will be 16418 and 16348
Resistance: 16793 / 16850 / 16950
Support: 16720 / 16662 / 16600
Risk Disclaimer
The trade ideas beyond this page are for informational purposes only and do not constitute investment advice or a solicitation to trade. This information is provided by Signal Centre, a third-party unaffiliated with OANDA, and is intended for general circulation only. OANDA does not guarantee the accuracy of this information and assumes no responsibilities for the information provided by the third party. The information does not take into account the specific investment objectives, financial situation, or particular needs of any particular person. You should take into account your specific investment objectives, financial situation, and particular needs before making a commitment to trade, including seeking advice from an independent financial adviser regarding the suitability of the investment, under a separate engagement, as you deem fit.
You accept that you assume all risks in independently viewing the contents and selecting a chosen strategy.
Where the research is distributed in Singapore to a person who is not an Accredited Investor, Expert Investor or an Institutional Investor, Oanda Asia Pacific Pte Ltd (“OAP“) accepts legal responsibility for the contents of the report to such persons only to the extent required by law. Singapore customers should contact OAP at 6579 8289 for matters arising from, or in connection with, the information/research distributed.

GER40 TRADE BUYING TRADE IDEA GER40 TRADE BUYING TRADE IDEA
The key buying level
Entry Point: 16765.17-16690.17
Stop Loss:16229.17
Take Profit: 17000.17

DAX Short setupDax looks so good for a short. I can clearly see a broke down of a weekly trendline on higher timeframe. On lower timeframe we can also see a break of a short-term trendline, short squeeze and drop. My indicators also shown a good divergence on h4 timeframe, and a drop is gihly expected
✅DAX BULLISH BREAKOUT|LONG🚀
✅DAX is trading in an
Uptrend and the index broke
The key horizontal level
Of 16,500 so I am bullish
Biased now and I think that
We will see a further move up
LONG🚀
✅Like and subscribe to never miss a new idea!✅

DAX Elliott Wave Analysis for Monday 18/12/2023 (+ HTF)In the higher time frame, it looks like we started a new upward cycle from the October low. This means the wave ((2)) low is in after an expanded flat. The alternative scenario assumes a wave (2) low of a lower degree. In the lower time frame, we are observing ending upward structures.

GER30 Buy Idea. Support level hit.
The price failed to break this support level to the downside. Doji candle formed by the support region, however, so I am pretty confident it will retrace upwards in the upcoming week.

DE 18-22 DECDay is still a strong trend for buy where we can look for sell on H4 or H1.
Day >> buy
H4, H1 sell to buy at Day zone

DE40 for 19-2 DEC 23DE40 for 19-2 DEC 23
Day is still a strong bull market where we can see the reversal in smaller time frame such as h1, h4 and m30 where we could find opportunity to sell. Happy trading everyone !!!
M30 H1 H4 > Sell
Day > Buy

DAX: Channel Up keeps it bullish. Strong correction if it breaksDAX is trading inside a Channel Up pattern since October 27th and it has been intact for so long that the 1D timeframe remains overbought (RSI = 78.050, MACD = 373.200, ADX = 82.264). Since it is holding the 4H MA50 over the bottom of the Channel Up, we remain bullish aiming at a +4.66% rise (TP = 17,400), which is the lowest it has registered inside this pattern. If the price crosses under the Channel Up however, we will short aiming near the S1 level (TP = 16,000), which can test the 1D MA50.
## If you like our free content follow our profile to get more daily ideas. ##
## Comments and likes are greatly appreciated. ##

Short Dax
- Bearish engulfing
- Selling climax
- RSI overbought
- MACD about to cross
- Looking for retrace towards 50 day EMA
- 3.44 RR

DAX40Note:
The Market Currently ranging on 1YR TM , Within the TM the are 3 Confirmation Observed:
1.9 Month 1-2 RTM =bullish Trend
2.2Months 1-2 RTM- Bullish Trend
Additionally: Pin Ball buy and ROC new Low =Bullish
3.Daily has First Close below the SMA
-This appears as Flag on 240 and 120 TM.
Entry: Look For 3 pushes on 5,15,30 Minutes Time Frames
This Confirmation are Visible on SP500, US100 and DOW.

ECB stopped the DAX rallyThe German DAX has been riding high (new all time highs) due to the expectations that the ECB (European Central Bank) would be providing some needed rate cuts in the near future to the ailing German economy and the Eurozone. The DAX, as a result, has rallied to all time highs in recent weeks. Following the ECB meeting the DAX is now seeing a technical bearish engulfing candle and looks poised to retest the breakout point at 16570. The ECB meeting was considered a "hawkish hold" as they try to temper expectations of a rate cut near term. In turn, the German DAX may fall as expectations of a rate cut are reduced.
