How China Is Quietly Taking Over Europe’s Industrial FutureThe Lack of Rare Earth Elements Pushes Europe into Major Concessions to China.
Europe’s growing shortage of rare earth elements is forcing it to make unprecedented concessions to China — so deep that analysts now warn the continent could see the collapse of entire industrial sectors within the next five to six years.
Automotive, shipbuilding, aviation, and railway manufacturing are all at risk. To stay afloat, European manufacturers — especially in Germany — are reportedly transferring valuable production know-how and proprietary technologies to Chinese partners in a desperate attempt to survive just a few more months or years.
China, meanwhile, is using this knowledge to strengthen its own technological base. The scenario is alarmingly familiar: just as China mastered and surpassed the West in electric vehicles, it is now poised to outpace Europe across nearly every remaining industrial field.
Investing in major German corporations is rapidly becoming meaningless. These companies will either shut down or be bought out entirely. The battle for industrial dominance has already been decided — China has won against Europe. What remains is the larger confrontation with the United States, a conflict that will likely unfold on Europe’s back, among the ruins of its once world-leading industries.
Trade ideas

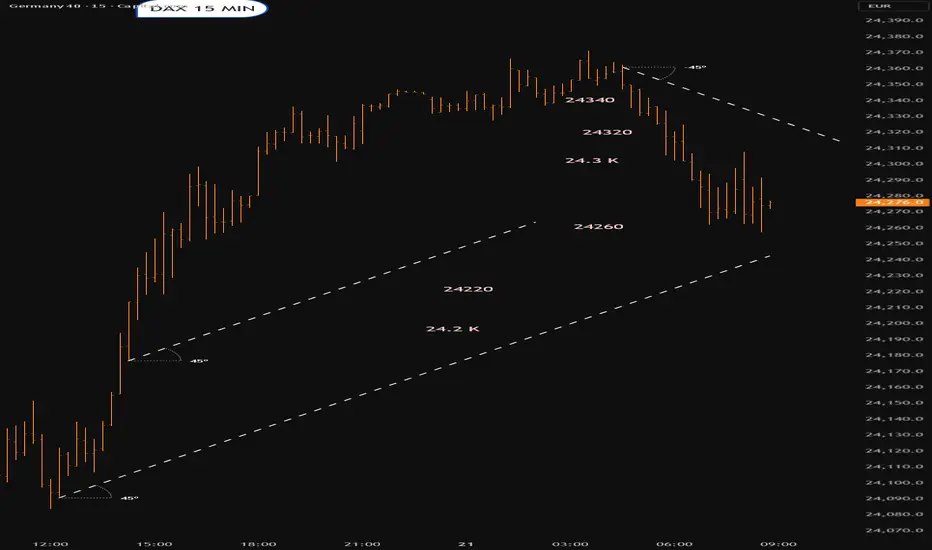
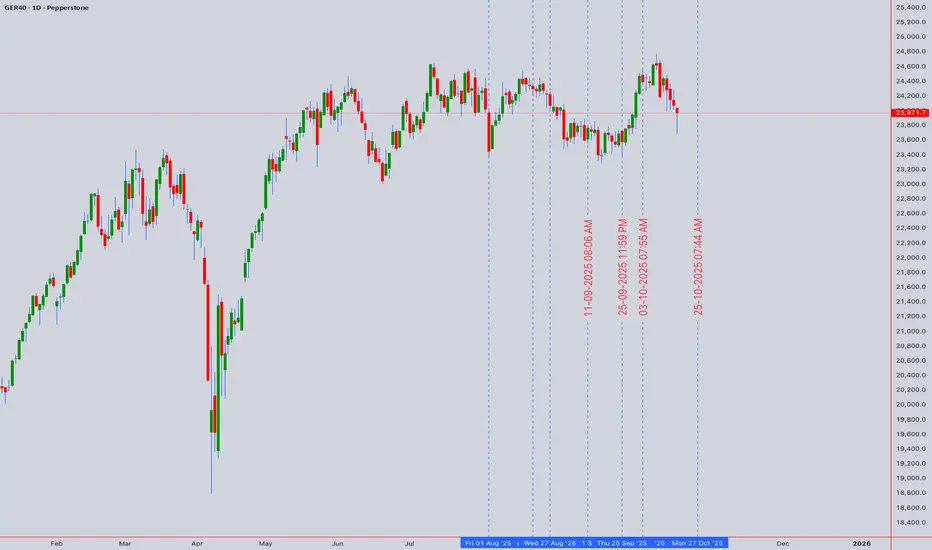
Dax for Thursday October 23rdThe pattern has not got bullish.Plenty of overhead resistance though.Lets see who wins

German DAX Analysis — 22 Oct 2025Bias: Bullish
The bias remains clearly bullish. Last week, price delivered into the discount of the weekly Buyside Imbalance Sellside Inefficiency (BISI/FVG), and since then, the 4H structure has shifted bullish.
For today, price has two possible scenarios:
1️⃣ As we are already trading within a 4H discount FVG, we could see continuation to the upside after a sweep of Asia’s session lows.
2️⃣ Alternatively, price may take a deeper retracement into the Daily FVG formed today before delivering higher.
Either way, maintaining a bullish bias while waiting for confirmation at key levels would be ideal.
This is my personal outlook, not financial advice.

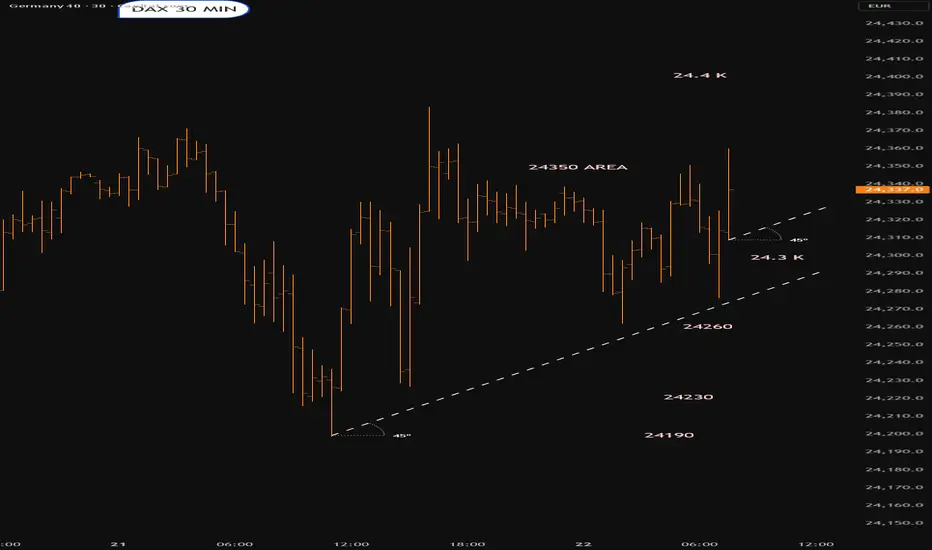
Dax into the open.22nd OctoberThat looks to be the pattern we are trading.Could quite easily pop to 24.5 K
Lets see what happens

Long DaxPossible long entries on the Dax.
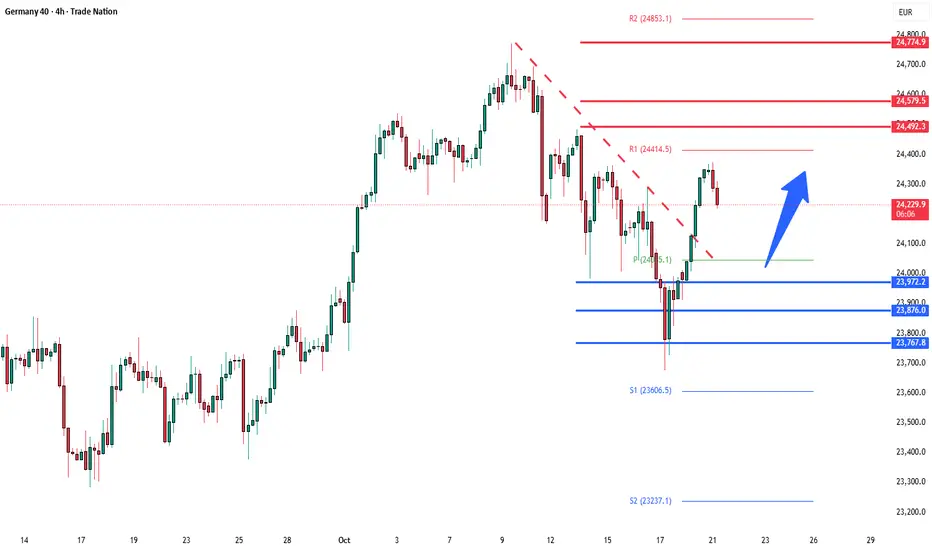
Fundamentals & correlations:
- Positive commentary from Trump surrounding the US China tariff deal has seen a shift in risk sentiment today with precious metals down and equities rebounding
- US earnings have shown positivity this week with banking sector concerns fading
- EUROSTOXX, NL25 and US indices have broken previous bearish structure and are back towards previous highs, paving the way for the Dax
- German GDP did turn lower in Q2 to -0.3% but is forecasted to rebound to 0.1% amid lower interest rates and stable inflation
Technical setup
- Price has broken previous downtrend channel and lower high
- Mondays volume profile printed a POC higher than the previous showing a shift in price acceptance
- Tuesday price opened higher above Monday VA again support the shift in price acceptance
- Price has retraced back to Mondays VAH and low volume cave as support
- Further confirmation could be taken on the break above the current high and retracment back to a fib 50-61.8% level
- If price pulls back further from current level and fib retracement could be taken from 1hr low to provide further support areas
- Eurozone PMI's and US inflation data due to release on Friday so in trade management would be needed ahead of these

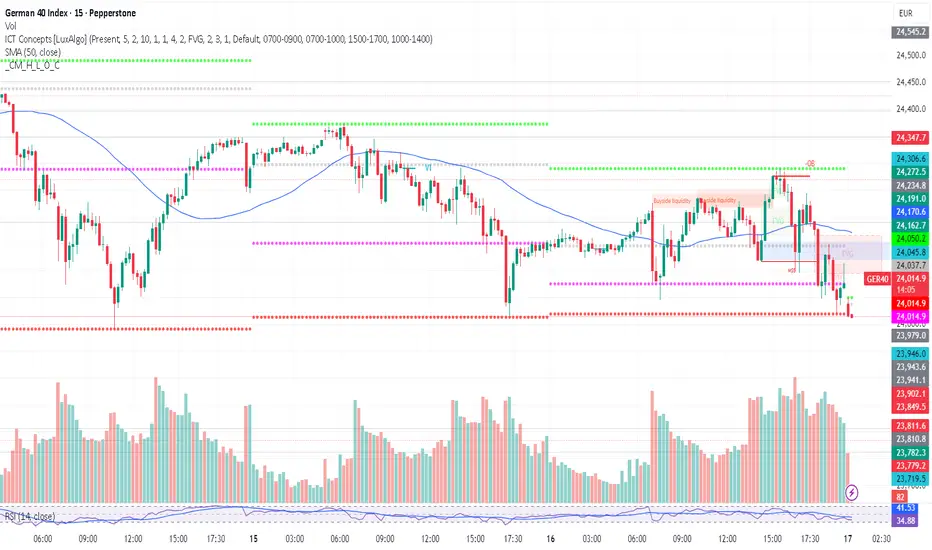
DE40 probability of upward movement I'm waiting for confirmation of the upward movement.
I take into account real volume, FVG, divergence and 1H time frame which working exellent with my divergence indicator.
Will see...
patience pays off !!!

DAX Bullish breakout retest?The DAX remains in a bullish trend, with recent price action indicating a potential overbought pullback within the broader uptrend.
Support Zone: 23970 – a key level from previous consolidation. Price is currently testing or approaching this level.
A bullish rebound from 23970 would confirm ongoing upside momentum, with potential targets at:
24490 – initial resistance
24580 – psychological and structural level
24770 – extended resistance on the longer-term chart
Bearish Scenario:
A confirmed break and daily close below 23970 would weaken the bullish outlook and suggest deeper downside risk toward:
23870 – minor support
23770 – stronger support and potential demand zone
Outlook:
Bullish bias remains intact while the Dax40 holds above 23970. A sustained break below this level could shift momentum to the downside in the short term.
This communication is for informational purposes only and should not be viewed as any form of recommendation as to a particular course of action or as investment advice. It is not intended as an offer or solicitation for the purchase or sale of any financial instrument or as an official confirmation of any transaction. Opinions, estimates and assumptions expressed herein are made as of the date of this communication and are subject to change without notice. This communication has been prepared based upon information, including market prices, data and other information, believed to be reliable; however, Trade Nation does not warrant its completeness or accuracy. All market prices and market data contained in or attached to this communication are indicative and subject to change without notice.
Buy DAX 4H on tradeback in bull movementBuying with the trend below previous low of close. Fundameltally Buying bull move on retracement with Risk Reward 1:4.
will move stop to break even if 100 pts of profit is reached.

GER30 H4 | Potential Bearish Reversal FormingGER30 is reacting off the sell entry at 24,390.79, which is a pullback resistance that aligns with the 61.8% Fibonacci retracement and could drop from this level to the downside.
Stop loss is at 24,760.34, which is a swing high resistance.
Take profit is at 23,846.69, which is an overlap support.
High Risk Investment Warning
Trading Forex/CFDs on margin carries a high level of risk and may not be suitable for all investors. Leverage can work against you.
Stratos Markets Limited (tradu.com ):
CFDs are complex instruments and come with a high risk of losing money rapidly due to leverage. 65% of retail investor accounts lose money when trading CFDs with this provider. You should consider whether you understand how CFDs work and whether you can afford to take the high risk of losing your money.
Stratos Europe Ltd (tradu.com ):
CFDs are complex instruments and come with a high risk of losing money rapidly due to leverage. 66% of retail investor accounts lose money when trading CFDs with this provider. You should consider whether you understand how CFDs work and whether you can afford to take the high risk of losing your money.
Stratos Global LLC (tradu.com ):
Losses can exceed deposits.
Please be advised that the information presented on TradingView is provided to Tradu (‘Company’, ‘we’) by a third-party provider (‘TFA Global Pte Ltd’). Please be reminded that you are solely responsible for the trading decisions on your account. There is a very high degree of risk involved in trading. Any information and/or content is intended entirely for research, educational and informational purposes only and does not constitute investment or consultation advice or investment strategy. The information is not tailored to the investment needs of any specific person and therefore does not involve a consideration of any of the investment objectives, financial situation or needs of any viewer that may receive it. Kindly also note that past performance is not a reliable indicator of future results. Actual results may differ materially from those anticipated in forward-looking or past performance statements. We assume no liability as to the accuracy or completeness of any of the information and/or content provided herein and the Company cannot be held responsible for any omission, mistake nor for any loss or damage including without limitation to any loss of profit which may arise from reliance on any information supplied by TFA Global Pte Ltd.
The speaker(s) is neither an employee, agent nor representative of Tradu and is therefore acting independently. The opinions given are their own, constitute general market commentary, and do not constitute the opinion or advice of Tradu or any form of personal or investment advice. Tradu neither endorses nor guarantees offerings of third-party speakers, nor is Tradu responsible for the content, veracity or opinions of third-party speakers, presenters or participants.

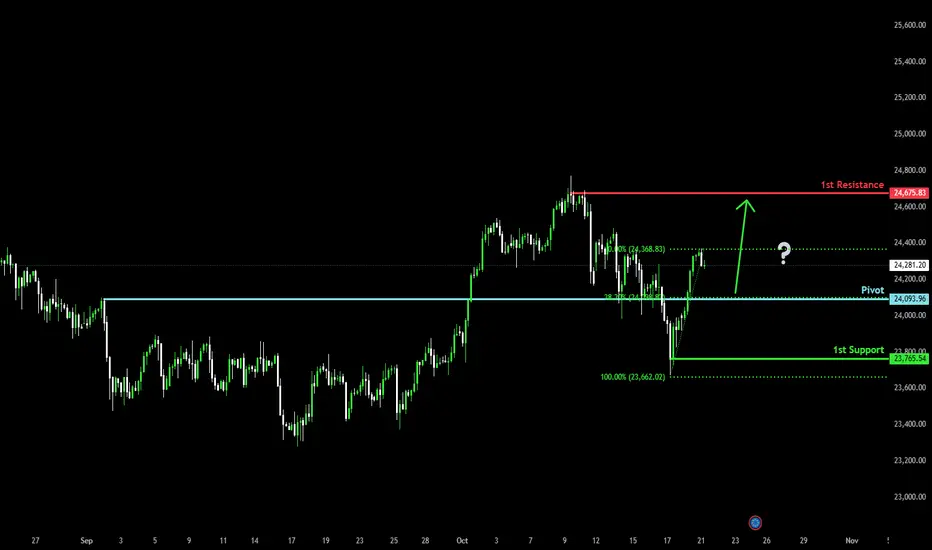
Falling towards 38.2% Fibonacci support?DAX40 (DE40) is falling towards the pivot which is an overlap support that aligns with the 38.2% Fibonacci retracement and could bounce to the swing high resistance.
Pivot: 24,093.96
1st Support: 23,765.54
1st Resistance: 24,675.83
Disclaimer:
The above opinions given constitute general market commentary, and do not constitute the opinion or advice of IC Markets or any form of personal or investment advice.
Any opinions, news, research, analyses, prices, other information, or links to third-party sites contained on this website are provided on an "as-is" basis, are intended only to be informative, is not an advice nor a recommendation, nor research, or a record of our trading prices, or an offer of, or solicitation for a transaction in any financial instrument and thus should not be treated as such. The information provided does not involve any specific investment objectives, financial situation and needs of any specific person who may receive it. Please be aware, that past performance is not a reliable indicator of future performance and/or results. Past Performance or Forward-looking scenarios based upon the reasonable beliefs of the third-party provider are not a guarantee of future performance. Actual results may differ materially from those anticipated in forward-looking or past performance statements. IC Markets makes no representation or warranty and assumes no liability as to the accuracy or completeness of the information provided, nor any loss arising from any investment based on a recommendation, forecast or any information supplied by any third-party.
DAX into the open.Tuesday 21st OctoberThat looks to be the pattern we are trading.Uneless that resitance gets blown out.Lets see what happens
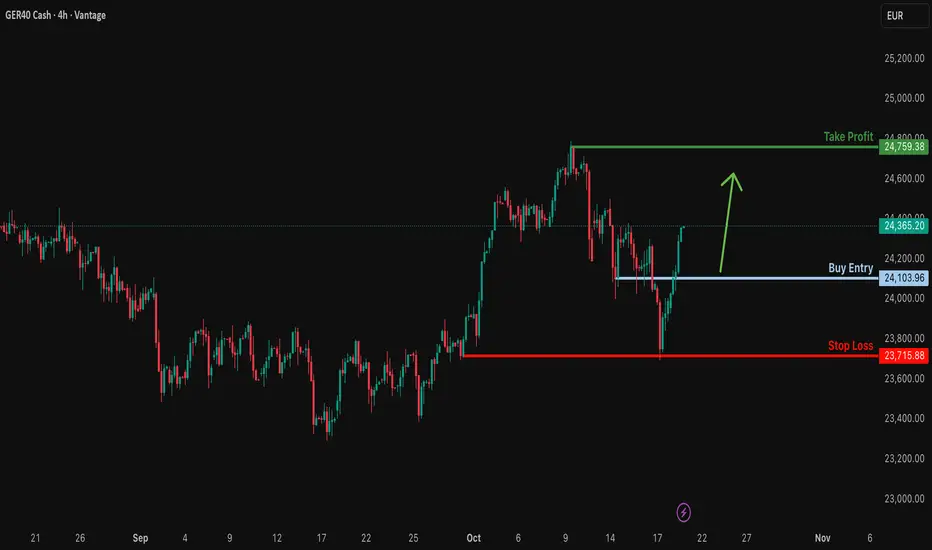
Bullish momentum to extend?GER40 could fall towards the support level which is pullback support and could bounce from this level to our take profit.
Entry: 24,103.96
Why we like it:
There is a pullback support level.
Stop loss: 23,715.88
Why we like it:
There is a pullback support level.
Take profit: 24,759.38
Why we like it:
There is a swing high resistance level
Enjoying your TradingView experience? Review us!
Please be advised that the information presented on TradingView is provided to Vantage (‘Vantage Global Limited’, ‘we’) by a third-party provider (‘Everest Fortune Group’). Please be reminded that you are solely responsible for the trading decisions on your account. There is a very high degree of risk involved in trading. Any information and/or content is intended entirely for research, educational and informational purposes only and does not constitute investment or consultation advice or investment strategy. The information is not tailored to the investment needs of any specific person and therefore does not involve a consideration of any of the investment objectives, financial situation or needs of any viewer that may receive it. Kindly also note that past performance is not a reliable indicator of future results. Actual results may differ materially from those anticipated in forward-looking or past performance statements. We assume no liability as to the accuracy or completeness of any of the information and/or content provided herein and the Company cannot be held responsible for any omission, mistake nor for any loss or damage including without limitation to any loss of profit which may arise from reliance on any information supplied by Everest Fortune Group.
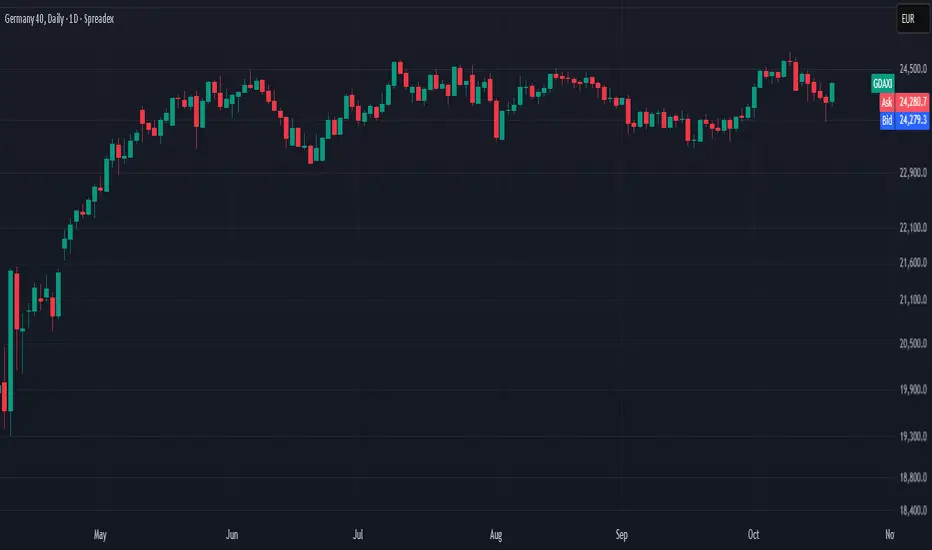
Technical Analysis WeeklyGermany 40 has re-entered its trading range after a failed bullish breakout. Price trades at 24,057, slightly below its VWAP of 24,206. RSI at 48.4 suggests subdued momentum. Support lies at 23,683, while resistance is 24,729.
UK 100 maintains a bullish trend but is undergoing a corrective phase. Price has pulled back to 9,394, below its VWAP of 9,403. The RSI at 51.4 indicates weak bullish momentum. Support is at 9,287, and resistance stands at 9,558.
Wall Street remains in a bullish trend but continues to correct lower, currently at 46,303, on top of its VWAP. RSI at 52.6 shows a neutral stance. Support lies at 45,630, and resistance is estimated at 46,911.
Brent Crude is turning bearish within its broader range. Price has fallen to 6,094, below the VWAP of 6,422. RSI at 30.9 indicates strongly bearish momentum. Support sits at 5,983, while resistance is at 6,860.
Gold extends its bullish run in a strong impulsive phase, trading at 4,259, significantly above the VWAP of 4,015 but down a bit from all time highs. The RSI at 75.5 signals less overbought conditions. Support is way down at 3,677, and resistance is at 4,353.
EUR/USD holds its trading range, now trading at 1.1666, right next to its VWAP. RSI at 49.0 signals neutral momentum. Support is at 1.1556, and resistance is at 1.1782.
GBP/USD stays in a bullish trend but is correcting sideways, trading at 1.3423, slightly above the VWAP of 1.3400. RSI at 49.8 shows consolidation. Support is at 1.3299, with resistance at 1.3514.
USD/JPY is in a pullback following its bullish range-breakout, currently at 150.67, just above its VWAP of 150.30. The RSI at 54.2 reflects moderate bullish momentum. Support lies at 146.60, and resistance is at 154.01.
Buying DAX 4 hr time frame in bullish movement on retracement upwards support line suggests that the bull move in DAX may still be valid. Looking for old highs for a high risk reward trade with the market trend.
DAX Technical Forecast: Bullish Momentum Faces Key ResistanceGER40 (DAX) Technical Forecast: Bullish Momentum Faces Key Resistance
Analysis as of 18th Oct 2025 (Close: 23,971.7)
Market Context: The DAX exhibits robust bullish momentum, but is now testing a critical juncture. A confluence of technical factors on higher timeframes suggests the next move will be decisive for both intraday and swing traders.
Multi-Timeframe Analysis (Top-Down View)
Swing Bias (D1/4H): Bullish Above 23.7k
The daily chart reveals a strong uptrend, with price holding firmly above key moving averages (50 & 200 EMA). However, we are approaching a significant Wyckoffian Supply Zone and a potential Bullish Crab Harmonic pattern completion near the 24,200 - 24,300 resistance cluster. The RSI on the D1 is in bullish territory but not yet overbought, leaving room for further upside.
Intraday Bias (1H/30M): Cautiously Bullish
The 4H and 1H charts show price consolidating in a bullish flag formation. The Ichimoku Cloud on the 1H acts as dynamic support, while the Anchored VWAP from the recent low confirms a strong bullish trend. A break above the 24,050 level could trigger the next leg up.
Key Chart Patterns & Theories in Play
Elliott Wave: We are likely in a Wave 3 extension on the daily chart. A pullback to the 23,700 support would be a healthy Wave 4 before a final Wave 5 push.
Gann Analysis: The Square of 9 highlights 24,200 and 24,450 as potential time/price resistance targets for this swing.
Head and Shoulders? No traditional pattern is present. The primary risk is a Bull Trap if price rejects from the 24.3k resistance without a significant volume breakout.
Actionable Trade Setups
🟢 Swing Trade (Buy the Dip)
Entry: 23,700 - 23,800 (Zone of confluence with 50 EMA & Fibonacci 0.382 retracement)
Stop Loss: 23,500
Take Profit 1: 24,200
Take Profit 2: 24,450
🔴 Intraday Long (Momentum Break)
Trigger: A confirmed break and close above 24,050 on the 1H chart.
Entry: On retest of 24,000 as support.
Stop Loss: 23,900
Take Profit: 24,250
⚫ Intraday Short (Counter-Trend)
Trigger: A clear bearish rejection (e.g., Bearish Engulfing candle) at the 24,200 resistance with RSI divergence.
Entry: Upon rejection signal on the 30M chart.
Stop Loss: 24,350
Take Profit: 23,900
Key Levels
Resistance 3: 24,450 (Gann Target)
Resistance 2: 24,300 (Harmonic Completion)
Resistance 1: 24,050 - 24,100 (Immediate Hurdle)
Support 1: 23,850 (Recent Swing Low)
Support 2: 23,700 (Critical Bullish Defense)
Support 3: 23,500 (Trend Invalidation)
Conclusion
The DAX remains in a firm uptrend. The optimal strategy is to seek long entries on pullbacks towards key support. Be vigilant for a potential reversal at the 24.2k-24.3k resistance zone. Trade what you see, not what you hope.
Risk Warning: Trading carries significant risk. This analysis is for educational purposes and does not constitute financial advice. Always manage your risk and conduct your own due diligence.
GER40, LONG, 17.10.25Reasons for entry:
1. Full fill bullish daily and weekly bullish imbalance.
2. Discount zone.
3. Grab liquidity and inversion bearish imbalance.
4. LRLR liquidity to take profit.
5. Divergence 1h.

DE30 Long Trade - A SetupICMARKETS:DE30 Long Trade
Entry: 23,570 - 23,730
TP-1: 23,945
TP-2: 24,145
This is good trade.
Don't overload your risk like Greedy gambler!!!
Be Disciplined Trader, risk what you can afford.
Use proper risk management.
Disclaimer: Trading is risky, only idea, not advice.

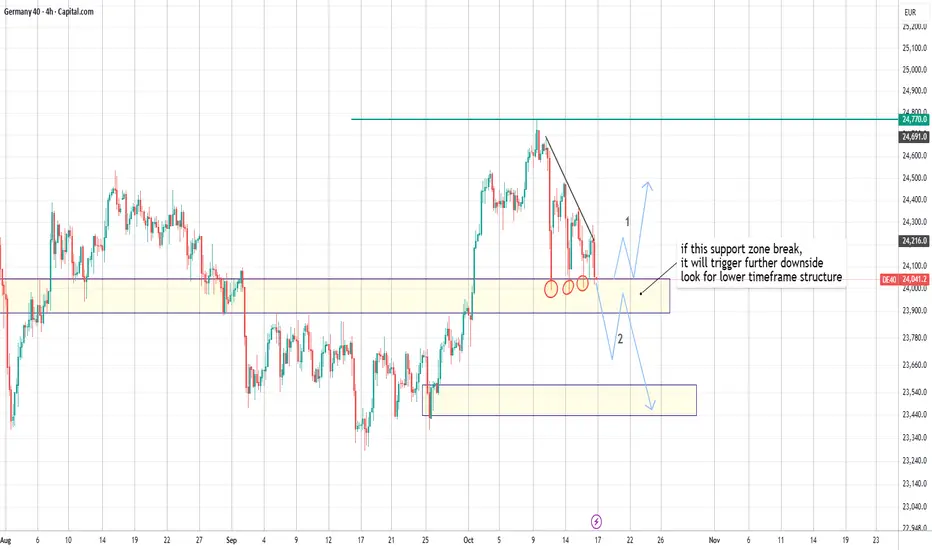
DAX is approaching the decision point 24000 LevelDAX 40 drop from ATH 24770 to recent lowest 24000 and keep above the this support zone for a week. DAX40 is now in a short term downtrend and if it breaks 24000 level. it will break further downside to 23500 level.
if not, It may rebound from 24000 level and continue to break above.
It will be more cautious to look at the lower timeframe change in 24000 level.
Happy Friday!
DAX/GER30 - DOOR OF OPPORTUNITY OPENING Team, I've been lazy the last few days, but I did very well with DAX scalping from 24025 toward 24175 and 24250. I have discussed all the trade in my room discussion.
Let's go LONG at 23996-24025 ranges STOP loss 60 points or 23950
Once it hit 24100 - take partial and bring stop loss to BE
Target 2 at 24175-24250
LETS GO
german 30 sightings lets bet onprice breake neck line then goes up to retest next to the higher high which is higher low thenn price will down

Bearish drop off?DAX40 (DE40) has rejected off the pivot and oculd drop to the 78.6% Fibonacci support.
Pivot: 24,182.71
1st Support: 23,718.92
1st Resistance: 24,455.09
Disclaimer:
The above opinions given constitute general market commentary, and do not constitute the opinion or advice of IC Markets or any form of personal or investment advice.
Any opinions, news, research, analyses, prices, other information, or links to third-party sites contained on this website are provided on an "as-is" basis, are intended only to be informative, is not an advice nor a recommendation, nor research, or a record of our trading prices, or an offer of, or solicitation for a transaction in any financial instrument and thus should not be treated as such. The information provided does not involve any specific investment objectives, financial situation and needs of any specific person who may receive it. Please be aware, that past performance is not a reliable indicator of future performance and/or results. Past Performance or Forward-looking scenarios based upon the reasonable beliefs of the third-party provider are not a guarantee of future performance. Actual results may differ materially from those anticipated in forward-looking or past performance statements. IC Markets makes no representation or warranty and assumes no liability as to the accuracy or completeness of the information provided, nor any loss arising from any investment based on a recommendation, forecast or any information supplied by any third-party.

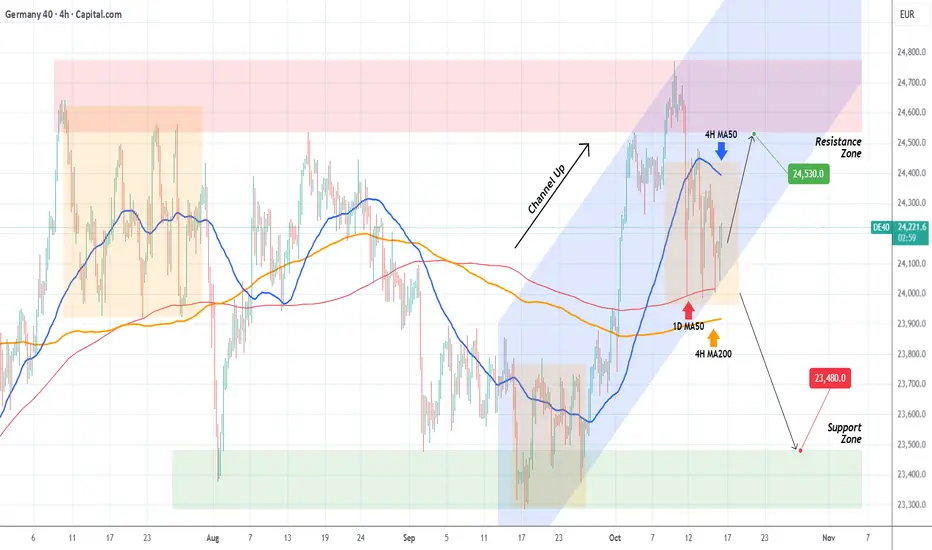
DAX Bullish as long as the 1D MA50 holds.DAX (DE40) has been trading within a 1-month Channel Up and tested today its 1D MA50 (red trend-line) for the 3rd time in the last 6 days.
As long as this holds, we expect a rebound targeting at least the bottom of the Resistance Zone at 24530. A break (and 1D candle close) below the 1D MA50 however, targets at least the top of the Support Zone at 23480.
-------------------------------------------------------------------------------
** Please LIKE 👍, FOLLOW ✅, SHARE 🙌 and COMMENT ✍ if you enjoy this idea! Also share your ideas and charts in the comments section below! This is best way to keep it relevant, support us, keep the content here free and allow the idea to reach as many people as possible. **
-------------------------------------------------------------------------------
💸💸💸💸💸💸
👇 👇 👇 👇 👇 👇