Nasdaq 100 drops to a new low on the weekWhat a sell-off! The Nasdaq 100 (-2%) has now dropped almost 1,000 points from earlier high, to relinquish its entire gains related to Nvidia (-1.6%) and some to hit a new low on the week. How much more selling in there to come? Judging by price action in the crypto space, I would say a fair bit more.
By Fawad Razaqzada, market analyst with FOREX.com
Trade ideas

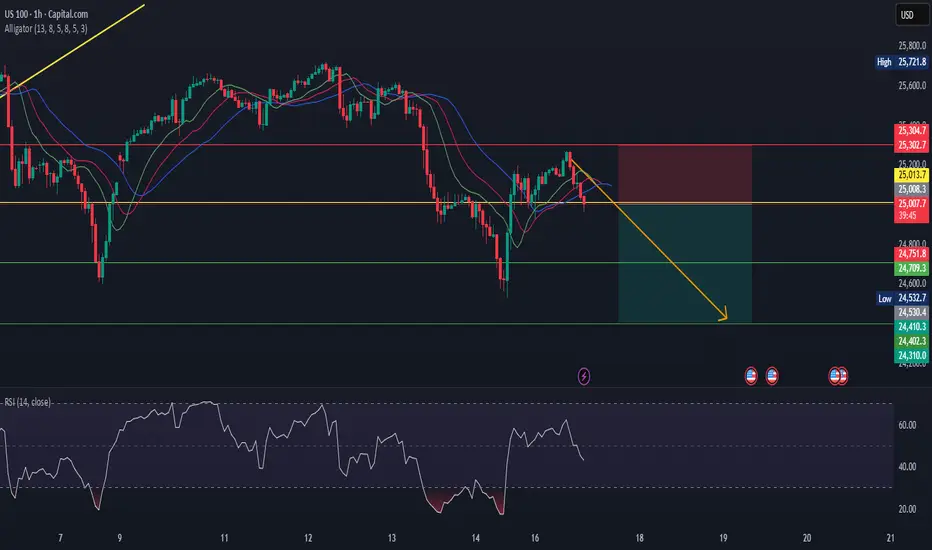
US100US100 is in bearish trend.
No sign of divergence here.
Alligator also indicates price will go down .
We sell at CMP
BULLISH ON NASThe 4HR tf had a break of the low, created a new low with a morning star that gave us a change of character toward the upside and pulled back with 2 bearish rejecting candles and now is starting to push up without a bullish engulfing candle. Details are more visible on the 2Hr tf.

The BreakDown ClubThis is a minimalistic setup that we are seeing for today, an expansion expected. We analyse we wait and see

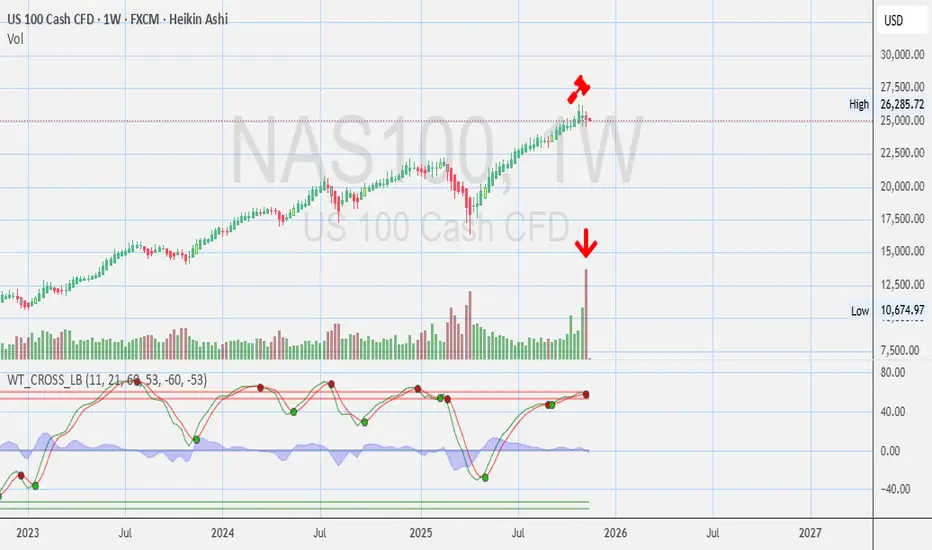
NASDAQ - Weekly Chart Opinions? Game Over ? or 🧠 Keep it on watch. Momentum shifting.
Any Opinions on HUGE VEEKLY VOLUME? Game Over? or?
⚠️ Disclosures :
This analysis is for informational purposes only and is not financial advice. It does not constitute a recommendation to buy, sell, or trade any securities, cryptocurrencies, or stocks. Trading involves significant risk, and you should consult with a qualified financial advisor before making any investment decisions. Past performance is not indicative of future results.
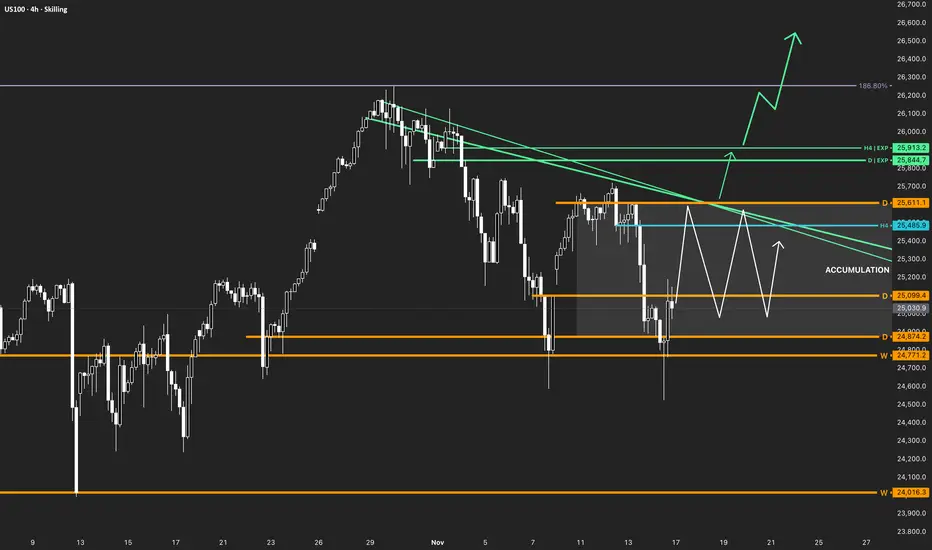
NASDAQ100 (US100) | Accumulation Phase in the Bullish trendHey Traders,
This is a zone where the market usually changes direction a lot, so be careful.
Trend: Primary Bullish
Weekly: 🟢
Daily: 🔴
H4: ⚪️
Phase: Accumulation
Bullish: D Close > 25,611.1 | → 25,844.7 → 25,913.2
Bearish: W Close < 24,016.3
Be Patient!
Peter
NASDAQ NAS100 Under Pressure – Watching for a Break of StructureThe NASDAQ is currently showing signs of weakness on the 4-hour chart. Sellers are gradually stepping in, and we can see US100 bearish momentum starting to take control. The market is under pressure, and price action is hinting at potential continuation to the downside.
I’ll be watching closely for a NAS100 break below the current range low — if price retests that level and fails to reclaim it, that would confirm a bearish market structure shift 🔻. Such a setup could provide a high-probability short opportunity as momentum accelerates to the downside.
⚠️ This is not financial advice — purely for educational and analytical purposes.

NAS100 Bullish Structure Break with Key Fibonacci Level in PlayThe NAS100 is now showing clear signs of strength, with a solid bullish move and a confirmed break of structure on the 4-hour timeframe 🚀. With this shift, the focus turns to how price behaves on the pullback.
The main level of interest is the 61.8% Fibonacci retracement of the current swing. A buy setup becomes valid only if price retraces and holds above the 61.8 level 🔥. Holding above this zone would indicate a shallow pullback — a strong sign that buyers are stepping in aggressively and maintaining control.
If price respects the 61.8 and then breaks structure to the upside again, that’s the confirmation needed to look for long opportunities 📊.
However, if price breaks below the 61.8 level, the idea is invalidated and should be abandoned. A deeper retracement may signal weakness, although it could also be a smart-money liquidity run before a continuation — either way, the priority is to see momentum hold above 61.8 to keep the bullish narrative intact ⚠️.
Not financial advice.

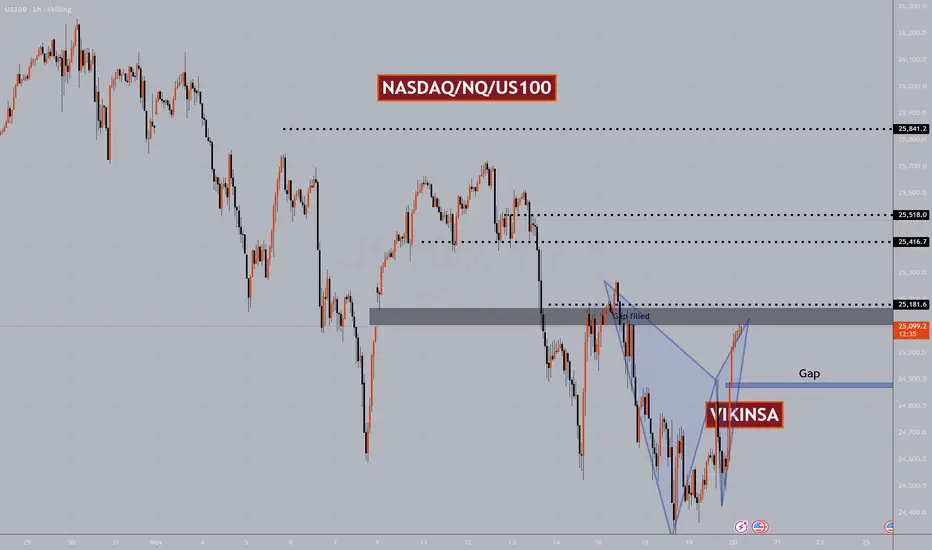
NASDAQ $NQ US100 Major Levels And PatternsNasdaq bounced yesterday heavily and completed a W pattern. I personally have been able to capture majority of this move. You can consider yesterday's W pattern a sort of double bottom which means hat more bullishness is expected in the medium term.
On a short term, now that it has completed a W pattern and reached previous important zone which had a gap, so we can expect a correction here but this may not be a big one. In a rare case there may not be any correction here at all because NASDAQ is forming a pattern which when forms usually ignores all the smaller W and M patterns.
For that reason my Bias is bullish and I will look for buying opportunities mostly.
There are certain Higher time frame levels that I am watching closely which you will find on the chart.
Trade what you see, manage the risk.
Follow for more. Please support this analysis by liking, commenting, and sharing with friends, colleagues, traders, and trading communities. Thanks👍🙂
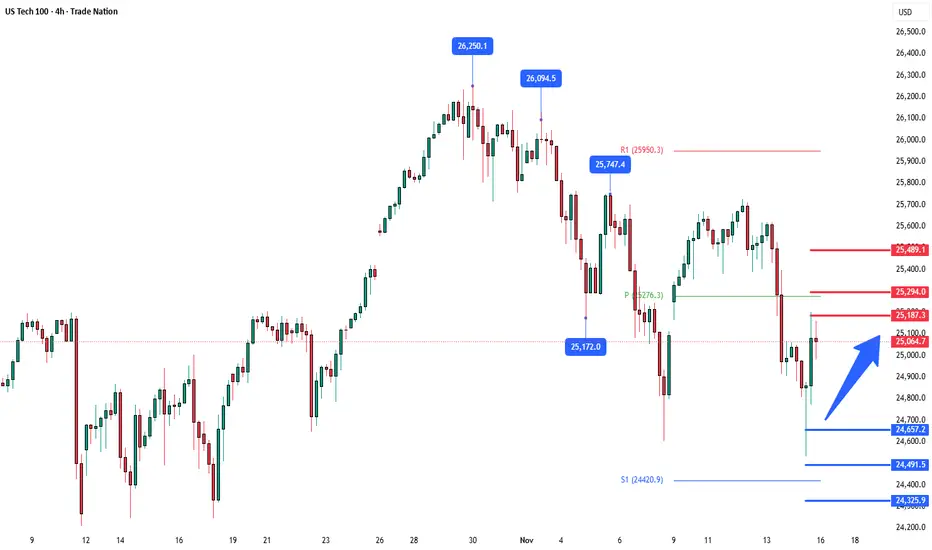
NSDQ100 The Wek Ahead, Key Trading LevelsKey Support and Resistance Levels
Resistance Level 1: 25180
Resistance Level 2: 25300
Resistance Level 3: 25500
Support Level 1: 24655
Support Level 2: 24490
Support Level 3: 24330
This communication is for informational purposes only and should not be viewed as any form of recommendation as to a particular course of action or as investment advice. It is not intended as an offer or solicitation for the purchase or sale of any financial instrument or as an official confirmation of any transaction. Opinions, estimates and assumptions expressed herein are made as of the date of this communication and are subject to change without notice. This communication has been prepared based upon information, including market prices, data and other information, believed to be reliable; however, Trade Nation does not warrant its completeness or accuracy. All market prices and market data contained in or attached to this communication are indicative and subject to change without notice.
Us100 on bullishDouble bottom has confirmed following with shooting star and a bullish engulfer on a h4 timeframe

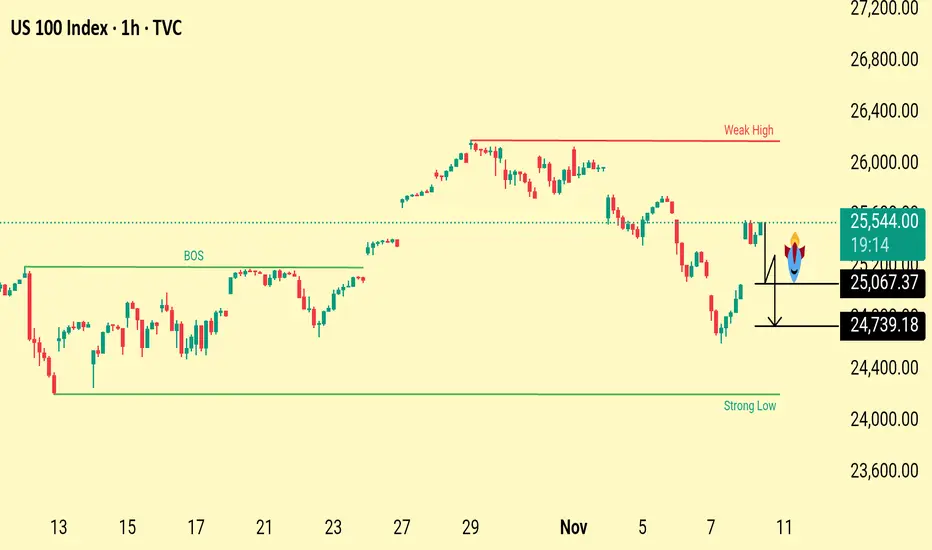
US100 Price Action Outlook Weak High Target&Liquidity SweepZonesThe chart highlights a weak high above current price action, suggesting potential upside liquidity targets. Below, key downside levels at 25,067 and 24,739 mark liquidity pools and possible retracement zones if price rejects current resistance. The structure shows a recent break of structure with both bullish and bearish scenarios in play.
Price is reacting near a resistance area after a recent bounce. The weak high above suggests liquidity may be targeted before any reversal. If price rejects this zone, the next downside levels to watch are 25,067 and 24,739, where liquidity sits and buyers may step in. Structure remains mixed, with both upward liquidity grabs and potential pullbacks likely
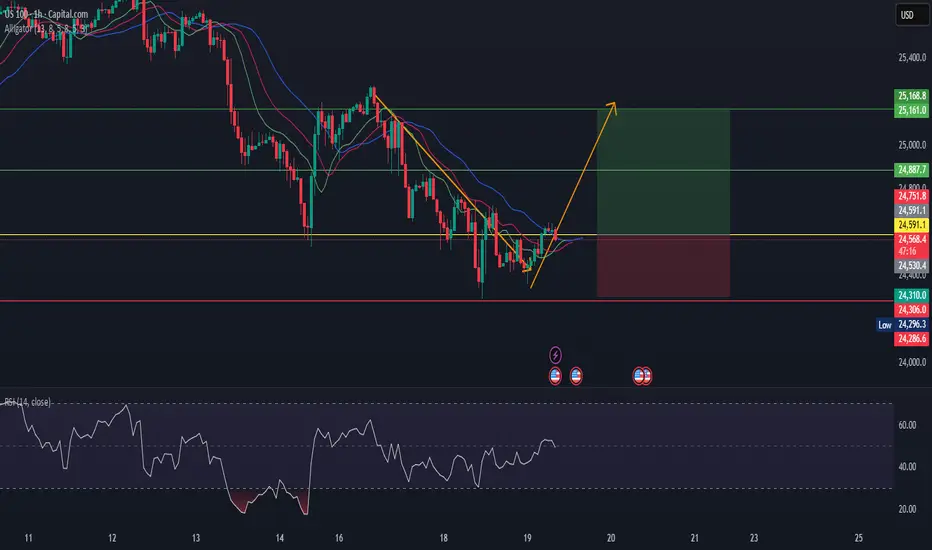
US100US100 is in reversal mode.
As per my analysis.
Alligator direction change to upward.
bullish divergence also made.
See here strong buy indicatin.
Buy at CMP.
US100 - BEARISHEvening all!
Keeping it simple and short, the dollar is undervalued, and everything (indexes, crypto, precious metals) all melting up at the same time - im anticipating an end to 2025 that see's the dollar rise, and the melt up, melt down!
For US 100 - Target/draw on liquidity is the Weekly STL overall.
november 17th trade breakdownhey guys in this video i broke down the strategy i use to trade the markets i hope it brings value to your journey . i also broke down the trade i saw this morning in new York session. keep in a look out for videos this week

US100 | Bullish Reversal From Demand Zone — Targeting 25,200 LiqUS100 has reacted strongly from the 24,400–24,900 major demand zone, showing a sharp rejection and reclaiming structure. Price is now building momentum toward the 25,200 buy-side liquidity level.
A clean consolidation + breakout pattern is forming just below liquidity, indicating potential continuation to the upside.
Market Breakdown:
HTF Bias: Bullish
Demand Zone: 24,400 – 24,900
Intraday Target: 25,201 liquidity zone
Extended Target: 25,722 (major buy-side liquidity)
Confirmation: Break & retest above 25,100
Invalidation: Clean break below 24,950

New Highs Before a Major Correction?The NASDAQ remains firmly within its main ascending trend channel, respecting both the upper and lower boundaries since mid-2023. After a sharp dip triggered by tariff-related headlines, the index quickly recovered, reaffirming bullish momentum and establishing a new support base along the lower trendline.
We’re now approaching the 2nd Fibonacci extension level drawn from the previous major top to the last significant bottom — a key confluence area that historically signals potential exhaustion of the current leg up.
Based on the current price trajectory, this zone could act as a probable top region, marked by the green resistance box on the chart. If the market reacts here, a technical correction or consolidation phase could unfold, retracing back toward the support zone around the mid-channel (highlighted in green).
The “500 Days Rich Man Theory” line (July 2026) may coincide with a macro cycle inflection point, suggesting a timing window for trend reversal or cooling period before the next long-term advance resumes.

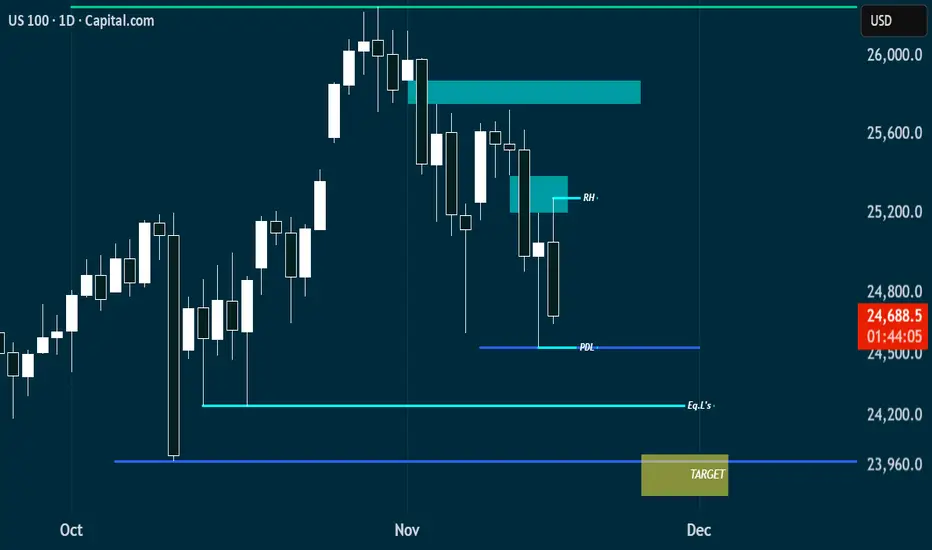
US100 – Consolidation Between FVGs, Watching for Bullish BreakouHello traders,
On the daily timeframe, NASDAQ (US100) is currently consolidating between a bullish and a bearish Fair Value Gap (FVG). Both sides present clear liquidity areas, and the market is preparing for its next directional move.
From my perspective, I’d like to see the price tap into the bullish FVG first, react from that zone, and then invalidate the bearish FVG on its way higher.
If this scenario plays out, the next targets would be the equal highs (EQH) and eventually a new all-time high (ATH).
However, if a daily candle closes below the bullish FVG, this idea becomes invalid and we could expect further downside movement.
For now, I remain bullish while the bullish FVG holds. 📈
💌It is my honor to share your comments with me💌
🔎 DYOR
💡Wait for the update!

Nasdaq 100 Rebounds as Traders Anticipate End of the US ShutdownNasdaq 100 Rebounds as Traders Anticipate End of the US Shutdown
As the chart shows, the Nasdaq 100 index has started the week on a positive note amid growing expectations that the longest government shutdown in US history may soon come to an end.
According to Reuters, a bill has been introduced in the Senate proposing amendments to extend government funding until 30 January. The news acted as a bullish catalyst for equity markets. Still, the question remains – is the risk truly behind us?
Technical Analysis of the Nasdaq 100
Analysing the hourly chart of the Nasdaq 100 on 4 November, we:
→ Drew an ascending channel;
→ Noted signs of momentum exhaustion, as mentioned in our previous headline.
Since then, price action has evolved as follows:
→ The lower boundary of the channel provided support (1), prompting a brief rebound;
→ The 25,770 level acted as resistance (2) on two occasions, strengthening the bears’ confidence to push for a downside breakout — which ultimately succeeded.
The index’s subsequent movements have now more clearly outlined the formation of a descending channel (shown in red).
From the demand-side perspective:
→ After a false bearish breakout below 24,680 (showing characteristics of a Liquidity Grab pattern), the market staged an aggressive rally from point B;
→ Today’s session opened with a bullish gap, and the price has moved above the red median line.
From the supply-side perspective:
→ The 25,500 level, where sellers gained control during the previous channel breakout, may now act as resistance;
→ If the A→B move is viewed as an impulse, today’s rally appears to be a corrective rebound consistent with Fibonacci proportions — suggesting that downward momentum could resume within the red channel.
This article represents the opinion of the Companies operating under the FXOpen brand only. It is not to be construed as an offer, solicitation, or recommendation with respect to products and services provided by the Companies operating under the FXOpen brand, nor is it to be considered financial advice.

NASDAQ Excellent rebound on the 1D MA50. Bullish.Nasdaq (NDX) has been trading within a 6-month Channel Up and last Friday made another 1D MA50 (blue trend-line) test exactly at the bottom (Higher Lows trend-line) of the pattern, and rebounded.
This has market the last two bottoms of the Channel Up and kickstarted the Bullish Legs, which have both been at +9.59%. As you realize, this it technically the pattern's strongest Support and most optimal buy entry for the medium-term.
We expect at least another +9.59% rally on the emerging Bullish Leg, targeting 26950.
-------------------------------------------------------------------------------
** Please LIKE 👍, FOLLOW ✅, SHARE 🙌 and COMMENT ✍ if you enjoy this idea! Also share your ideas and charts in the comments section below! This is best way to keep it relevant, support us, keep the content here free and allow the idea to reach as many people as possible. **
-------------------------------------------------------------------------------
💸💸💸💸💸💸
👇 👇 👇 👇 👇 👇

US100 Free Signal! Buy!
Hello,Traders!
US100 Price has retraced back into a premium supply area after internal liquidity sweep. Smart money is likely to reprice lower, targeting inefficiency and equal lows beneath the recent range.
---------------------
Stop Loss: 25,256$
Take Profit: 24,951$
Entry Level: 25,133$
Time Frame: 3H
---------------------
Sell!
Comment and subscribe to help us grow!
Check out other forecasts below too!
Disclosure: I am part of Trade Nation's Influencer program and receive a monthly fee for using their TradingView charts in my analysis.

Nasdaq Holds Firm After Support Rebound| Focus on 25820 BreakoutUSNAS100 | Overview
The price retested our support at 25430 and bounced perfectly, just as outlined in the previous analysis.
After reaching the resistance zone, the index is now consolidating between 25700 and 25820, awaiting a decisive breakout.
A 1H close above 25820 would confirm bullish continuation, targeting 25960 and 26170.
However, a 4H close below 25700 would indicate the start of a bearish correction, with downside potential toward 25570 and 25430.
Pivot Line: 25700
Resistance: 25820 · 25960 · 26170
Support: 25570 · 25430 · 25230
Outlook:
USNAS100 remains bullish while above 25700, with upside targets at 25960–26170.
A confirmed 4H close below 25700 would shift the short-term tone to a bearish correction toward 25570–25430.

Nasdaq Diverges From Dow Gains — Will It Follow?From a daily perspective, the Nasdaq is testing the upper bound of a parallel channel that has been respected since the August 2025. Price action previously broke to the mid-zone of the duplicated channel near 26,300, declined to the lower border of the original pattern near 24,650, and has since rebounded toward the upper edge around 25,700.
The scenarios from here are as follows:
• Bullish case: A confirmed hold above 25,700 could redirect gains toward 26,300, after which another bullish projection targets the upper boundary of the duplicated channel near 26,800–27,000.
• Bearish case: A drop back below 25,200 could pull prices toward 24,650, with further downside potential extending below the August–November support zone toward 23,900, 23,500, and, in extreme cases, 22,700.
As the longest U.S. government shutdown in history comes to an end, the Dow has extended its gains toward new records near 48,500, while the Nasdaq and S&P 500 remain in a neutral hold, raising questions about the sustainability of further highs in 2025.
Written by Razan Hilal, CMT
