US30 trade ideas

DOW JONES INDEX (US30): To the New Highs
Dow updated the all time high again yesterday.
A broken structure and a solid rising trend line will compose
a significant contracting demand zone from where I will look for buying.
The next resistance will be 46350.
Wait for a retracement first, and anticipate more growth then.
❤️Please, support my work with like, thank you!❤️
I am part of Trade Nation's Influencer program and receive a monthly fee for using their TradingView charts in my analysis.

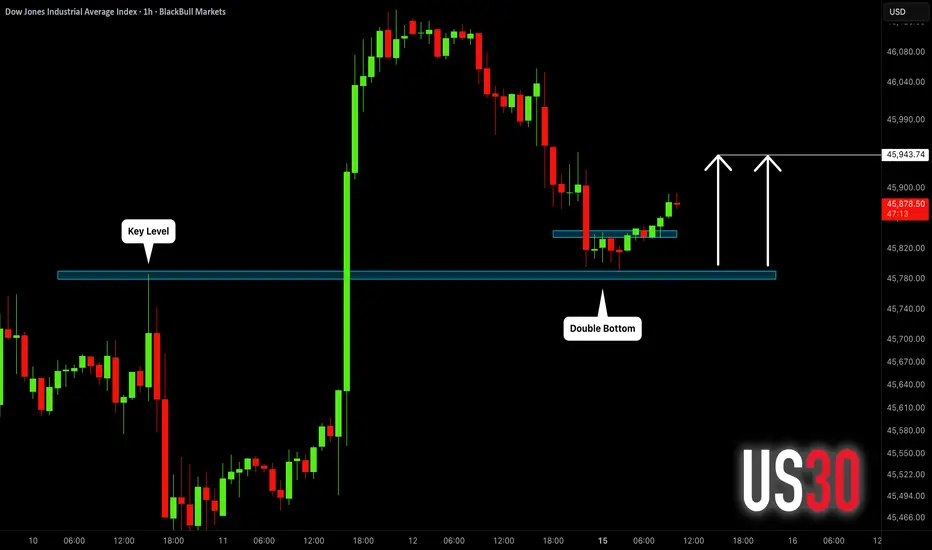
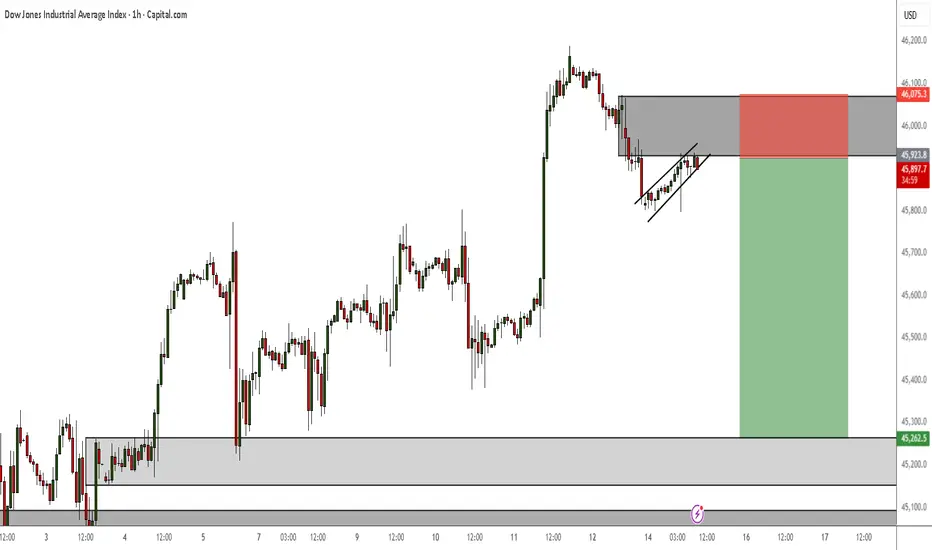
DOW JONES (US30): Pullback From Support Confirmed
Following our Friday's analysis, US30 retested a recently broken
major daily demand zone.
Testing the underlined horizontal key level, the price formed a tiny double bottom.
Its neckline breakout indicates a highly probably pullback.
Goal - 45940
❤️Please, support my work with like, thank you!❤️
I am part of Trade Nation's Influencer program and receive a monthly fee for using their TradingView charts in my analysis.

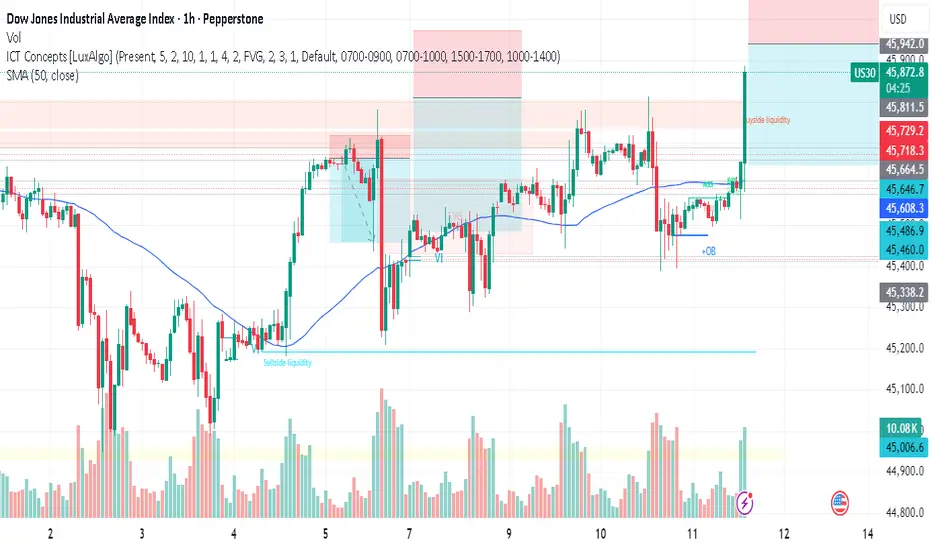
Dow at record highs, outperfoms peers! But are risks brewing?The Dow Jones DJIA surged to new record highs, driven by defensive sector strength and expectations of Fed rate cuts. Dow outperformed due to its heavier weighting in defensive sectors (industrials, financials, consumer staples), which are favoured during economic uncertainty and falling yields. Technical analysis suggests further upside potential, as investors seek stability and dividends in Dow components amid lingering recession risks. However, key support levels must hold to sustain the rally.
The Dow has completed a V-shaped recovery, breaking above previous double-top highs from 2024/2025 (45,150), now acting as support. An open triangle pattern was identified, with the current move likely the fifth wave to the upside. The index trades above all major moving averages, confirming bullish momentum, but RSI shows hidden bullish divergence, supporting the case for continued upside only if support holds after a pullback.
Dow has critical support at 45k, must hold to maintain bullish momentum. A drop below 45,581 could trigger a correction. Short-term upside shows 47k, with a major Fibonacci cluster and technical inflexion in focus. Intermediate levels sit at 46300/45900/45640, with important long-term Targets at 45k, 49500, 50k, 53k.
Risks & Potential Scenarios
Divergence: Despite strong momentum, technical divergence suggests a possible corrective move if the Dow falls below 45581.
Bullish : Holding above 45581 and 45k supports further upside toward 47k and beyond.
Bearish : A break below 45581 could trigger a deeper pullback before any renewed rally.
Market Sentiment :
The bond market’s caution contrasts with stock market optimism, so stay vigilant.
This content is not directed to residents of the EU or UK. Any opinions, news, research, analyses, prices or other information contained on this website is provided as general market commentary and does not constitute investment advice. ThinkMarkets will not accept liability for any loss or damage including, without limitation, to any loss of profit which may arise directly or indirectly from use of or reliance on such information.

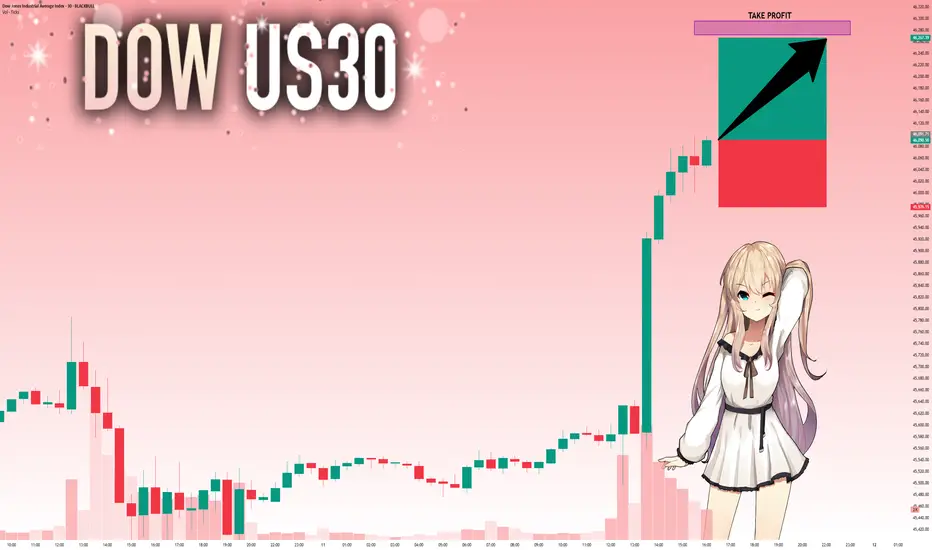
US30: Will Go Up! Long!
My dear friends,
Today we will analyse US30 together☺️
The recent price action suggests a shift in mid-term momentum. A break above the current local range around 46,091.71 will confirm the new direction upwards with the target being the next key level of 46,272.39 and a reconvened placement of a stop-loss beyond the range.
❤️Sending you lots of Love and Hugs❤️

US30, Selling pressurePotential market reversal on US30. H1 showing sell opportunities for Intraday Trading despite bullish market trend on H4 and long term.

US30 | Bearish IndicationsUS30 has formed falling wedge pattern alongwith double top as well as bearish divergence on RSI.These are all very strong indications of bearish reversal.

DOW JONES close to a Triangle break-out leading to 47500!Dow Jones (DJI) has been trading within a Channel Up pattern since April 24. Following the August 21 Low, it entered a short-term Ascending Triangle pattern, looking identical to May - June, which also started after a 4H MA50 (blue trend-line) test.
That pattern was a re-Accumulation phase, which after breaking upwards pushed the price just below its 2.5 Fibonacci extension.
With also similar 4H RSI sequences, we expect a similar reaction upon a Triangle break-out, targeting 47500 (Fib 2.5 extension).
-------------------------------------------------------------------------------
** Please LIKE 👍, FOLLOW ✅, SHARE 🙌 and COMMENT ✍ if you enjoy this idea! Also share your ideas and charts in the comments section below! This is best way to keep it relevant, support us, keep the content here free and allow the idea to reach as many people as possible. **
-------------------------------------------------------------------------------
💸💸💸💸💸💸
👇 👇 👇 👇 👇 👇

DXY about to break down and send NAS and Gold higher?Full Analysis of DXY, XAG, XAU, WTI, NAS, S&P and DJ30. I go through my whole analysis for the day and week on the daily and the 1h timeframe applying my mutitimeframe approach and Stacey Burkes teachings to my whole basket.

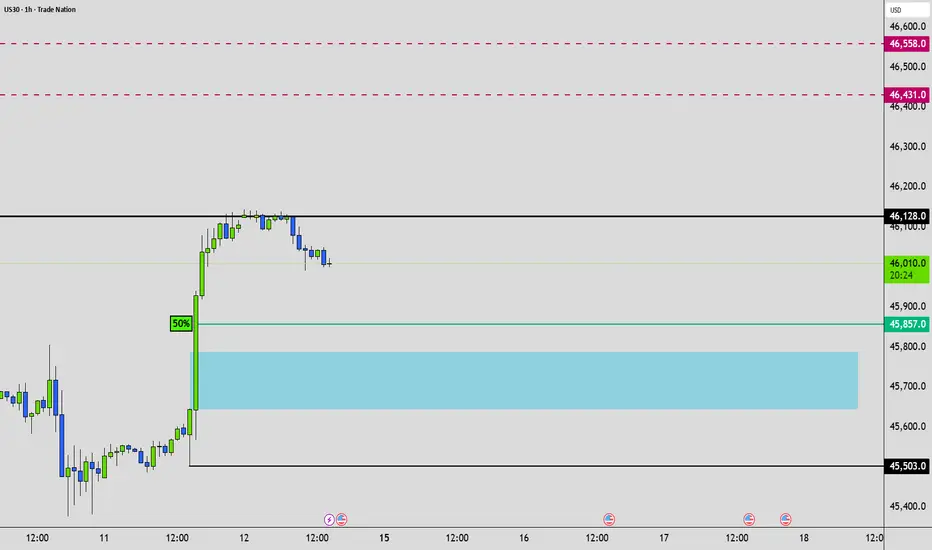
US30 - Key Levels To WatchDear Friends in Trading,
How I see it - 1h TF
After such a big break-out, I can only identify areas of interest FYI
Check your 1D TF + FIB for better perspective.
Let me know if anything is unclear.
I sincerely hope my point of view offers a valued insight.
Thank you for taking the time study my analysis.
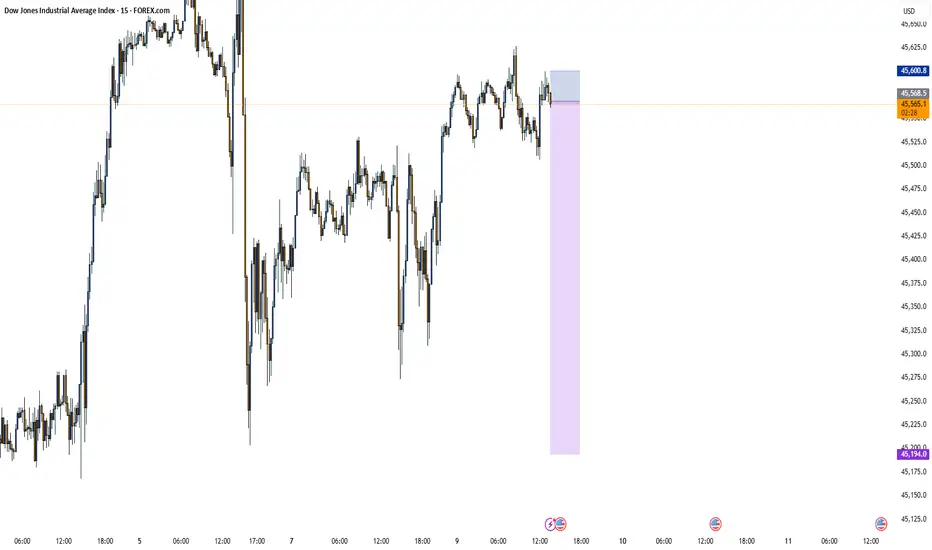
US30 Strategy: Sideways Range, Liquidity Run, and Entry Zones📊 Dow Jones (US30) Update 📊
The Dow Jones (US30) is currently bullish 🟢📈 and pushing higher on the 4H timeframe ⏰. We can see a value area forming 🏦, with price ranging sideways 🔄 and building liquidity above and below the range 💧.
My plan is to watch for a potential liquidity run above the range 🚀, followed by a deep pullback 🔽 that could present a high-probability entry opportunity 🎯.
⚠️ This outlook is for educational purposes only and not financial advice. 📚

DOW JONES HIGH PROBABILITY SETUPS SOON!!!🚨 US30 HIGH PROBABILITY SETUPS 🚨
* Here We Can See Clearly The Next Potential Moves For US30 Coming Hours/Days.
* Keep Your Eyes Close On Your Trading Positions.
* Happy PIP Hunting Traders.
FXKILLA.

Dow Jones is in a Bearish CorrectionThe downside correction for US30 will also continue as DXY pushes up this week.
Currently on M15 TF I am seeing a bearish correction pattern for shorting.
DOW30/US30 ANOTHER OPPORTUNITY TO SHORTTeam, I been waiting for this price 45880 AND 45915
STOP LOSS AT 46050
TARGET 1 AT 45735-65 - take partial 70% bring stop loss to BE
TARGET 2 AT 45575-45615
LETS GO
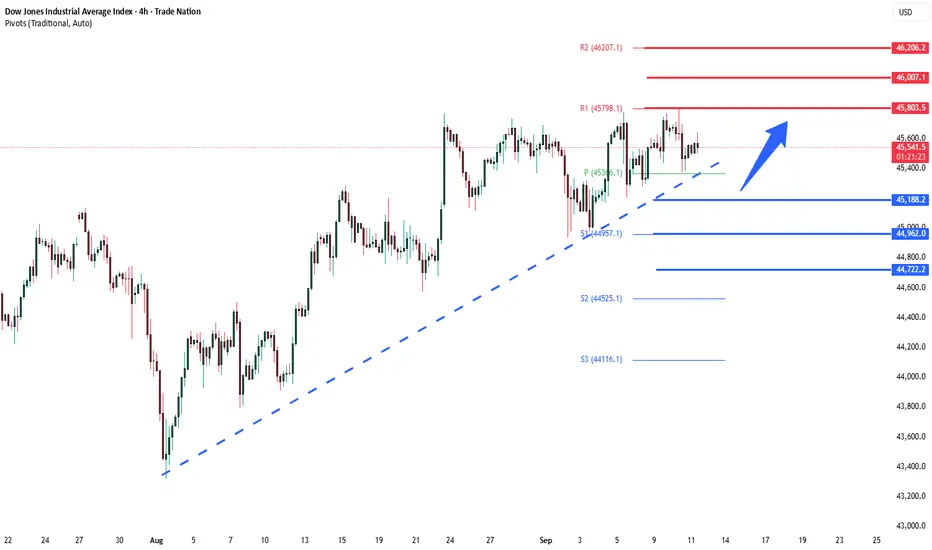
DowJones consolidation after US CPI data Key Support and Resistance Levels
Resistance Level 1: 45800
Resistance Level 2: 46000
Resistance Level 3: 46200
Support Level 1: 45190
Support Level 2: 44960
Support Level 3: 44720
This communication is for informational purposes only and should not be viewed as any form of recommendation as to a particular course of action or as investment advice. It is not intended as an offer or solicitation for the purchase or sale of any financial instrument or as an official confirmation of any transaction. Opinions, estimates and assumptions expressed herein are made as of the date of this communication and are subject to change without notice. This communication has been prepared based upon information, including market prices, data and other information, believed to be reliable; however, Trade Nation does not warrant its completeness or accuracy. All market prices and market data contained in or attached to this communication are indicative and subject to change without notice.
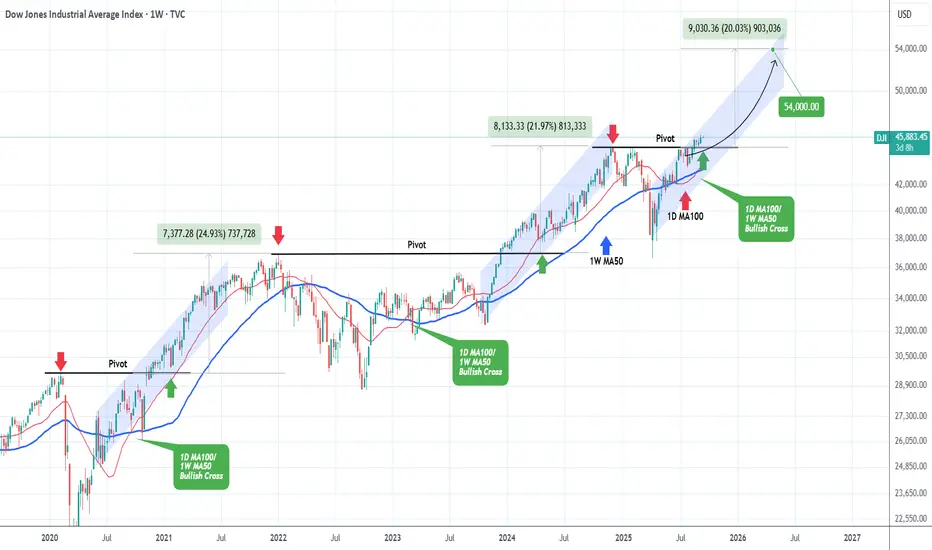
DOW JONES The Cyclical Pivot that MUST hold.Last week (Sep 03, see chart below) we gave a buy signal on Dow Jones (DJI) right at the bottom of its medium-term Channel Up, which quickly hit our 46100 Target:
This time we switch to a much wider and longer term outlook on the 1W time-frame as we are just a day before the Fed Rate Decision. The index has been trading within a strong Channel Up ever since the April 07 2025 market bottom, product of the Trade War correction early in 2024.
The 1D MA100 (red trend-line) crossed above the 1W MA50 (blue trend-line) forming a peculiar Bullish Cross, which interestingly enough, it is the 3rd time we see it since September 2020.
As a result, it is highly critical and as you can see, after such cross, the 1W MA50 has historically led the index higher.
What is perhaps even more critical however is the Pivot trend-line, which is essentially the former All Time High (ATH) turned into Support for the Channel Up pattern that have pushed the market higher since 2020.
As you can see, that level always held and the two rallies that we've had on the pattern like the current one, completed +25% and +22% rallies above it before an eventually correction that broke below the 1W MA50.
As a result, we could see another +20% rise at least, translating into a 54000 long-term Target, as long as both the 1W MA50 and the Pivot hold.
-------------------------------------------------------------------------------
** Please LIKE 👍, FOLLOW ✅, SHARE 🙌 and COMMENT ✍ if you enjoy this idea! Also share your ideas and charts in the comments section below! This is best way to keep it relevant, support us, keep the content here free and allow the idea to reach as many people as possible. **
-------------------------------------------------------------------------------
💸💸💸💸💸💸
👇 👇 👇 👇 👇 👇
US30 Resistance Ahead!
HI,Traders !
#US30 keeps growing
In an uptrend but the
Index will soon hit the
Horizontal resistance
Of 45700.0 from where
We will be expecting a
Local bearish correction !
Comment and subscribe to help us grow !

DowJones Resistance retest at 45800Key Support and Resistance Levels
Resistance Level 1: 45800
Resistance Level 2: 46000
Resistance Level 3: 46200
Support Level 1: 45190
Support Level 2: 44960
Support Level 3: 44720
This communication is for informational purposes only and should not be viewed as any form of recommendation as to a particular course of action or as investment advice. It is not intended as an offer or solicitation for the purchase or sale of any financial instrument or as an official confirmation of any transaction. Opinions, estimates and assumptions expressed herein are made as of the date of this communication and are subject to change without notice. This communication has been prepared based upon information, including market prices, data and other information, believed to be reliable; however, Trade Nation does not warrant its completeness or accuracy. All market prices and market data contained in or attached to this communication are indicative and subject to change without notice.

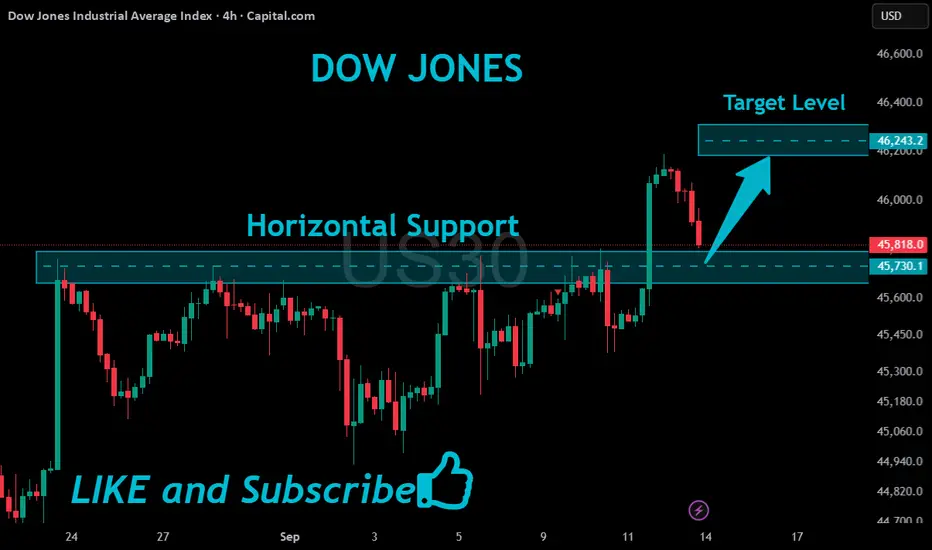
US30 In Support Below!
HI,Traders !
#US30 is trading in an
Uptrend and is
Now making a local bearish
Correction to retest the
Horizontal support below
Around 45730.1 from where
We will be expecting a
Further bullish move up !
Comment and subscribe to help us grow !
Dow Jones Consolidates After ATH – Watch 46,125 for BreakoutUS30 – Overview
The Dow Jones recorded a new ATH near 46,125 and is now testing key support/resistance levels.
📉 Bearish scenario: While trading below 46,125, price may revisit the pivot zone and, if broken, could drop toward 46,000. A confirmed break below 46,000 would extend downside targets to 45,680 → 45,450.
📈 Bullish scenario: A 1H close above 46,125 would invalidate the short-term bearish bias and open the way toward 46,250.
Key Levels
Pivot: 46,000
Resistance: 46,125 – 46,250
Support: 45,800 – 45,680 – 45,450
Bias: Bearish while below 46,125 and 46,000; bullish breakout confirmed on a 1H close above this level.
