DOW JONES HIGH PROBABILITY SETUP SOON!!!🚨 US30 HIGH PROBABILITY SELL/BUY SETUP 🚨
* Here We Can See Clearly The Next Potential Moves For US30 Coming Hours/Days.
* Keep Your Eyes Close On Your Trading Positions.
* Happy PIP Hunting Traders.
FXKILLA.
US30 trade ideas
Dow Jones buy to 46000Fundamentals
- Fed rate cut this September and November, supporting equities growth. Lower interest rates means lower borrowing cost.
- Bond yields down due to government debt to high. Lower yields reduce the discount rate on future earnings, make stocks more attractive than bonds
- Tech giants Google and Apple lifting the indexes performance recently
Technical (Price Action)
- Support level at 44809.3 refined to 44748.9 30 min support

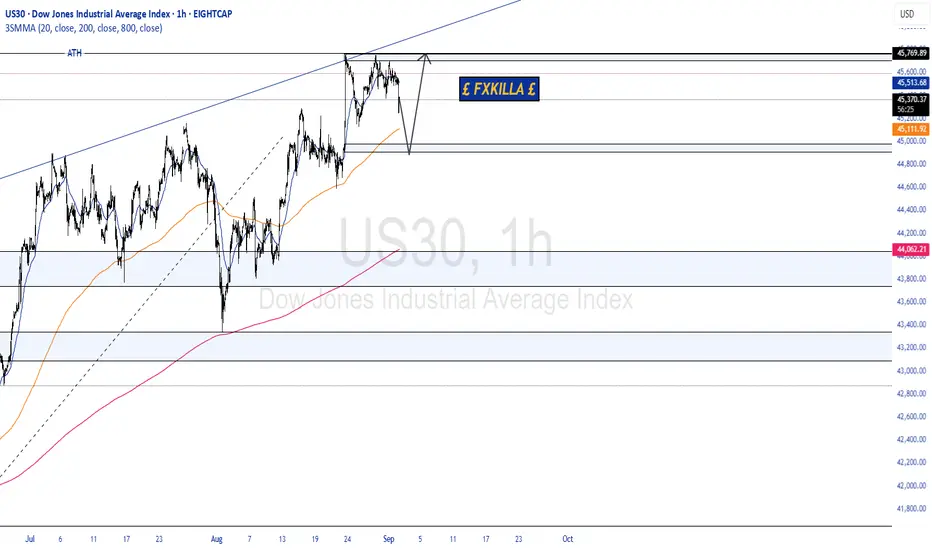
DOW JONES HIGH PROBABILITY SETUPS SOON!!🚨 US30 HIGH PROBABILITY SELL/BUY SETUPS 🚨
*Here We Can See Clearly The Next Potential Moves For US30 Coming Hours/Days.
* Keep Your Eyes Close On Your Trading Positions.
* Happy PIP Hunting Traders.
£ FXKILLA £
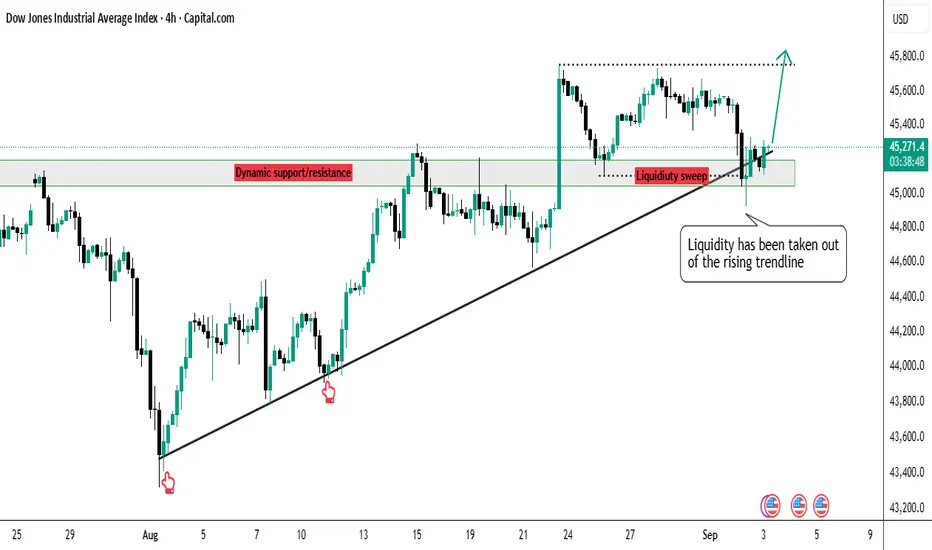
Possible buy opportunity on US30- after confirmation!Hello Traders,
I’m currently watching US30 for a potential long setup.
Price has tapped into a key dynamic level that has previously acted as both support and resistance. This zone also aligns with a rising trendline, where we just saw liquidity taken out below it, followed by multiple candle rejections.
This confluence makes me believe buyers could step in here. My confirmation trigger will be a close above 45,314, if that happens, I’ll be looking to enter long.
🎯 Target: 45,811.83 (previous high)
🛡️ Stop: 45,067
⚖️ Risk-to-Reward: 1:2
I see good potential for upside from this level.
👉 What are your thoughts on this setup? Drop your insights in the comments and if you find this analysis valuable, a like would be greatly appreciated!
US30 Resistance Ahead!
HI,Traders !
#US30 keeps growing
In an uptrend but the
Index will soon hit the
Horizontal resistance
Of 45700.0 from where
We will be expecting a
Local bearish correction !
Comment and subscribe to help us grow !

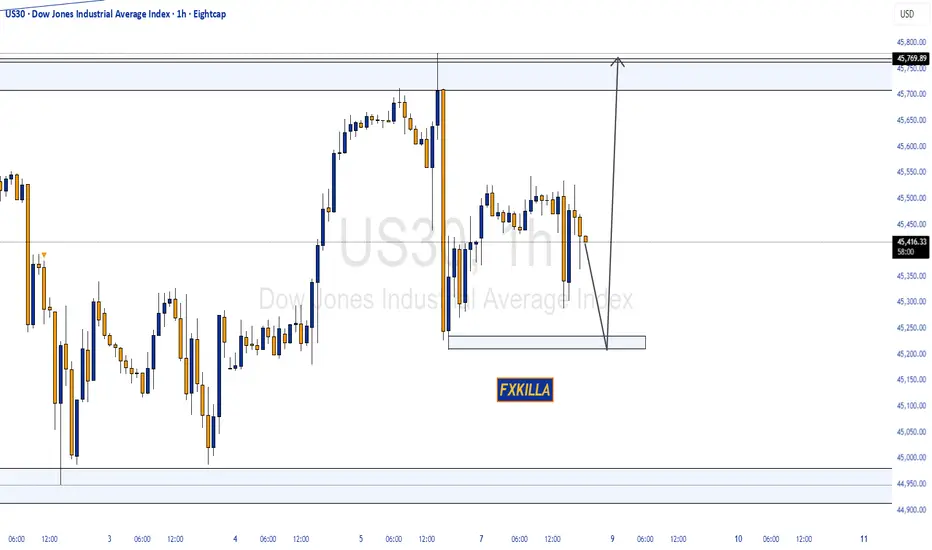
US30 Strategy: Sideways Range, Liquidity Run, and Entry Zones📊 Dow Jones (US30) Update 📊
The Dow Jones (US30) is currently bullish 🟢📈 and pushing higher on the 4H timeframe ⏰. We can see a value area forming 🏦, with price ranging sideways 🔄 and building liquidity above and below the range 💧.
My plan is to watch for a potential liquidity run above the range 🚀, followed by a deep pullback 🔽 that could present a high-probability entry opportunity 🎯.
⚠️ This outlook is for educational purposes only and not financial advice. 📚

US30 ShortElite Analysis
All confirmations have been confirmed
It's time for patience, let price come to you.
5m TOB confirmed, this is where we will execute from.
Targeting lower liquidity pools
Main target weekly structured liquidity
Note:
(Extra: Equilibrium at 1h FVG confirmed)

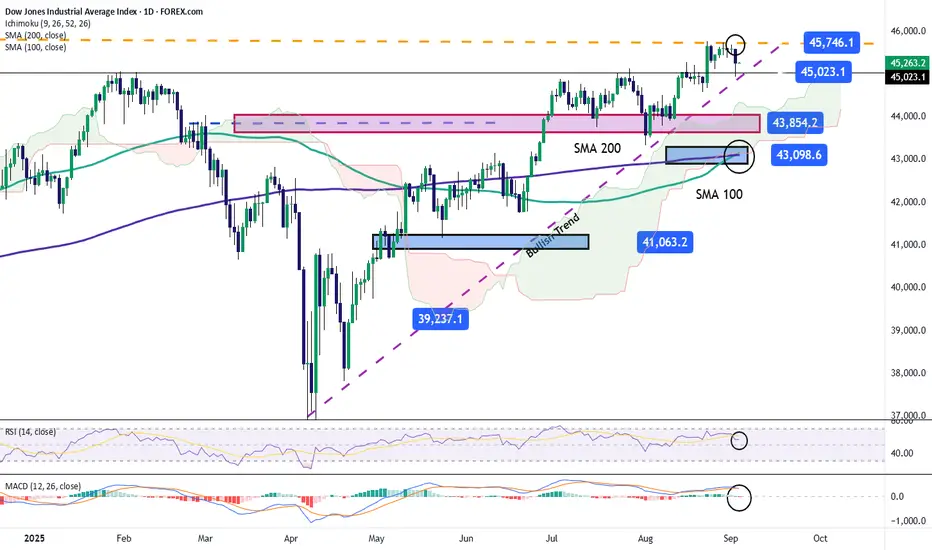
Dow Jones Falls from Record HighsOver the past two trading sessions, the Dow Jones index has declined by just over 0.7%, with selling pressure remaining constant. This move has been tied to the rebound in U.S. 10-year Treasury yields, which climbed to 4.27%, reducing the short-term appeal of equities. In addition, investors are awaiting the release of U.S. employment data at the end of the week, as the results could influence the Federal Reserve’s upcoming policy decisions.
Uptrend Remains Intact
Despite the recent pullback, the short-term declines have not been strong enough to break the uptrend that has remained in place for the past several months. This technical structure continues to be the most relevant in the short term. Unless selling pressure consolidates over more sessions, the upward trend is likely to remain dominant in the coming days.
Technical Indicators
RSI: although the RSI remains above the 50 level, it has begun to show a downward slope in the short term, which could indicate a shift in market momentum. If the line continues to decline, selling pressure could become more relevant in the sessions ahead.
MACD: the MACD histogram continues to hover around the 0 line, indicating that the average strength of the moving averages remains in neutral territory. This highlights the lack of clear direction in the short term.
Key Levels to Watch:
45,746 points – Relevant Resistance: corresponds to the Dow Jones record highs. A sustained breakout above this level could pave the way for a continuation of the uptrend.
45,023 points – Near-Term Support: coincides with recent lows and may act as a barrier for potential short-term pullbacks.
43,098 points – Critical Support: aligns with the 100- and 200-period simple moving averages. A move down to this zone could confirm a break in the uptrend and give way to a dominant bearish bias.
Written by Julian Pineda, CFA – Market Analyst
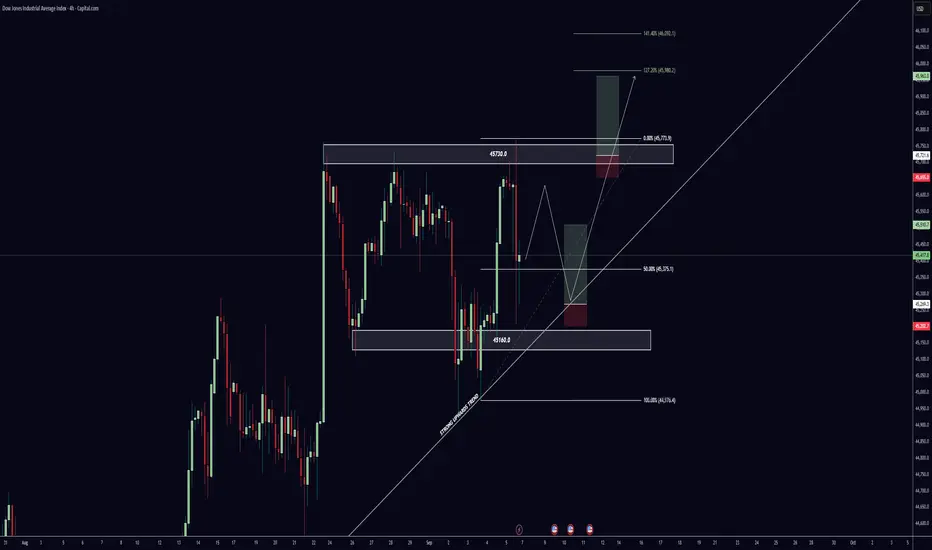
Dow Jones (US30) 4H AnalysisHey guys another quick one from me, here we see price is holding a strong upward trendline while consolidating between 45,160 support and 45,730 resistance level. Always look left because stucture leaves clues.
A retracement toward the 45,375 (50% Fib) level could offer a bullish entry.
If buyers hold above 45,160, price is likely to push higher toward 45,980 (127.2% Fib extension) and possibly 46,092 (141.4% Fib).
A break and close below 45,160 would invalidate this bullish scenario and shift momentum back to the downside.
📈 Bias: Bullish continuation as long as 45,160 holds.
🎯 Targets: 45,730 - 45,980 - 46,092.
🔑 Invalidation: Break below 45,160.
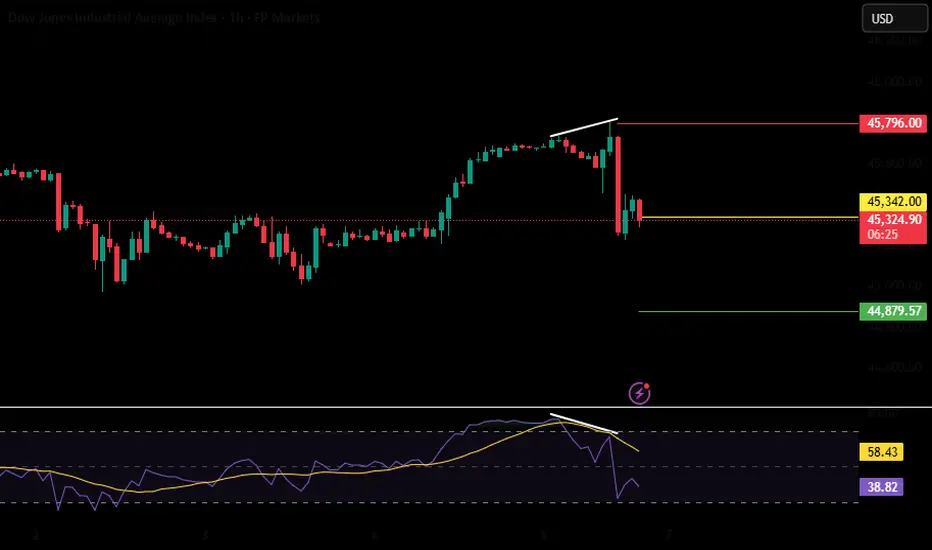
US30 | Bearish ContinuationAfter printing all time high and forming bearish divergence it is respecting its divergence and there are all signs point towards a bearish continuation pattern.
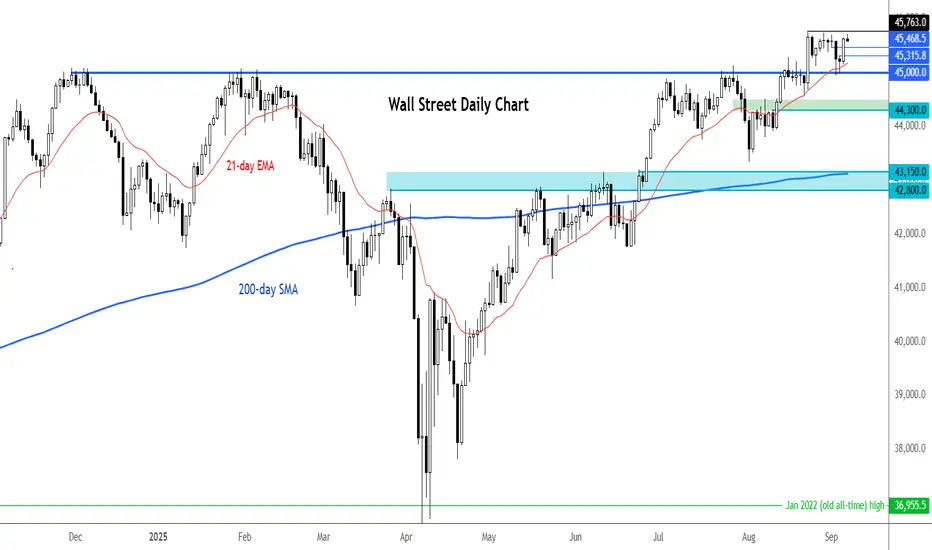
Dow Jones eyes new highs with NFP in sharp focusThe Dow was trading flat ahead of the release of the NFP data. A goldilocks report - one that is not too weak or too strong - is the best outcome for stocks as this will cement expectations for a September rate cut. A significantly weaker report will raise recession worries while a very strong number could weigh on rate cut bets, and pressure risk assets at least initially anyway.
The price action on the DOW has been near perfect after a retest of the 45K broken resistance from above giving way for a big bounce this week. With a couple of short-term resistance levels such as 45470 and 45315 taken out, these will now be the initial support levels to watch moving forward. The next upside target is liquidity resting above the all time high of 45,763.
By Fawad Razaqzada, market analyst with FOREX.com
US30: Move Down Expected! Short!
My dear friends,
Today we will analyse US30 together☺️
The in-trend continuation seems likely as the current long-term trend appears to be strong, and price is holding below a key level of 45,228.37 So a bearish continuation seems plausible, targeting the next low. We should enter on confirmation, and place a stop-loss beyond the recent swing level.
❤️Sending you lots of Love and Hugs❤️

Us30 sell Trade Setup Observed
Entry: Around 45,609 (current price zone).
Stop Loss (SL): 45,659 (≈ 50 points above entry).
Take Profit (TP): Significantly lower, around 45,300 (green zone).
Risk/Reward Ratio: 3.12 → This is a good ratio (favorable reward relative to risk).
Position Size: Qty 2.
---
📊 Price Action
1. Strong Upward Impulse: Prior to your trade, the market had a strong bullish rally (large green candles).
2. Consolidation Phase: After the rally, price is ranging in a tight band (sideways movement), marked by small alternating candles.
3.Manipulation is over and distribution si about to start

US30US30 has one more drop before any further upside in this structure.
Disclosure: We are part of Trade Nation's Influencer program and receive a monthly fee for using their TradingView charts in our analysis.

Will US30 Reach A New Record High After Today's NFP?Fundamental approach:
- The Dow Jones Industrial Average (US30) rose this week amid cooling US labor signals that reinforced expectations for a Sep Fed rate cut, while upbeat ISM services activity tempered growth concerns.
- ADP private payrolls slowed and jobless claims ticked higher, bolstering bets for easier policy ahead of today's NFP release. This kept risk appetite supported through Thu record-setting close in broader indices.
- The ISM Services PMI accelerated to 52.0 in Aug, with stronger business activity and new orders, but continued employment contraction, a mix consistent with disinflationary growth that equity markets favored. Salesforce (CRM) underperformed on a cautious revenue outlook even as rate-cut hopes lifted cyclicals within the Dow complex.
- Looking ahead, the index could extend gains if payrolls and earnings metrics cool without signaling a hard landing, as this may cement Fed easing later this month. Today's jobs report and subsequent Fed communications could be key catalysts for rate expectations and index momentum.
Technical approach:
- US30 bounced up from retesting the ascending channel's lower bounce, confluence with the support at 45000, and EMA21.
- If US30 breaches the resistance at around 45700, the index may accelerate to retest the confluencing area of several Fibo Extension levels at around 46680-46900.
- On the contrary, closing below 45000 may prompt a further correction to retest EMA78.
Analysis by: Dat Tong, Senior Financial Markets Strategist at Exness

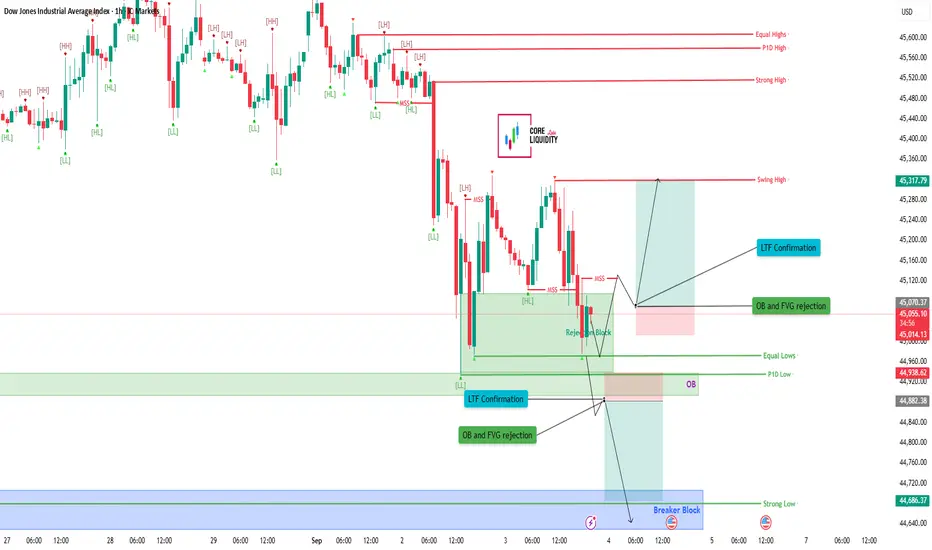
US30 – 1H | Testing Rejection Block & LTF Confirmation
Dow Jones is reacting from a rejection block with lower-timeframe confirmation showing. Market structure shift suggests possible retrace setups.
**Bullish Scenario:**
* Hold above 44,950–45,000 zone (OB & FVG support)
* LTF confirmation aligns with rejection block
* Upside targets: 45,320 swing high → 45,520 strong high
**Bearish Scenario:**
* Lose 44,950 and break below 44,900 P1D Low
* Continuation toward 44,700 breaker block → 44,680 strong low
* Deep downside if OB rejection fails
**Key Levels:**
* Resistance: 45,320 / 45,520 / 45,600
* Support: 44,950 / 44,900 / 44,700 / 44,680
💬 Will US30 hold rejection block for upside push, or break lower into the breaker block?
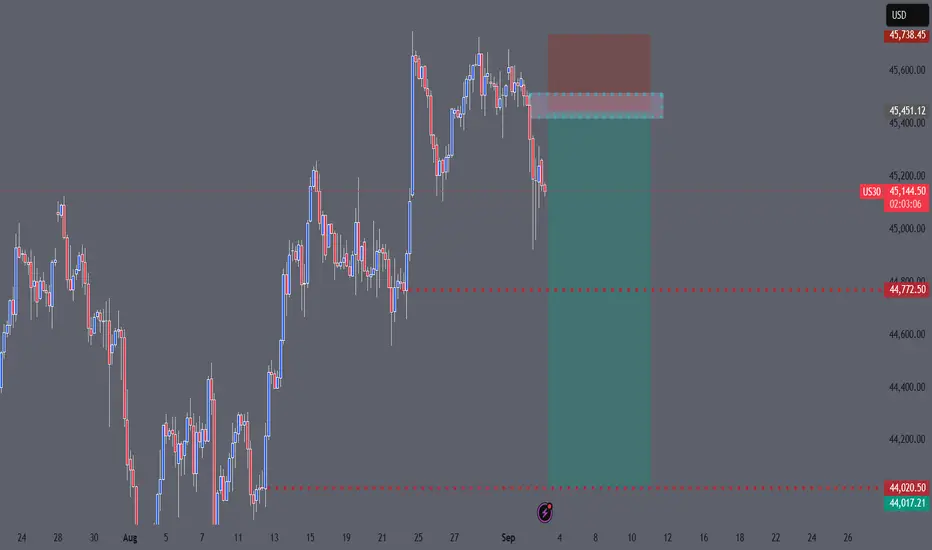
US30 WILL BLEEDWe are entering a short (sell) trade on US30 because the market failed to create new highs and reversed from a strong resistance/supply zone with good breakout, Structure and momentum now favor the downside. Targets are set at 44,770 and 44,020, with a stop above 45,740 to manage risk.
US30What is the US 30?
The US 30, commonly known as the Dow Jones Industrial Average (DJIA) or simply the Dow, is a stock market index that tracks the performance of 30 large publicly traded companies in the United States. It is one of the most widely followed equity indices and serves as a key indicator of the overall health of the US stock market and economy. The Dow includes companies from various sectors like technology, finance, health, and consumer goods.
How Do US 10Y Treasury Yield, DXY, and Fed Interest Rates Affect the US 30?
1. US 10-Year Treasury Yield (US10Y)
The 10-year Treasury yield reflects long-term borrowing costs and investor confidence in economic growth and inflation.
Higher yields often mean higher borrowing costs for companies, which can reduce corporate profits and lower stock prices, including the Dow.
Rising yields can also make bonds more attractive relative to stocks, leading to a shift away from equities like the Dow.
Conversely, lower yields tend to support higher stock valuations as cheaper debt and less attractive bond returns encourage investment in equities.
2. US Dollar Index (DXY)
The DXY measures the strength of the US dollar against a basket of major currencies.
A stronger dollar can negatively impact Dow companies that earn significant revenue overseas by making their products more expensive internationally and reducing translated foreign profits.
A weaker dollar generally supports multinational companies’ overseas earnings, potentially boosting the Dow.
Currency strength also influences inflation and trade dynamics, indirectly impacting stock market sentiment.
3. Federal Reserve Interest Rate
The Federal Reserve sets the federal funds rate, which influences short-term interest rates and overall financial conditions.
Higher Fed rates typically raise borrowing costs for businesses and consumers, potentially slowing growth and leading to lower stock prices.
Rising rates can also cause investors to prefer fixed-income securities over stocks.
Lower or stable Fed rates encourage borrowing and investment, supporting higher equity prices.
Fed communications about rate intentions are closely watched as key drivers of stock market volatility, including the Dow.
Summary
The US 30 (Dow Jones) is influenced by interest rates, bond yields, and the dollar's strength. Rising US 10-year yields or Fed rate hikes generally create headwinds for the Dow by increasing costs and attractive alternatives to stocks. A stronger dollar can weigh on multinational earnings and lower the Dow’s performance. Conversely, lower yields, dovish Fed policy, and a weaker dollar tend to support gains in the Dow by making stocks more appealing.
These factors together shape investor sentiment, risk appetite, and valuation dynamics in the US stock market.The US 30, also known as the Dow Jones Industrial Average (DJIA), is a stock market index that tracks 30 large, publicly traded U.S. companies. It serves as a key indicator of the overall health and performance of the U.S. stock market.
The US 10-Year Treasury Yield (US10Y) affects the US 30 because it reflects long-term interest rates and economic expectations. When the 10-year yield rises, borrowing costs increase for companies, which can dampen profits and lead to lower stock prices, negatively impacting the Dow. Higher yields also make bonds more attractive relative to stocks, pulling investment away from equities.
The US Dollar Index (DXY) measures the strength of the U.S. dollar against other major currencies. A stronger DXY can hurt Dow companies with significant overseas revenue by making their products more expensive abroad and reducing translated foreign earnings, weighing on the Dow. Conversely, a weaker dollar tends to boost these companies and support the index.
The Federal Reserve interest rate sets short-term borrowing costs and influences overall financial conditions. Higher Fed rates raise costs for consumers and businesses, potentially slowing economic growth and weighing on stocks. Lower or stable rates encourage borrowing and investment, supporting stock prices. Market expectations of Fed moves heavily sway investor sentiment and the Dow's performance.
In summary, higher US10Y yields, a stronger DXY, and rising Fed rates often pose headwinds for the US 30, while lower yields, a weaker dollar, and accommodative Fed policy generally support it. These dynamics affect corporate profits, investment flows, and market risk appetite that collectively drive the Dow Jones Industrial Average.
U330 ,the structure is giving a pullback into my demand floor and to the moon us30.
if bulls keep the trend into the supply structure ,they could be selling from that zone.
#us30

DowJones Key Trading Levels - resistance at 45766 Key Support and Resistance Levels
Resistance Level 1: 45766
Resistance Level 2: 45920
Resistance Level 3: 46080
Support Level 1: 45050
Support Level 2: 44900
Support Level 3: 44730
This communication is for informational purposes only and should not be viewed as any form of recommendation as to a particular course of action or as investment advice. It is not intended as an offer or solicitation for the purchase or sale of any financial instrument or as an official confirmation of any transaction. Opinions, estimates and assumptions expressed herein are made as of the date of this communication and are subject to change without notice. This communication has been prepared based upon information, including market prices, data and other information, believed to be reliable; however, Trade Nation does not warrant its completeness or accuracy. All market prices and market data contained in or attached to this communication are indicative and subject to change without notice.

DowJones important support at 45190Key Support and Resistance Levels
Resistance Level 1: 45800
Resistance Level 2: 46000
Resistance Level 3: 46200
Support Level 1: 45190
Support Level 2: 44960
Support Level 3: 44720
This communication is for informational purposes only and should not be viewed as any form of recommendation as to a particular course of action or as investment advice. It is not intended as an offer or solicitation for the purchase or sale of any financial instrument or as an official confirmation of any transaction. Opinions, estimates and assumptions expressed herein are made as of the date of this communication and are subject to change without notice. This communication has been prepared based upon information, including market prices, data and other information, believed to be reliable; however, Trade Nation does not warrant its completeness or accuracy. All market prices and market data contained in or attached to this communication are indicative and subject to change without notice.

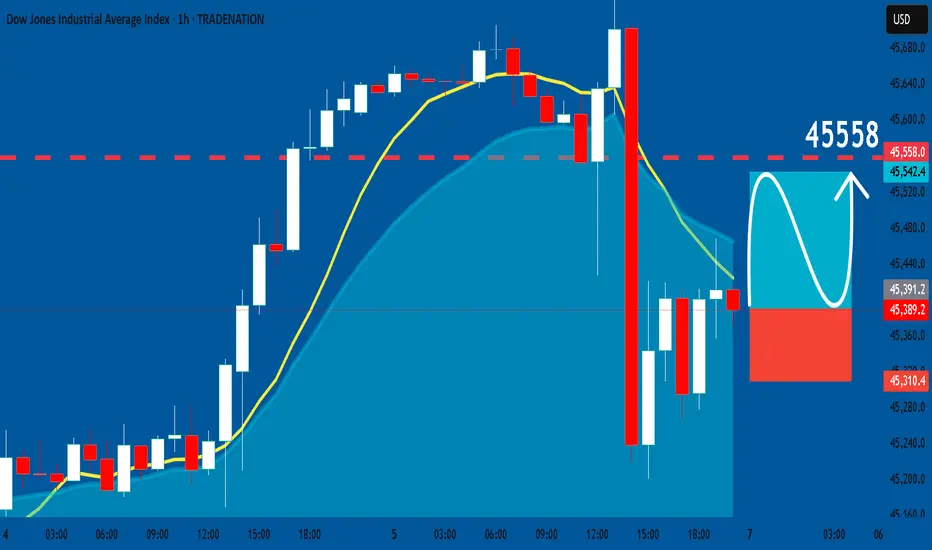
US30: Long Signal with Entry/SL/TP
US30
- Classic bullish setup
- Our team expects bullish continuation
SUGGESTED TRADE:
Swing Trade
Long US30
Entry Point - 45389
Stop Loss - 45310
Take Profit - 45558
Our Risk - 1%
Start protection of your profits from lower levels
Disclosure: I am part of Trade Nation's Influencer program and receive a monthly fee for using their TradingView charts in my analysis.
❤️ Please, support our work with like & comment! ❤️